. 2016 Aug 5:255:63-73.
doi: 10.1016/j.cbi.2015.10.009. Epub 2015 Oct 22.

Development of HepG2-derived cells expressing cytochrome P450s for assessing metabolism-associated drug-induced liver toxicity

Affiliations

Development of HepG2-derived cells expressing cytochrome P450s for assessing metabolism-associated drug-induced liver toxicity

Jiekun Xuan et al. Chem Biol Interact. .

Abstract

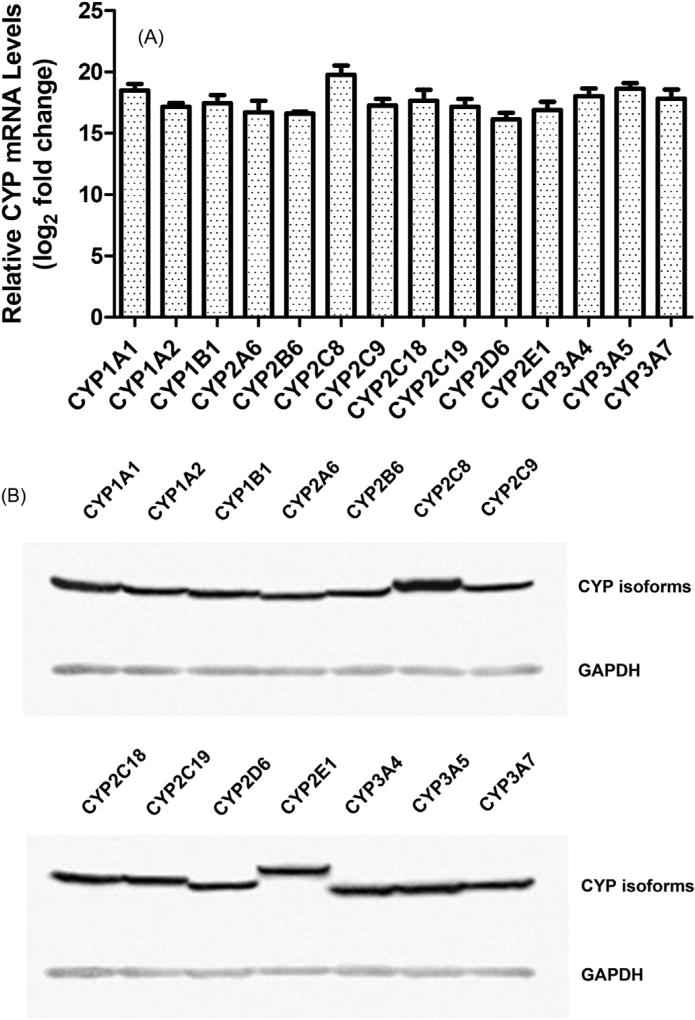
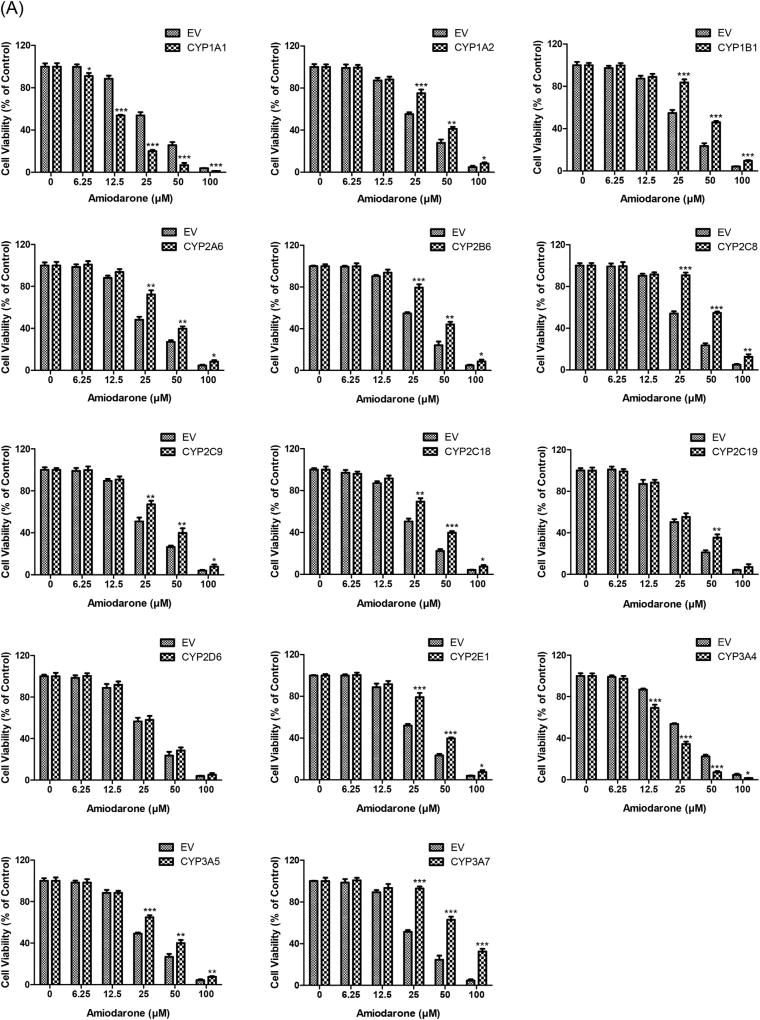
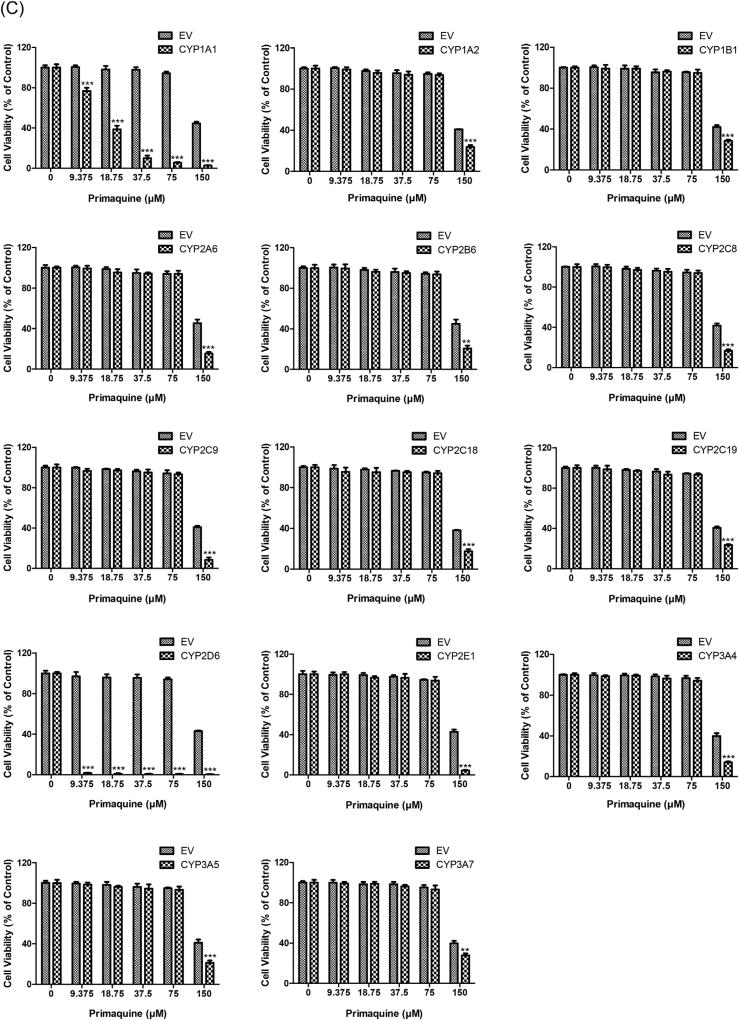
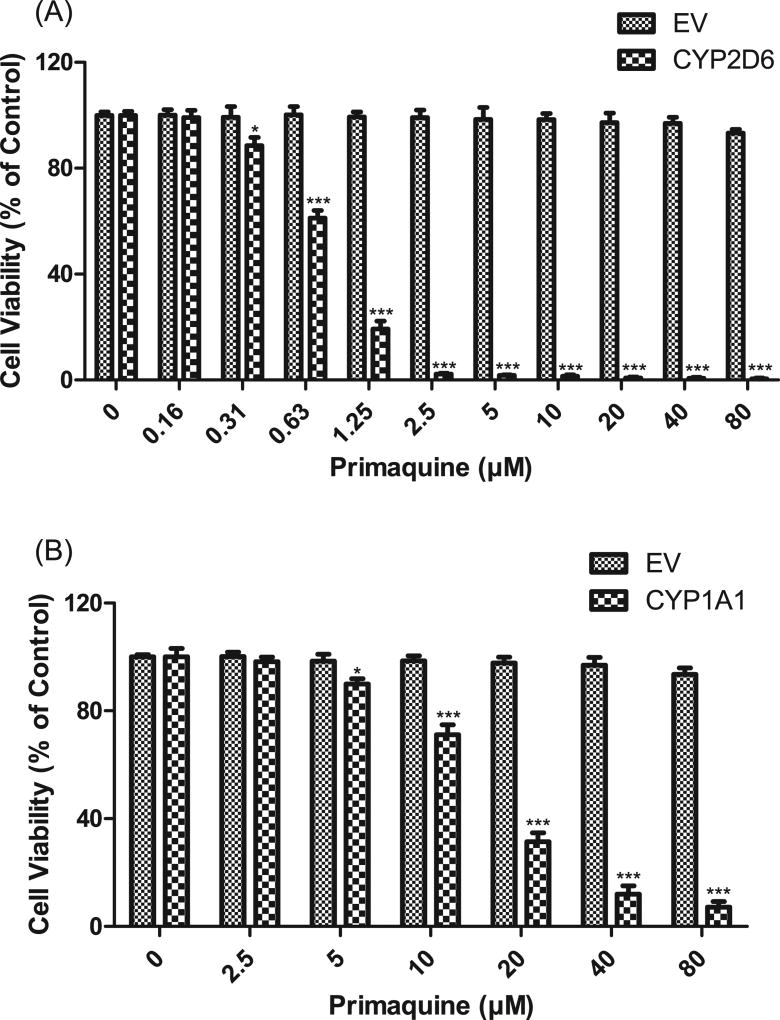
The generation of reactive metabolites from therapeutic agents is one of the major mechanisms of drug-induced liver injury (DILI). In order to evaluate metabolism-related toxicity and improve drug efficacy and safety, we generated a battery of HepG2-derived cell lines that express 14 cytochrome P450s (CYPs) (1A1, 1A2, 1B1, 2A6, 2B6, 2C8, 2C9, 2C18, 2C19, 2D6, 2E1, 3A4, 3A5 and 3A7) individually using a lentiviral expression system. The expression/production of a specific CYP in each cell line was confirmed by an increased abundance of the CYP at both mRNA and protein levels. Moreover, the enzymatic activities of representative CYPs in the corresponding cell lines were also measured. Using our CYP-expressed HepG2 cells, the toxicity of three drugs that could induce DILI (amiodarone, chlorpromazine and primaquine) was assessed, and all of them showed altered (increased or decreased) toxicity compared to the toxicity in drug-treated wild-type HepG2 cells. CYP-mediated drug toxicity examined in our cell system is consistent with previous reports, demonstrating the potential of these cells for assessing metabolism-related drug toxicity. This cell system provides a practical in vitro approach for drug metabolism screening and for early detection of drug toxicity. It is also a surrogate enzyme source for the enzymatic characterization of a particular CYP that contributes to drug-induced liver toxicity.

Keywords: Cytochrome P450s; Drug metabolizing enzyme; Drug-induced liver toxicity; HepG2.


Figures

Fig. 1
Fig. 1
Characterization of CYP expression in stably transduced HepG2 cells. (A) CYP mRNA expression. The mRNA levels of CYP isoforms in HepG2 cells stably transduced with individual CYP cDNAs or empty vector alone were measured by quantitative realtime PCR. Human β-actin was used as an internal control to normalize the amount of cDNA template. The fold expression of each CYP isoform relative to that in EV controls was determined by a comparative CT method. Data represent the mean ± SD of three independent experiments. (B) CYP protein expression. The protein levels of cDNA-expressed CYP isoforms that range in molecular weight between 45 and 60 kDa were detected by western blotting. GAPDH (37 kDa) was used as a loading control. Similar expression pattern was observed in three independent experiments.
Fig. 2
Fig. 2
Cytotoxicity of amiodarone (A), chlorpromazine (B) and primaquine (C) in HepG2 cells expressing individual human CYPs. CYP cDNAs or EV-transduced HepG2 cells were treated with three drugs at the indicated concentrations for 24 h. Cell viability was determined by the CellTiter-Glo assay after drug exposure. Similar results were observed in three independent experiments. The bar graphs represent mean ± SD of triplicate determinations. Statistical significance compared with EV controls: *p < 0.05, **p < 0.01, and ***p < 0.001.
Fig. 2
Fig. 2
Cytotoxicity of amiodarone (A), chlorpromazine (B) and primaquine (C) in HepG2 cells expressing individual human CYPs. CYP cDNAs or EV-transduced HepG2 cells were treated with three drugs at the indicated concentrations for 24 h. Cell viability was determined by the CellTiter-Glo assay after drug exposure. Similar results were observed in three independent experiments. The bar graphs represent mean ± SD of triplicate determinations. Statistical significance compared with EV controls: *p < 0.05, **p < 0.01, and ***p < 0.001.
Fig. 3
Fig. 3
Effects of CYP2D6 (A) and CYP1A1 (B) overexpression on primaquine cytotoxicity. HepG2 cells expressing CYP2D6 or CYP1A1 enzymes and control vector were exposed to various concentrations of primaquine for 24 h. The data are shown as mean ± SD of three independent experiments. *p < 0.05, **p < 0.01, and ***p < 0.001 compared with EV controls.

References

    1. Kaplowitz N. Idiosyncratic drug hepatotoxicity, nature reviews. Drug Discov. 2005;4:489–499. - PubMed
    1. Jaeschke H, McGill MR, Ramachandran A. Oxidant stress, mitochondria, and cell death mechanisms in drug-induced liver injury: lessons learned from acetaminophen hepatotoxicity. Drug Metab. Rev. 2012;44:88–106. - PMC - PubMed
    1. Ju C, Reilly T. Role of immune reactions in drug-induced liver injury (DILI) Drug Metab. Rev. 2012;44:107–115. - PubMed
    1. Yuan L, Kaplowitz N. Mechanisms of drug-induced liver injury. Clin. Liver Dis. 2013;17:507–518. vii. - PMC - PubMed
    1. Chen S, Xuan J, Couch L, Iyer A, Wu Y, Li QZ, Guo L. Sertraline induces endoplasmic reticulum stress in hepatic cells. Toxicology. 2014;322:78–88. - PMC - PubMed

MeSH terms