

Synchronized age-related gene expression changes across multiple tissues in human and the link to complex diseases
- PMID: 26477495
- PMCID: PMC4609956
- DOI: 10.1038/srep15145
Synchronized age-related gene expression changes across multiple tissues in human and the link to complex diseases
Erratum in
-
Corrigendum: Synchronized age-related gene expression changes across multiple tissues in human and the link to complex diseases.Sci Rep. 2016 Jan 21;6:19384. doi: 10.1038/srep19384. Sci Rep. 2016. PMID: 26795431 Free PMC article. No abstract available.
Abstract
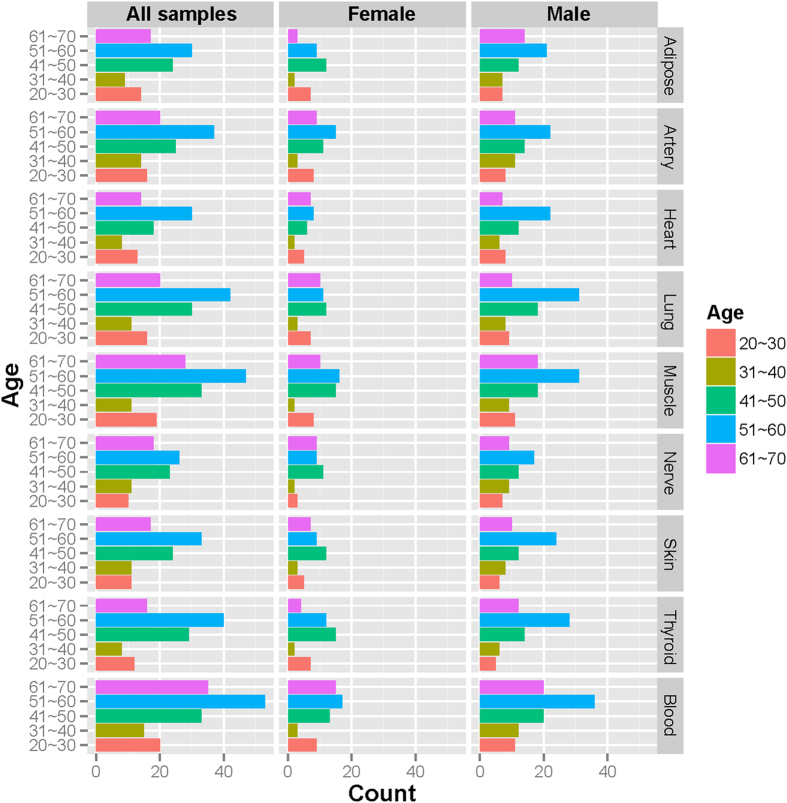
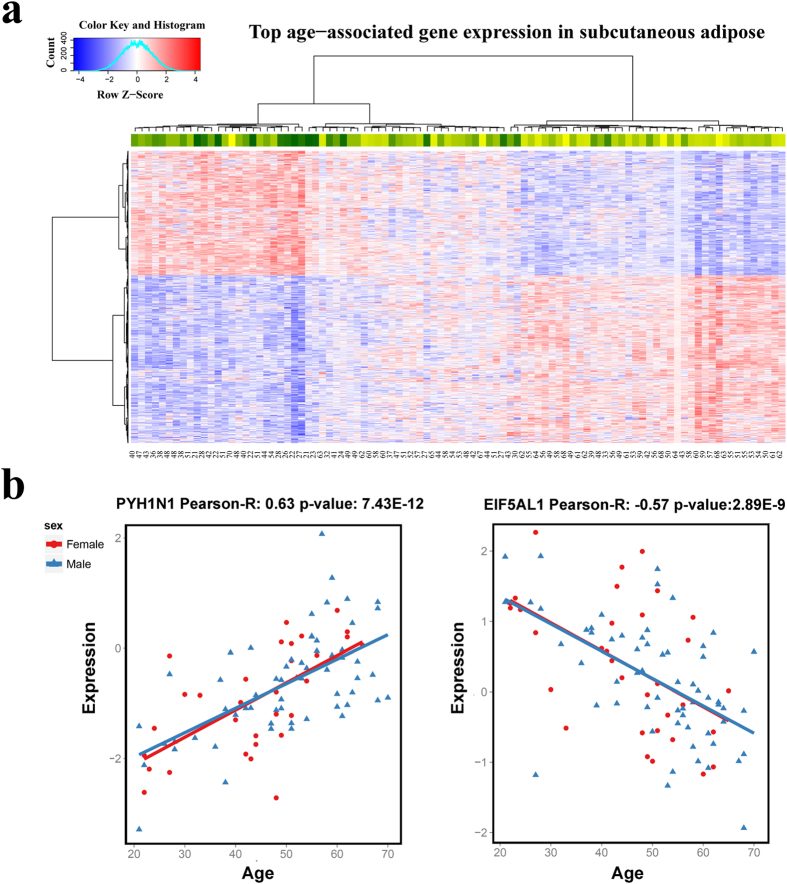
Aging is one of the most important biological processes and is a known risk factor for many age-related diseases in human. Studying age-related transcriptomic changes in tissues across the whole body can provide valuable information for a holistic understanding of this fundamental process. In this work, we catalogue age-related gene expression changes in nine tissues from nearly two hundred individuals collected by the Genotype-Tissue Expression (GTEx) project. In general, we find the aging gene expression signatures are very tissue specific. However, enrichment for some well-known aging components such as mitochondria biology is observed in many tissues. Different levels of cross-tissue synchronization of age-related gene expression changes are observed, and some essential tissues (e.g., heart and lung) show much stronger "co-aging" than other tissues based on a principal component analysis. The aging gene signatures and complex disease genes show a complex overlapping pattern and only in some cases, we see that they are significantly overlapped in the tissues affected by the corresponding diseases. In summary, our analyses provide novel insights to the co-regulation of age-related gene expression in multiple tissues; it also presents a tissue-specific view of the link between aging and age-related diseases.
Conflict of interest statement
The authors declare no competing financial interests.
Figures


References
-
- Mostoslavsky R. et al. Genomic instability and aging-like phenotype in the absence of mammalian SIRT6. Cell 124, 315–329 (2006). - PubMed
-
- Guarente L. & Picard F. Calorie restriction–the SIR2 connection. Cell 120, 473–482 (2005). - PubMed
-
- Kenyon C., Chang J., Gensch E., Rudner A. & Tabtiang R. A C-Elegans Mutant That Lives Twice as Long as Wild-Type. Nature 366, 461–464 (1993). - PubMed
Publication types
MeSH terms
Grants and funding
- MH101822/MH/NIMH NIH HHS/United States
- P30 CA016056/CA/NCI NIH HHS/United States
- U01 HG007610/HG/NHGRI NIH HHS/United States
- R01 MH101819/MH/NIMH NIH HHS/United States
- R01 MH090936/MH/NIMH NIH HHS/United States
- MH090948/MH/NIMH NIH HHS/United States
- MH090941/MH/NIMH NIH HHS/United States
- R01 MH090951/MH/NIMH NIH HHS/United States
- R01 MH101820/MH/NIMH NIH HHS/United States
- MH101819/MH/NIMH NIH HHS/United States
- R01 DA006227/DA/NIDA NIH HHS/United States
- MH090937/MH/NIMH NIH HHS/United States
- N01MH000028/MH/NIMH NIH HHS/United States
- R01 MH101782/MH/NIMH NIH HHS/United States
- R01 MH101810/MH/NIMH NIH HHS/United States
- MH101814/MH/NIMH NIH HHS/United States
- DA006227/DA/NIDA NIH HHS/United States
- R01 DA033684/DA/NIDA NIH HHS/United States
- MH101810/MH/NIMH NIH HHS/United States
- MH090936/MH/NIMH NIH HHS/United States
- MH101825/MH/NIMH NIH HHS/United States
- R01 MH101825/MH/NIMH NIH HHS/United States
- R01 MH090948/MH/NIMH NIH HHS/United States
- R01 MH090941/MH/NIMH NIH HHS/United States
- DA033684/DA/NIDA NIH HHS/United States
- MH090951/MH/NIMH NIH HHS/United States
- R01 MH101822/MH/NIMH NIH HHS/United States
- MH101820/MH/NIMH NIH HHS/United States
- MH101782/MH/NIMH NIH HHS/United States
- HHSN261200800001C/RC/CCR NIH HHS/United States
- R01 MH090937/MH/NIMH NIH HHS/United States
- HHSN268201000029C/HL/NHLBI NIH HHS/United States
- HHSN261200800001E/CA/NCI NIH HHS/United States
- R01 MH101814/MH/NIMH NIH HHS/United States
- P30 DK020595/DK/NIDDK NIH HHS/United States
LinkOut - more resources
Full Text Sources
Other Literature Sources
Medical
