. 2016 Jan 15:125:350-362.
doi: 10.1016/j.neuroimage.2015.10.017. Epub 2015 Oct 20.

Laminar microvascular transit time distribution in the mouse somatosensory cortex revealed by Dynamic Contrast Optical Coherence Tomography

Affiliations

Laminar microvascular transit time distribution in the mouse somatosensory cortex revealed by Dynamic Contrast Optical Coherence Tomography

Conrad W Merkle et al. Neuroimage. .

Abstract

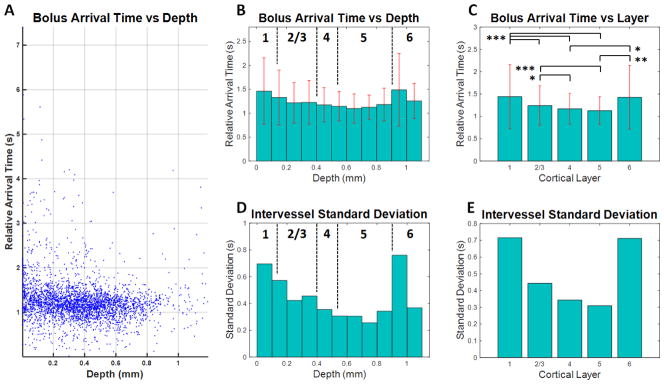
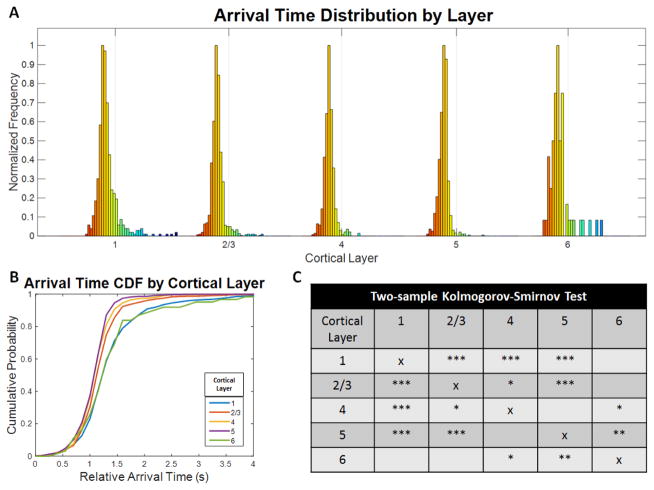
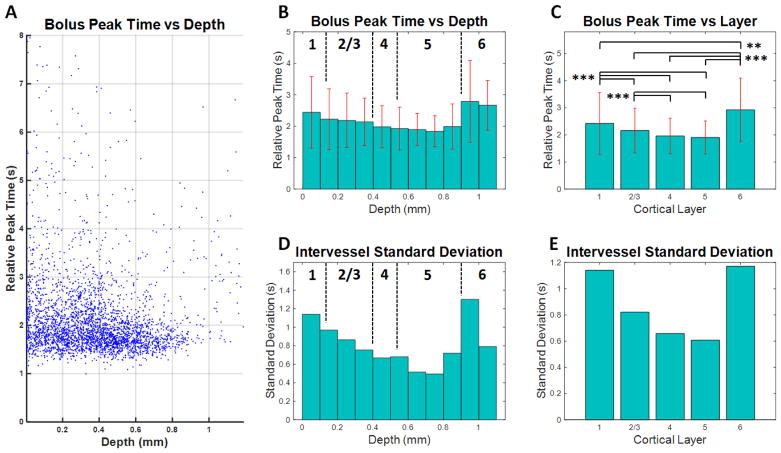
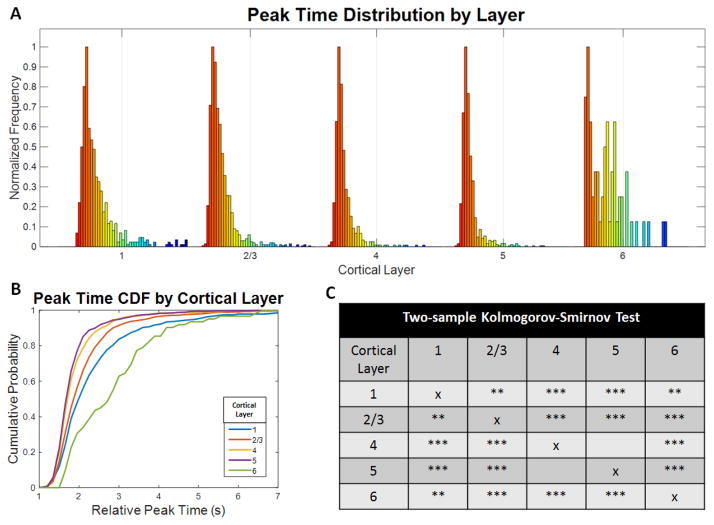
The transit time distribution of blood through the cerebral microvasculature both constrains oxygen delivery and governs the kinetics of neuroimaging signals such as blood-oxygen-level-dependent functional Magnetic Resonance Imaging (BOLD fMRI). However, in spite of its importance, capillary transit time distribution has been challenging to quantify comprehensively and efficiently at the microscopic level. Here, we introduce a method, called Dynamic Contrast Optical Coherence Tomography (DyC-OCT), based on dynamic cross-sectional OCT imaging of an intravascular tracer as it passes through the field-of-view. Quantitative transit time metrics are derived from temporal analysis of the dynamic scattering signal, closely related to tracer concentration. Since DyC-OCT does not require calibration of the optical focus, quantitative accuracy is achieved even deep in highly scattering brain tissue where the focal spot degrades. After direct validation of DyC-OCT against dilution curves measured using a fluorescent plasma label in surface pial vessels, we used DyC-OCT to investigate the transit time distribution in microvasculature across the entire depth of the mouse somatosensory cortex. Laminar trends were identified, with earlier transit times and less heterogeneity in the middle cortical layers. The early transit times in the middle cortical layers may explain, at least in part, the early BOLD fMRI onset times observed in these layers. The layer-dependencies in heterogeneity may help explain how a single vascular supply manages to deliver oxygen to individual cortical layers with diverse metabolic needs.

Keywords: Blood flow; Dynamic contrast; Functional magnetic resonance imaging; Hemodynamics; Optical coherence tomography; Transit time.


Figures

Figure 1
Figure 1
Imaging setup. By modifying a Thorlabs Telesto 1325 nm OCT system, spatially co-registered dynamic fluorescence and OCT imaging was performed simultaneously. The schematic for this system is shown with the following abbreviations: SLED – Superluminescent Diode, LSC – Line Scan Camera, DG – Diffraction Grating, DM – Dichroic Mirror, GM – Galvanometer Mirror, DGM – Dichroic Galvanometer Mirror, LPF – Long-Pass Filter, OBJ – Objective Lens, VIS – Visible, BS – Beam Splitter, CCD – Charge-Coupled Device Camera. Italicized and underlined labels denote components added to enable fluorescence imaging. Due to the spatial constraints imposed by the commercial probe, the long-pass filter, used to reject stray excitation light, was placed in the OCT beam path. This caused an estimated 15% excess loss in OCT signal intensity. Components for fluorescence imaging were removed when the fluorescence channel was not used. Cyan lines denote excitation light, green lines represent light with a wavelength in the emission spectrum, and red lines represent the OCT beam with a center wavelength of 1325 nm.
Figure 2
Figure 2
DyC-OCT image acquisition and processing. DyC-OCT imaging produces 3-D stacks of data which are then processed along the temporal axis by fitting a model to the indicator-dilution response represented by the OCT signal at every (x,z) location. A) DyC-OCT follows a simple imaging protocol in which an OCT tracer is injected via the tail vein, repeated B-scans are acquired at the region-of-interest directly following injection, and the acquired data is processed. B) DyC-OCT generates a 3-D stack of temporally-resolved B-scans at the region-of-interest as the tracer passes through. C) Selection of the temporal profile associated with a single location. D) A typical DyC-OCT signal showing a baseline level before the bolus arrives, a sharp increase followed by slow decrease in signal with the first passage of the tracer bolus, eventually settling at a level higher than baseline due to recirculation of the tracer. E) Second-Order Plus Dead Time (SOPDT) model fitting and extraction of features such as arrival time, FWHM, and peak time. F) Recirculation degrades the accuracy of the model’s fit. The red dotted line associated with the poor fit, shown in red, marks the cutoff point which includes recirculation. The black dotted line associated with the better fit, shown in black, marks a cutoff at 5 s that avoids recirculation. G) However, when the same 5 s cutoff from F) (red dotted line) is used in a different vessel, the fit, shown in red, is poor. A better fit, shown in black, is achieved using an adaptively determined cutoff (black dotted line). For this reason, the cutoff for fitting was adaptively determined for each vessel.
Figure 3
Figure 3
DyC-OCT cross-sectional mapping of the mouse cortex. Pixel-by-pixel analysis of the DyC-OCT signal following bolus injection of a contrast agent, reveals functional information about microvascular networks in the mouse cortex. Surface arteries and veins, marked with a blue “V” or red “A” respectively, were identified prior to DyC-OCT imaging through inspection of an enface angiogram. A–B) Intralipid (contrast) injection significantly increases the angiogram signal in the vasculature in the imaged cross-sectional plane. C) The gray and white masks show where the increase in angiogram signal exceeded the noise threshold. The white mask represents the vessels that were further analyzed after size and goodness of fit thresholding. Large vessels and noise (gray mask) were rejected. D) Goodness of the model’s fit shows that the best fits correspond to regions with a large signal increase. E–F) The arrival times and peak times of the tracer, extracted from them SOPDT model, separate arteries and veins, and illustrate capillary heterogeneity.
Figure 4
Figure 4
DyC-OCT validation. Simultaneous and co-registered dynamic fluorescence and DyC-OCT show that Intralipid dilution curves are similar to those of FITC-Dextran (a blood plasma tracer), after a simultaneous bolus injection containing both. Wide-field dynamic fluorescence images and OCT B-scans were acquired at a rate of 30 Hz over the same field of view. A–B) By applying the processing methods described in Figure 3 to dynamic fluorescence data, en face arrival time and peak time maps were generated for the superficial vasculature. C) Normalized DyC-OCT (blue) and fluorescence (red) intensity signals corresponding to the passage of their respective tracers through the same vein location. D) The strong linear relationship (dotted red line) between the two signals is shown to have an R2 value of 0.94 and p ≪ 0.0005. Data were binned in segments of 0.2 seconds with vertical error bars showing the standard deviation of the OCT signal and horizontal error bars showing the standard deviation of the fluorescence signal within each temporal bin.
Figure 5
Figure 5
Arrival time as a function of depth in the mouse somatosensory cortex. By segmenting the arrival time maps from 10 different mice, transit time trends associated with the microvasculature were revealed. Large vessels were excluded based on size (exclusion criteria: radius > 16 μm). A) Relative arrival times in microvessels from all 10 mice are presented as a function of depth. Each point is the mean arrival time within a single microvessel. B) The mean arrival time decreases with depth down to the middle cortical layers (layers 4–5), followed by an increase in layers 5–6. Estimated boundaries of different cortical layers are shown as dotted black lines and standard deviations are shown as red error bars. C) When layer-averaged arrival times were compared across mice, the middle cortical layers displayed shorter arrival times. Statistical testing used the Kruskal-Wallis test followed by Tukey’s Honestly Significant Difference test to account for multiple comparisons (* p < 0.05, ** p < 0.005, and *** p < 0.0005). D–E) The intervessel standard deviation also decreased with depth down to the middle cortical layers, reaching a minimum in layer 5.
Figure 6
Figure 6
Arrival time distributions in each layer of the mouse somatosensory cortex. A) The arrival time distributions in microvasculature vary across cortical layers. The color indicates relative arrival time where red is earlier (more arterial) and blue is later (more venous). The gray line marks a 2 second arrival time in each distribution. The middle cortical layers show narrower distributions with fewer long arrival time vessels. B) The cumulative probability functions for the arrival time distributions of each layer shown in A) emphasize layer dependencies with layers 4 and 5 showing the earliest and least heterogeneous arrival times. C) Two-sample Kolmogorov-Smirnov tests were applied to each pair of layers and corrected for multiple comparisons using the Bonferroni correction and show that 7 out of 10 layer pairs are statistically significant. The number of asterisks denotes the level of statistical significance (* p < 0.05, ** p < 0.005, and *** p < 0.0005).
Figure 7
Figure 7
Peak time as a function of depth in the mouse somatosensory cortex. By segmenting the peak time maps from 10 different mice, transit time trends associated with the microvasculature were revealed. Large vessels were excluded based on size (exclusion criteria: radius > 16 μm). A) Relative peak times in microvessels from all 10 mice are presented as a function of depth. Each point is the mean peak time within a single microvessel. B) The mean peak time decreases with depth down to layer 5, around 700–800 microns followed by an increase in layers 5–6. Estimated boundaries of different cortical layers are shown as dotted black lines and standard deviations are shown as red error bars. C) When layer-averaged peak times were compared across mice, the middle cortical layers (layers 4–5) displayed shorter peak times. Statistical testing used the Kruskal-Wallis test followed by Tukey’s Honestly Significant Difference test to account for multiple comparisons (** p < 0.005 and *** p < 0.0005). D–E) The intervessel standard deviation also decreased with depth, reaching a minimum in layer 5 around 600–800 microns.
Figure 8
Figure 8
Peak time distributions in each layer of the mouse somatosensory cortex. The peak time distributions in microvasculature vary across cortical layers. The color indicates relative peak time where red is earlier (more arterial) and blue is later (more venous). The gray line marks a 4 second peak time in each distribution. Layer 4 shows a substantial decrease in width compared to the other layers. B) The cumulative probability functions for the peak time distributions of each layer shown in A) emphasize layer dependencies with layers 4 and 5 showing the earliest and least heterogeneous peak times. C) Two-sample Kolmogorov-Smirnov tests were applied to each pair of layers and corrected for multiple comparisons using the Bonferroni correction and show that 9 out of 10 layer pairs are statistically significant. The number of asterisks denotes the level of statistical significance (* p < 0.05, ** p < 0.005, and *** p < 0.0005).

Similar articles

Cited by

References

    1. Kety SS, Schmidt CF. The Nitrous Oxide Method for the Quantitative Determination of Cerebral Blood Flow in Man: Theory, Procedure and Normal Values. J Clin Invest. 1948;27(4):476–83. - PMC - PubMed
    1. Kety SS. The theory and applications of the exchange of inert gas at the lungs and tissues. Pharmacol Rev. 1951;3(1):1–41. - PubMed
    1. Duling BR, Berne RM. Longitudinal gradients in periarteriolar oxygen tension a possible mechanism for the participation of oxygen in local regulation of blood flow. Circulation Research. 1970;27(5):669–678. - PubMed
    1. Buxton RB. Introduction to Functional Magnetic Resonance Imaging: Principles and Techniques. Cambridge University Press; 2002.
    1. Marota JJ, et al. Investigation of the early response to rat forepaw stimulation. Magn Reson Med. 1999;41(2):247–52. - PubMed

Publication types

LinkOut - more resources