

The absolute CBF response to activation is preserved during elevated perfusion: Implications for neurovascular coupling measures
- PMID: 26477657
- PMCID: PMC4692513
- DOI: 10.1016/j.neuroimage.2015.10.023
The absolute CBF response to activation is preserved during elevated perfusion: Implications for neurovascular coupling measures
Abstract
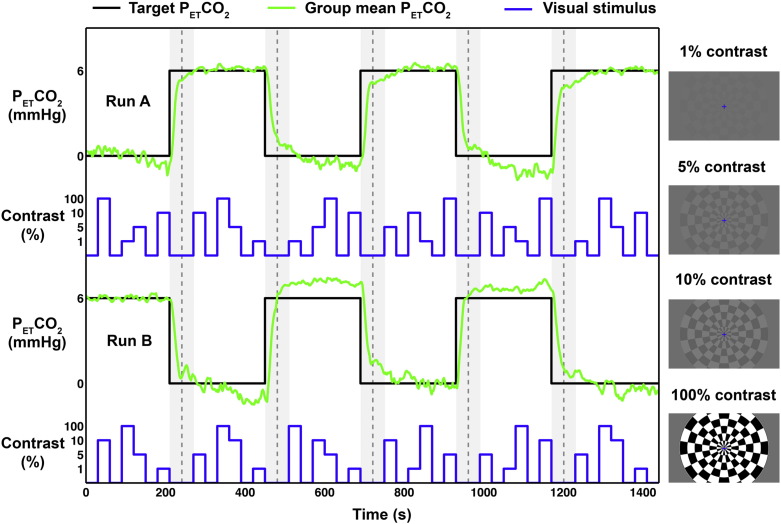
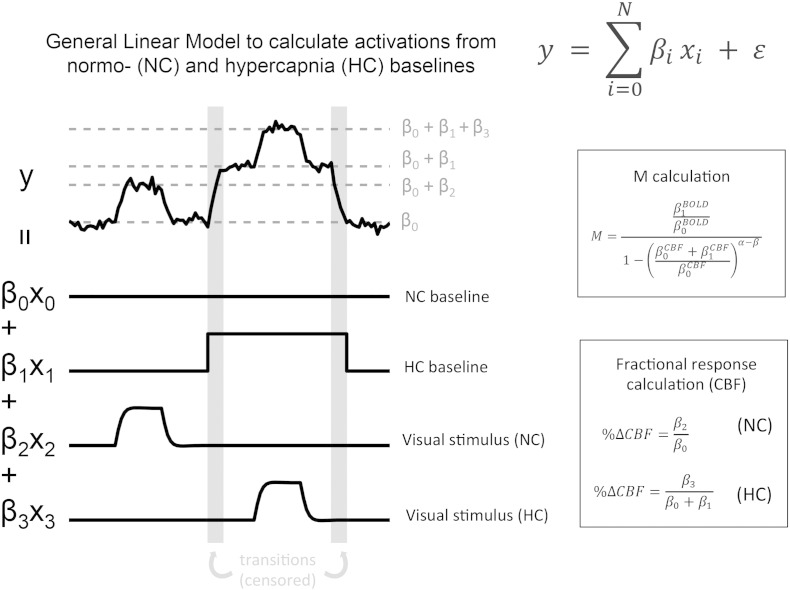
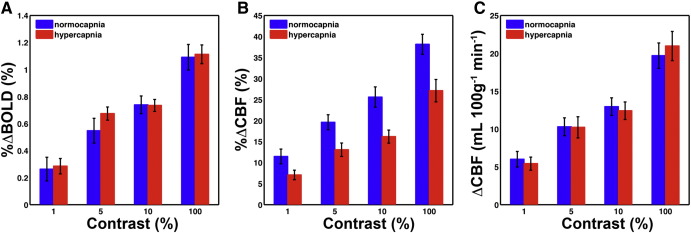
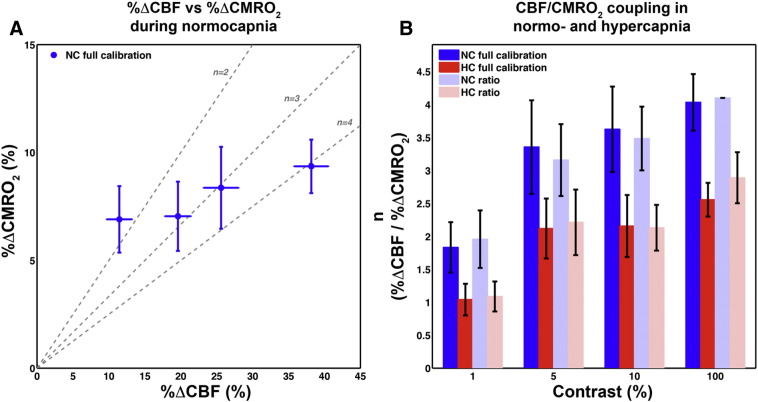
Functional magnetic resonance imaging (fMRI) techniques in which the blood oxygenation level dependent (BOLD) and cerebral blood flow (CBF) response to a neural stimulus are measured, can be used to estimate the fractional increase in the cerebral metabolic rate of oxygen consumption (CMRO2) that accompanies evoked neural activity. A measure of neurovascular coupling is obtained from the ratio of fractional CBF and CMRO2 responses, defined as n, with the implicit assumption that relative rather than absolute changes in CBF and CMRO2 adequately characterise the flow-metabolism response to neural activity. The coupling parameter n is important in terms of its effect on the BOLD response, and as potential insight into the flow-metabolism relationship in both normal and pathological brain function. In 10 healthy human subjects, BOLD and CBF responses were measured to test the effect of baseline perfusion (modulated by a hypercapnia challenge) on the coupling parameter n during graded visual stimulation. A dual-echo pulsed arterial spin labelling (PASL) sequence provided absolute quantification of CBF in baseline and active states as well as relative BOLD signal changes, which were used to estimate CMRO2 responses to the graded visual stimulus. The absolute CBF response to the visual stimuli were constant across different baseline CBF levels, meaning the fractional CBF responses were reduced at the hyperperfused baseline state. For the graded visual stimuli, values of n were significantly reduced during hypercapnia induced hyperperfusion. Assuming the evoked neural responses to the visual stimuli are the same for both baseline CBF states, this result has implications for fMRI studies that aim to measure neurovascular coupling using relative changes in CBF. The coupling parameter n is sensitive to baseline CBF, which would confound its interpretation in fMRI studies where there may be significant differences in baseline perfusion between groups. The absolute change in CBF, as opposed to the change relative to baseline, may more closely match the underlying increase in neural activity in response to a stimulus.
Keywords: Arterial spin labelling (ASL); Blood flow-oxygen metabolism coupling; Calibrated BOLD; Cerebral blood flow (CBF); Cerebral metabolic rate of oxygen consumption (CMRO(2)); Functional MRI.
Copyright © 2015 The Authors. Published by Elsevier Inc. All rights reserved.
Figures
References
-
- Attwell D., Laughlin S.B. An energy budget for signaling in the grey matter of the brain. J. Cereb. Blood Flow Metab. 2001;21(10):1133–1145. - PubMed
-
- Bandettini P.A., Wong E.C. A hypercapnia-based normalization method for improved spatial localization of human brain activation with fMRI. NMR Biomed. 1997;10(4–5):197–203. - PubMed
Publication types
MeSH terms
Substances
Grants and funding
LinkOut - more resources
Full Text Sources
Other Literature Sources
