. 2015 Oct 19:5:15185.
doi: 10.1038/srep15185.

Comparison of acute non-visual bright light responses in patients with optic nerve disease, glaucoma and healthy controls

Affiliations

Comparison of acute non-visual bright light responses in patients with optic nerve disease, glaucoma and healthy controls

M Münch et al. Sci Rep. .

Abstract

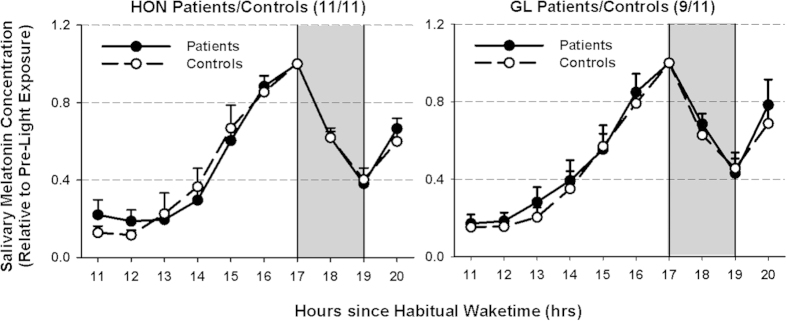
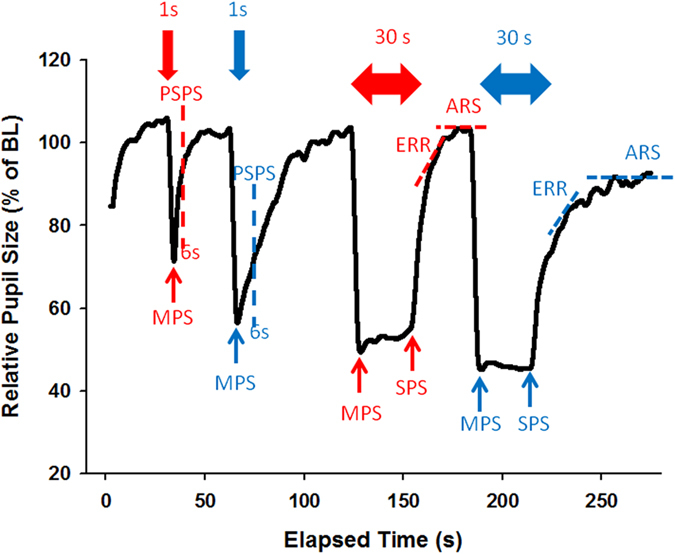
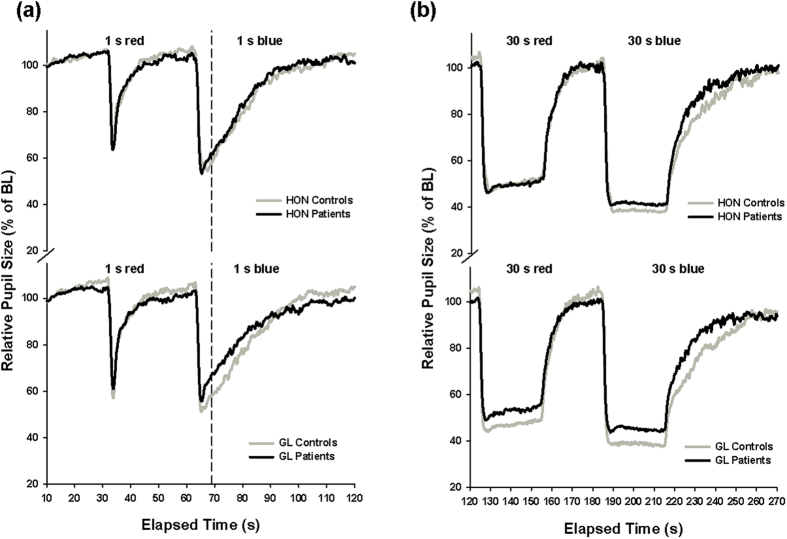
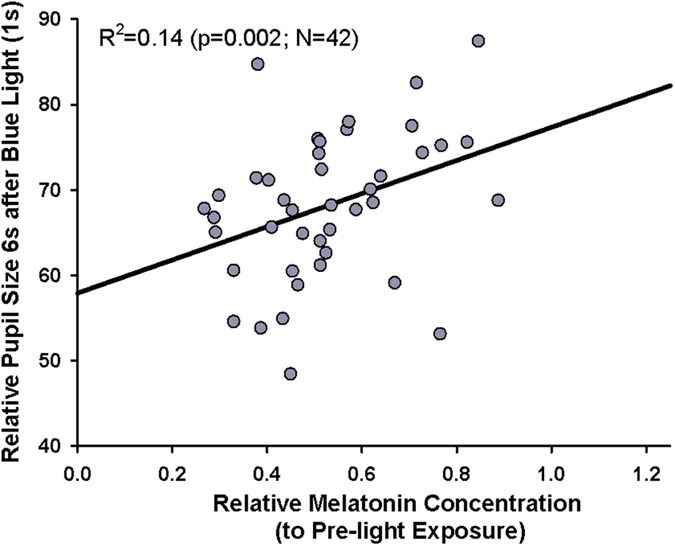
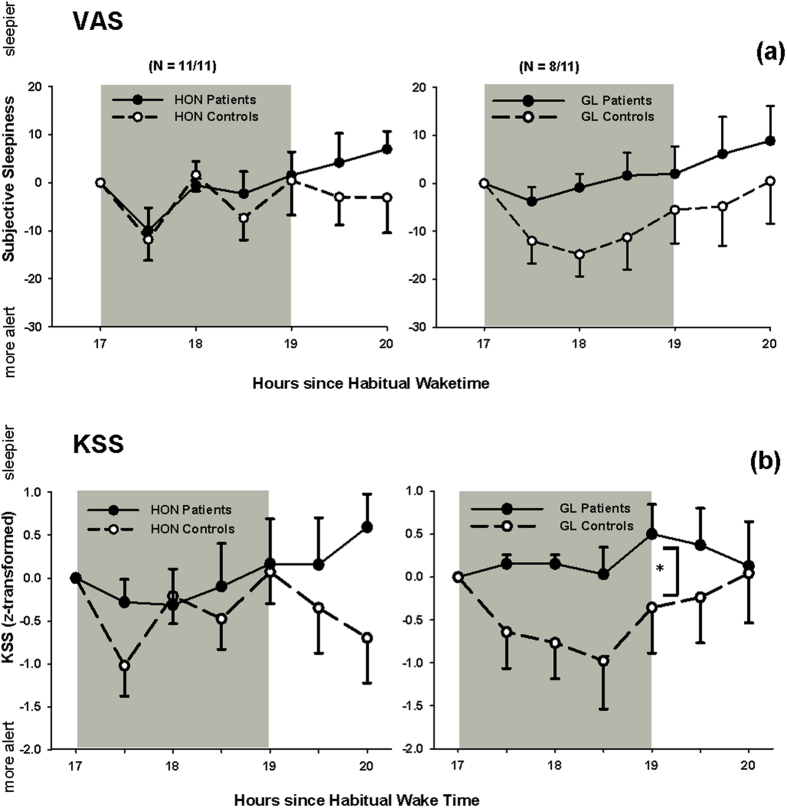
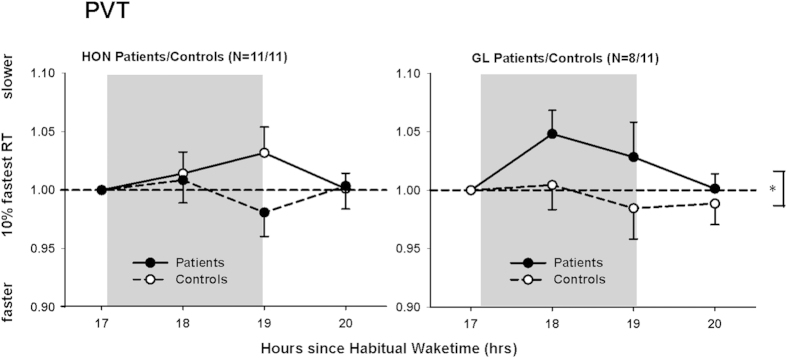
This study examined the effect of optic nerve disease, hence retinal ganglion cell loss, on non-visual functions related to melanopsin signalling. Test subjects were patients with bilateral visual loss and optic atrophy from either hereditary optic neuropathy (n = 11) or glaucoma (n = 11). We measured melatonin suppression, subjective sleepiness and cognitive functions in response to bright light exposure in the evening. We also quantified the post-illumination pupil response to a blue light stimulus. All results were compared to age-matched controls (n = 22). Both groups of patients showed similar melatonin suppression when compared to their controls. Greater melatonin suppression was intra-individually correlated to larger post-illumination pupil response in patients and controls. Only the glaucoma patients demonstrated a relative attenuation of their pupil response. In addition, they were sleepier with slower reaction times during nocturnal light exposure. In conclusion, glaucomatous, but not hereditary, optic neuropathy is associated with reduced acute light effects. At mild to moderate stages of disease, this is detected only in the pupil function and not in responses conveyed via the retinohypothalamic tract such as melatonin suppression.


Conflict of interest statement

Dr Kawasaki has received book royalties from Cambridge University Press.

Figures

Figure 1
Figure 1. Relative salivary melatonin concentrations for HON patients (left side) and GL patients (right side) and their controls before, during and after 2 hours of light exposure (LE) at night.
Values are expressed relative to pre-light exposure melatonin concentrations. In response to light exposure (starting after 17 hours after habitual wake time), salivary melatonin was similarly suppressed in both patient groups (HON and GL) when compared to their controls (p > 0.6). Filled circles and solid lines = patients; open circles and dashed lines = controls. N = 11 in each group except for GL patients (N = 9; mean + SEM; grey areas indicate the light exposure).
Figure 2
Figure 2. Pupillogram with all metrics and legend with abbreviations.
The schematic of the protocol from one recording with the following variables is shown: BL = Baseline pupil size (pupil diameter during the first 10 s of recording in darkness = 100%). Pupil size was expressed relative to baseline (actual pupil diameter/BL pupil diameter*100). MPS = Minimum Pupil size during 1 s and 30 s light stimuli (red and blue); PSPS = Post-Stimulus pupil size at 6 s after 1 s stimulus offset (red and blue); SPS = sustained pupil size; ERR = Exponential redilation rate after 30 s stimulus offset (%−s); ARS = Asymptotic re-dilation size after 30 s light blue and red light stimuli. The bold colored arrows at the top indicate the 1 s red and blue light stimuli as well as the 30 s red and blue light stimuli.
Figure 3
Figure 3
(a,b) Averaged (from three recordings) pupil tracings for the 1 s (a) and 30 s (b) red and blue light stimuli for HON patients (upper graphs) and GL patients (lower graphs) and their controls (black lines = patients; N = 11/11; grey lines = controls; N = 11/11). The vertical dashed line indicates the approximate pupil size 6s after light termination (=PSPS). Significant differences were observed between GL patients and controls but not between HON patients and controls except for the minimum pupil size (MPS) during 30 s (p < 0.05). For more results, see Table 2.
Figure 4
Figure 4. Spearman Correlation between post-stimulus pupil size in response to 1 s blue light (relative to baseline) and mean salivary melatonin concentration (relative to pre-light exposure).
Smaller melatonin concentrations indicate greater melatonin suppression; N = 42 (grey circles). The black line shows the regression line (Correlation R2 = 0.14; p = 0.002).
Figure 5
Figure 5
(a,b) Subjective sleepiness in patients and controls during and after light exposure assessed from (a). Visual analogue scales (VAS; difference to pre-light exposure) and (b). Karolinska sleepiness scale (KSS; z-transformed data) in patients (filled circles, solid lines) and controls (open circles, dashed lines). HON patients and their controls are shown on the left side; GL patients and their controls are shown on the right side. From the VAS, HON patients and controls acutely responded to light exposure (p < 0.05; main effect of time), but there was no significant difference in sleepiness between HON and GL patients and controls (means + or − SEM; grey area = light exposure) during and after LE. From the KSS, GL patients became significantly sleepier during LE compared to controls. HON patients respond similarly as their controls.
Figure 6
Figure 6. Changes in the 10% fastest reaction times (ms) in the Psychomotor Vigilance Test (PVT) during and after light exposure for HON patients (left side) and GL patients (right side) and their controls.
The 10% fastest reaction times (ms) were similar for HON patients and controls (relative to pre-light exposure), but GL patients were significantly slower than their controls in response to bright LE (N = 11 in each group except for GL patients: N = 8; filled circles = patients; open circles = controls; *<0.05). Grey bars indicate constant bright light exposure (means + or – SEM).

References

    1. Berson D. M., Dunn F. A. & Takao M. Phototransduction by retinal ganglion cells that set the circadian clock. Science 295, 1070–1073 (2002). - PubMed
    1. Hattar S., Liao H., Takao M., Berson D. M. & Yau K. Melanopsin-containing retinal ganglion cells: architecture, projections, and intrinsic photosensitivity. Science 295, 1065–1070 (2002). - PMC - PubMed
    1. Ruby N. et al. Role of melanopsin in circadian responses to light. Science 298, 2211–2213 (2002). - PubMed
    1. Lucas R. J. et al. Diminished pupillary light reflex at high irradiances in melanopsin-knockout mice. Science 299, 245–247 (2003). - PubMed
    1. Mure L., Rieux C., Hattar S. & Cooper H. Melanopsin-dependent nonvisual responses: evidence for photopigment bistability in vivo. J Biol Rhythms 22, 411–424 (2007). - PMC - PubMed

Publication types

MeSH terms