. 2015 Oct 19:5:15296.
doi: 10.1038/srep15296.

Prioritization of candidate genes in "QTL-hotspot" region for drought tolerance in chickpea (Cicer arietinum L.)

Affiliations

Prioritization of candidate genes in "QTL-hotspot" region for drought tolerance in chickpea (Cicer arietinum L.)

Sandip M Kale et al. Sci Rep. .

Abstract

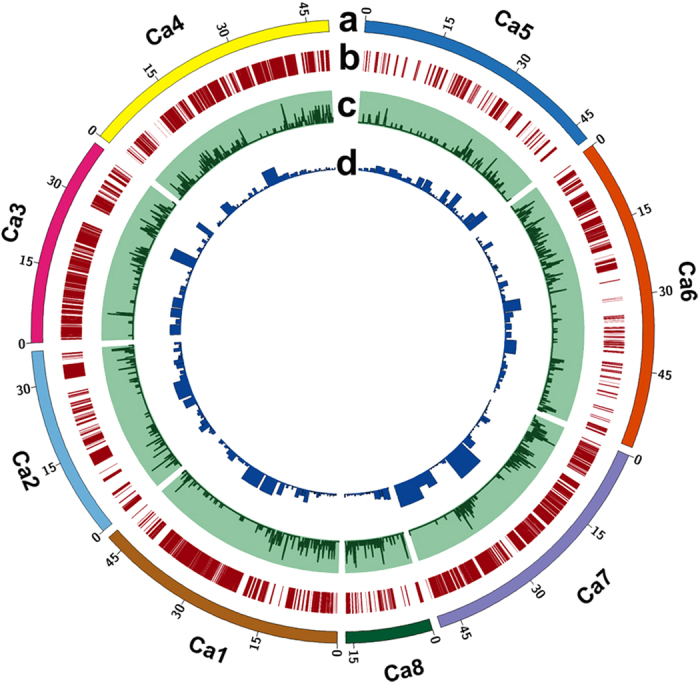
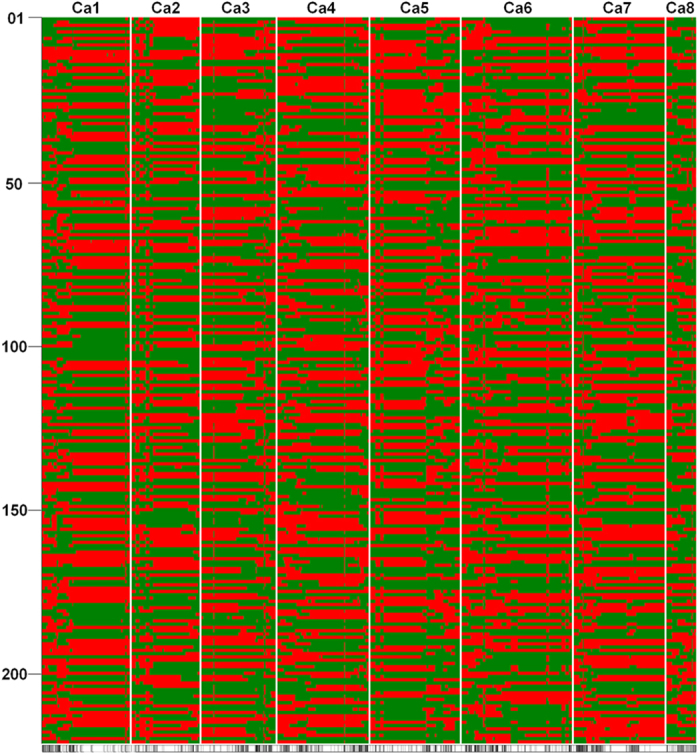
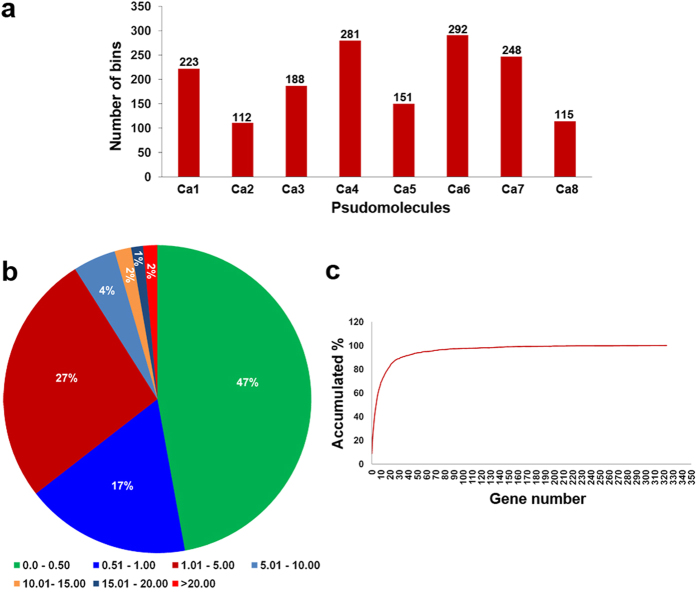
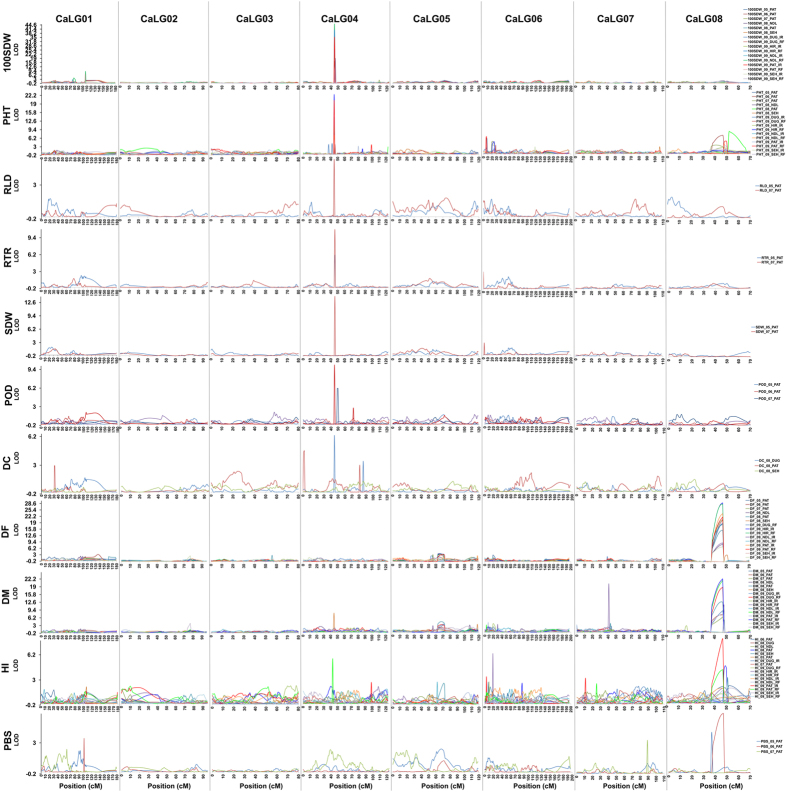
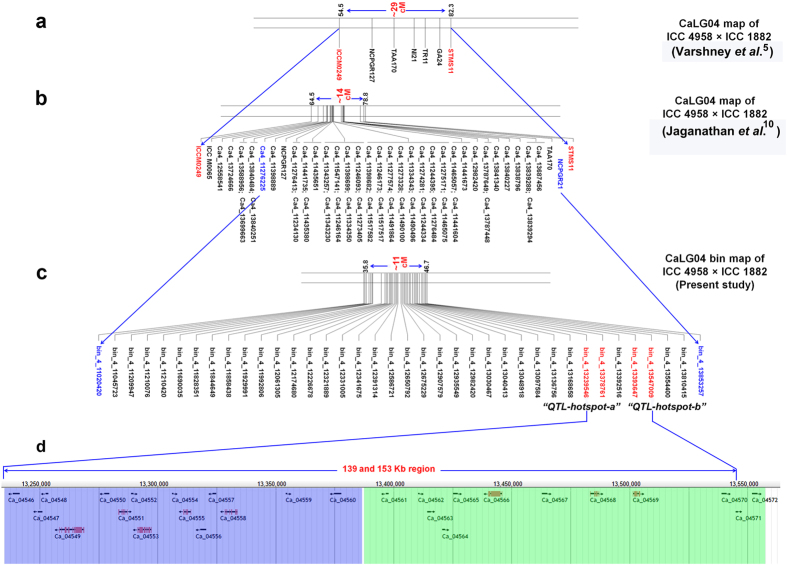
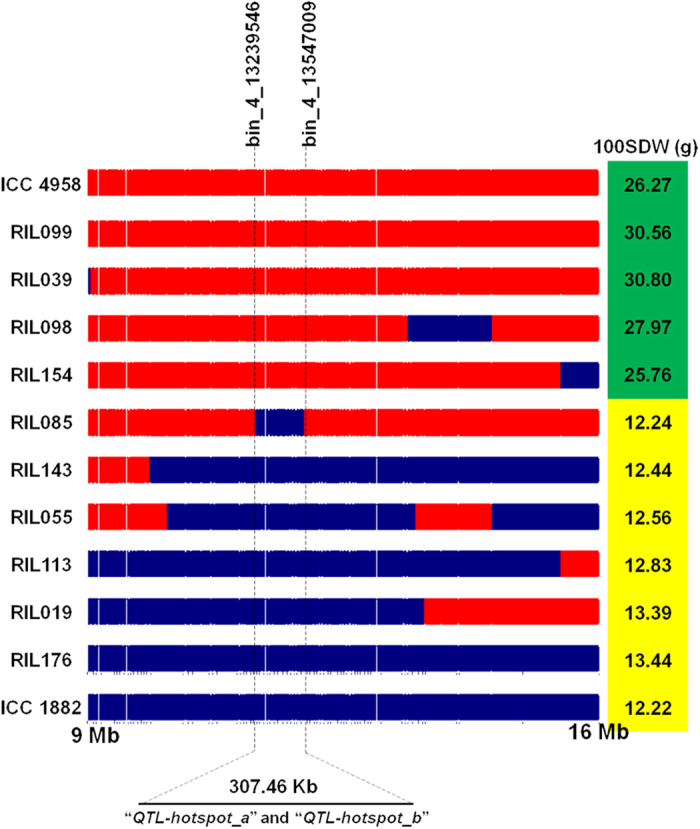
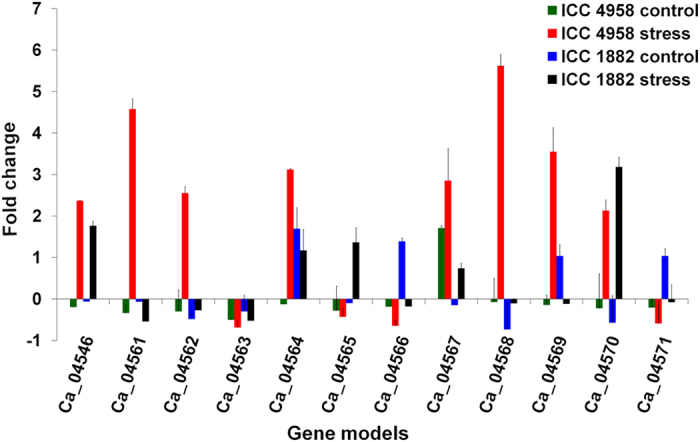
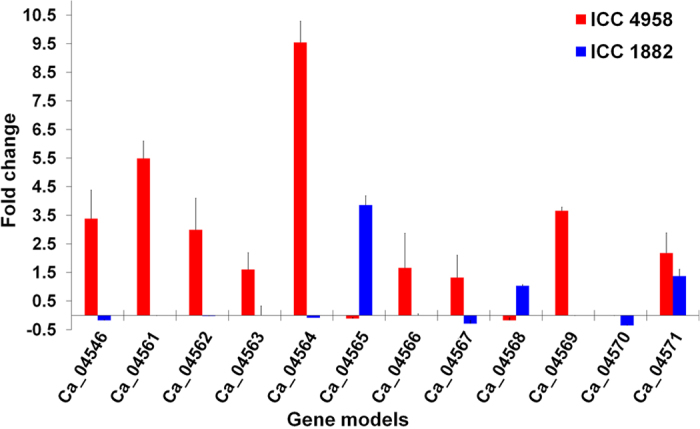
A combination of two approaches, namely QTL analysis and gene enrichment analysis were used to identify candidate genes in the "QTL-hotspot" region for drought tolerance present on the Ca4 pseudomolecule in chickpea. In the first approach, a high-density bin map was developed using 53,223 single nucleotide polymorphisms (SNPs) identified in the recombinant inbred line (RIL) population of ICC 4958 (drought tolerant) and ICC 1882 (drought sensitive) cross. QTL analysis using recombination bins as markers along with the phenotyping data for 17 drought tolerance related traits obtained over 1-5 seasons and 1-5 locations split the "QTL-hotspot" region into two subregions namely "QTL-hotspot_a" (15 genes) and "QTL-hotspot_b" (11 genes). In the second approach, gene enrichment analysis using significant marker trait associations based on SNPs from the Ca4 pseudomolecule with the above mentioned phenotyping data, and the candidate genes from the refined "QTL-hotspot" region showed enrichment for 23 genes. Twelve genes were found common in both approaches. Functional validation using quantitative real-time PCR (qRT-PCR) indicated four promising candidate genes having functional implications on the effect of "QTL-hotspot" for drought tolerance in chickpea.


Conflict of interest statement

The authors declare no competing financial interests.

Figures

Figure 1
Figure 1. Genome-wide distribution of SNPs and recombination bins in chickpea.
(a) Chickpea pseudomolecules, labelled as Ca1 to Ca8 and each pseudomolecule is shown in a different colour. The numbers on arches represent the scale for the size of pseudomolecules in Mb; (b) Distribution of 53,223 SNPs on eight chickpea pseudomolecules. Each SNP is represented as a single vertical line. The highest number of SNPs (18,989) were identified on Ca4 while the lowest number (954) of SNPs were identified on Ca5. Aggregation of vertical lines indicates SNP dense regions, while SNP sparse regions are depicted by blank spaces. Pseudomolecules Ca1, Ca3, Ca4 and Ca7 were found to contain SNP dense regions, whereas SNP sparse regions were observed on Ca2, Ca5, Ca6 and Ca8 pseudomolecules; (c) Distribution of 1,610 recombination bins on chickpea pseudomolecules. The number of recombination bins within 100 Kb intervals were calculated and plotted as a smooth line curve. The height of the line indicates the number of bins within the respective 100 Kb interval. A flat line corresponds to no or limited recombination regions; (d) Distribution of genes among recombination bins. The number of genes located within each recombination bin were identified by comparing the coordinates of the respective bin with chickpea gene models. The width of the column is proportional to the recombination bin interval while column height is proportional to the number of genes within that interval.
Figure 2
Figure 2. The recombination breakpoints identified in 222 recombinant inbred lines (RILs).
A parent dependent 15 bp sliding window approach was used to identify true recombination breakpoints. A total of 53,223 SNPs identified were scored as “A” and “B” representing alleles from the two parents ICC 4958 and ICC 1882 respectively, and for each individual, the ratio of A and B alleles within the window was calculated using a perl script. Windows with nine or more alleles from either parent were considered as homozygous for the respective region. The recombination break point was defined at the transition from one genotype to another. The chromosomes are labelled as Ca1 to Ca8 and are separated by vertical lines while each horizontal line represents a single RIL. Green and red bars represent segments from ICC 4958 and ICC 1882 genotypes, respectively. The number of bins per pseudomolecule ranged from 2.75 to 6.12 while an average of 35.71 bins were identified in an individual RIL. The black and white panel at the bottom indicates the consensus 1,610 bins identified in the entire RIL population.
Figure 3
Figure 3. Features of recombination bin mapping in chickpea.
(a) Distribution of the recombination bins on eight chickpea pseudomolecules. The number of recombination bins identified in each psudomolecule was depicted on top of each column. A minimum of 112 bins were identified on Ca2 while maximum 292 bins were identified on Ca6.; (b) Distribution of bin sizes identified in ICC 4958 × ICC 1882 population. Approximately, 50% of the bins were of ≤0.50 Mb size indicating majority of the recombination has been captured; (c) A plot of gene resolution. Number of genes in each recombination bin represented on the X-axis and the accumulated percentage of bins are on the Y-axis. In total, 8.68% (139) bins contained no gene, 14.29% (229) had only one gene, while 45.82% (734) had two to ten genes. Thus, 68.79% of bins had ≤10 genes.
Figure 4
Figure 4. Genome-wide distribution of major QTLs identified for 11 traits.
A total of 71 major QTLs identified for 11 traits (root length density (RLD, cm cm−3), root dry weight/total plant dry weight ratio (RTR, %), shoot dry weight (SDW, g), plant height (PHT, cm), primary branches (PBS), days to 50% flowering (DF), days to maturity (DM), pods/plant (POD), 100-seed weight (100SDW, g), harvest index (HI, %) and delta carbon ratio (DC)) have been shown. The linkage groups are separated by vertical lines, genetic distance is represented on the X-axis and LOD values are represented on Y-axis. Different coloured lines for each trait represent the phenotypic data collected over 1–5 seasons, 1–5 locations (Patancheru-PAT, Hiriyur-HIR, Nandyal-NDL, Durgapura-DUG and Sehore-SEH) and two environments (Rainfed-RF and Irrigated-IR). Major QTLs for 100SDW, PHT, RLD, RTR, SDW, POD and DC were identified on CaLG04; however, for traits like DF, DM, HI, and PBS major QTLs were identified on CaLG08.
Figure 5
Figure 5. Refinement of “QTL-hotspot” region into “QTL-hotspot_a” and “QTL-hotspot_b” and identification of candidate genes.
(a) The “QTL-hotspot” region, reported by Varshney and colleagues, spanning 29 cM (corresponds 7.74 Mb on physical map) harbouring QTLs for several drought tolerance related traits on CaLG04; (b) Refined “QTL-hotspot” region (~14 cM corresponding to ca. 3 Mb on physical map) reported by Jaganathan et al. consisted of 49 SNPs and six SSRs; (c) Refined “QTL-hotspot” region on CaLG04 with newly integrated markers (recombination bins) from the current study. The markers, viz. bin_4_13853257 and bin_4_11020420 correspond to the refined 3Mb “QTL-hotspot” region reported earlier. Integration of 1,421 SNPs to the “QTL-hotspot” region resulted in the identification of 38 recombination breakpoints and thereby split the “QTL-hotspot” region into “QTL-hotspot_a” (139.22 Kb; 0.23 cM) and “QTL-hotspot_b” (153.36 Kb; 0.22 cM). The “QTL-hotspot_a” was flanked by bin_4_13239546 and bin_4_13378761 while “QTL-hotspot_b” was flanked by bin_4_13393647 and bin_4_13547009. These four flanking markers were shown in the red colour font; (d) A ~300 Kb (13,239,546-13,547,009) snapshot of chickpea genome from JBrowse showing twenty six candidate genes identified in the “QTL-hotspot_a” and “QTL-hotspot_b” regions. A total of 15 genes (highlighted in blue colour area) were identified from “QTL-hotspot_a” while 11 candidate genes (highlighted in green colour area) were identified from “QTL-hotspot_b” region.
Figure 6
Figure 6. Fine mapping of “QTL-hotspot” for 100 seed weight (100SDW).
The recombination breakpoints in “QTL-hotspot” region spanning 7 Mb size (9–16 Mb on physical map) among 4 recombinant inbred lines (RIL099, RIL038, RIL098, and RIL154) with high 100SDW, 6 RILs (RIL085, RIL143, RIL055, RIL113, RIL019, and RIL176) with low 100SDW and parental genotypes (ICC 4958 shown in red colour bars-high 100SDW, ICC 1882 shown in blue colour bars-low 100SDW) are shown. No recombination was observed within ~300 Kb refined region (“QTL-hotspot_a” and “QTL-hotspot_b”) in the case of RIL085 and other low and high RILs. This clearly indicates that the refined “QTL-hotspot_a” and “QTL-hotspot_b” are the candidate regions for 100SDW in chickpea.
Figure 7
Figure 7. Gene expression analysis of 12 candidate genes identified using high density QTL mapping and gene enrichment analysis in control and stressed root tissues of ICC 4958 and ICC 1882 genotypes.
QTL and gene enrichment analyses have identified 12 common candidate genes (1 from “QTL-hotspot_a” and 11 from “QTL-hotspot_b”). To study the expression of these genes under drought stress, root tissues of ICC 4958 (drought tolerant) and ICC 1882 (drought sensitive) genotypes were collected when the transpiration ratio reached 0.10 along with the respective controls and used for qRT-PCR analysis along with endogenous gene. The expression of each gene relative to endogenous gene was determined using 2−∆∆Ct method while standard error was calculated based on expression values of three biological replicates. Among the 12 genes, 7 genes (Ca_04546, Ca_04561, Ca_04562, Ca_04564, Ca_04567, Ca_04568 and Ca_04569), were found to have a significantly higher expression in ICC 4958 than ICC 1882 under stress conditions. More specifically, Ca_04561, Ca_04562, Ca_04568 and Ca_04569 genes were found to be upregulated under stress condition in ICC 4958 while found to be down-regulated in ICC 1882 genotype as compared to respective control conditions.
Figure 8
Figure 8. Differential gene expression profiles of 12 candidate genes in mature seeds of ICC 4958 and ICC 1882 genotypes.
Expression of 12 genes in mature seeds of ICC 4958 (high 100SDW) and ICC 1882 (low 100SDW) was carried out to determine their role in controlling seed weight trait. All genes except Ca_04565, Ca_04568 and Ca_04570 were found to be significantly upregulated in ICC 4958 genotype compared to ICC 1882. Most of the upregulated genes showed no or negligible expression in ICC 1882 genotype. Genes such as Ca_04564, which encodes a ‘Leucine-rich repeat extensin-like protein’ showed about nine fold higher expression in ICC 4958 than ICC 1882.

Similar articles

Cited by

References

    1. Jukanti A. K., Gaur P. M., Gowda C. L. L. & Chibbar R. N. Nutritional quality and health benefits of chickpea (Cicer arietinum L.): a review. Brit. J. Nutr. 108, S11–S26 (2012). - PubMed
    1. Ahmad F., Gaur P. M. & Croser J. Chickpea (Cicer arietinum L.). In: Genetic Resources, Chromosome Engineering, and Crop Improvement—Grain Legumes (eds Singh R. J., Jauhar P. P.). CRC Press (2005).
    1. Hamwieh A., Imtiaz M. & Malhotra R. S. Multi-environment QTL analyses for drought-related traits in a recombinant inbred population of chickpea (Cicer arientinum L.). Theor. Appl. Genet. 126, 1025–1038 (2013). - PubMed
    1. Rehman A. U. et al. Mapping QTL associated with traits affecting grain yield in chickpea (Cicer arietinum L.) under terminal drought stress. Crop Sci. 51, 450–463 (2011).
    1. Varshney R. K. et al. Genetic dissection of drought tolerance in chickpea (Cicer arietinum L.). Theor. Appl. Genet. 127, 445–462 (2014). - PMC - PubMed

Publication types

MeSH terms

LinkOut - more resources