. 2015 Aug;4(4):457-62.
doi: 10.1002/open.201500056. Epub 2015 May 7.

A Practical One-Pot Synthesis of Positron Emission Tomography (PET) Tracers via Nickel-Mediated Radiofluorination

Affiliations

A Practical One-Pot Synthesis of Positron Emission Tomography (PET) Tracers via Nickel-Mediated Radiofluorination

Boris D Zlatopolskiy et al. ChemistryOpen. 2015 Aug.

Abstract

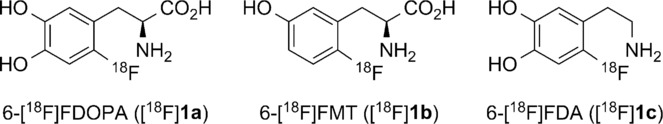
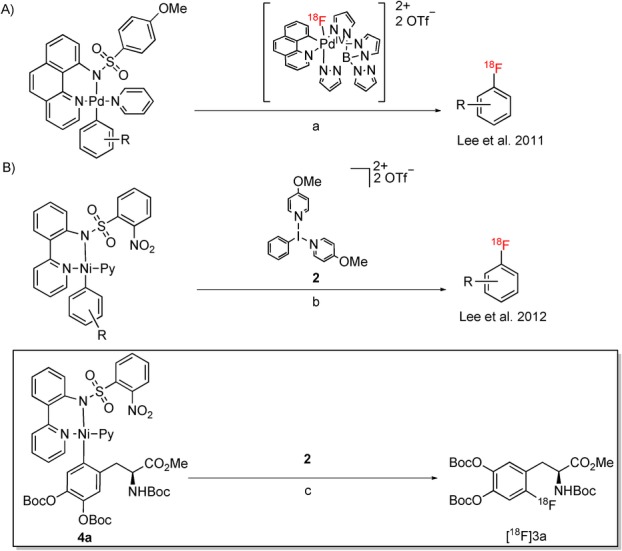
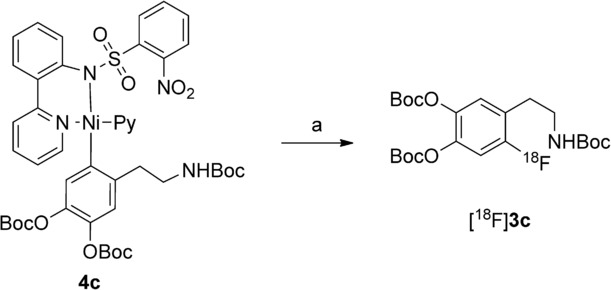
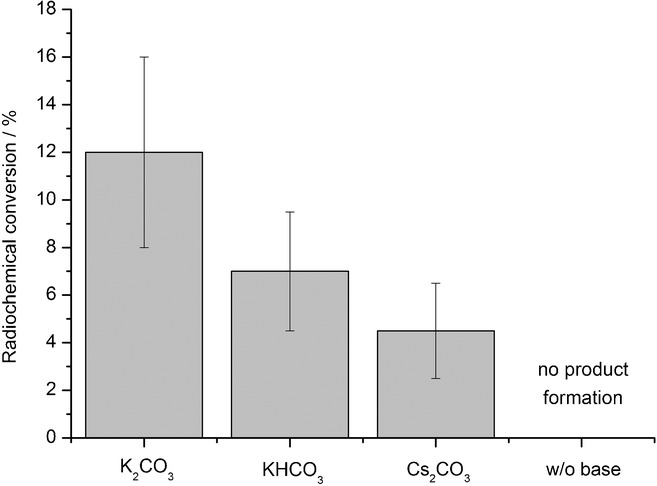
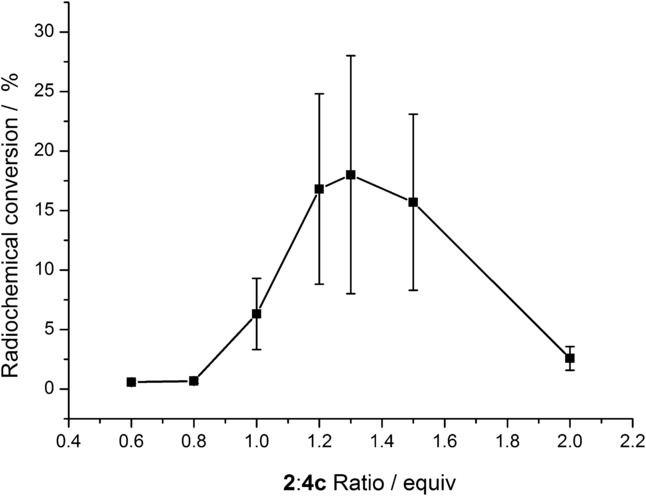
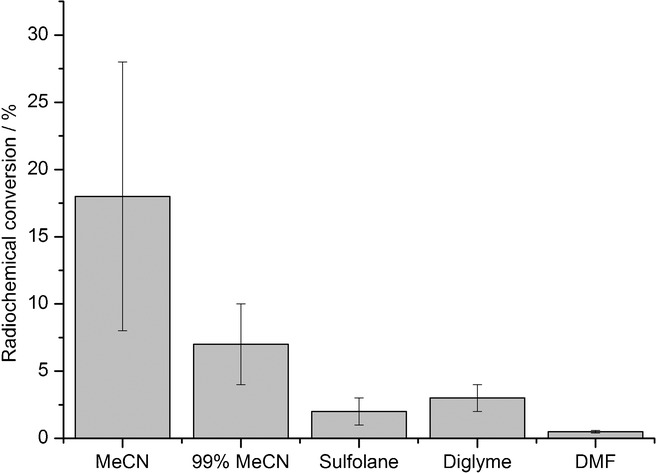
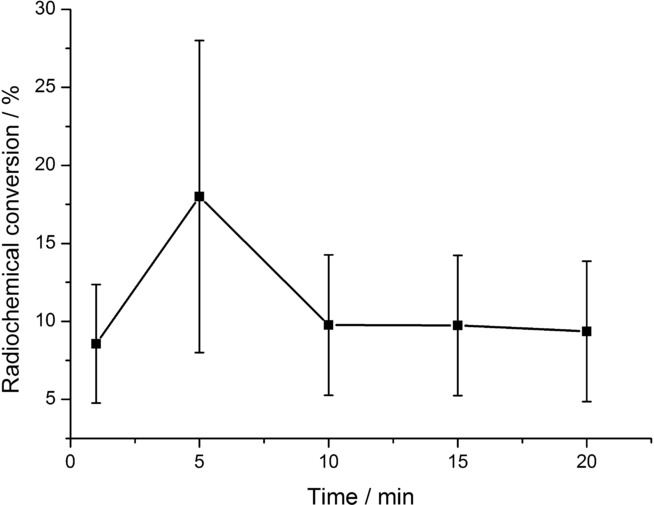
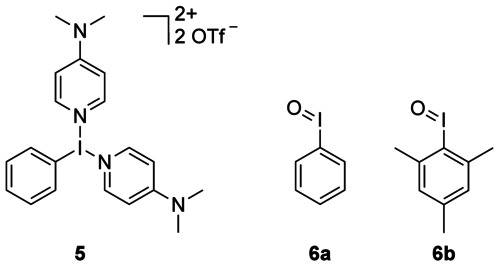
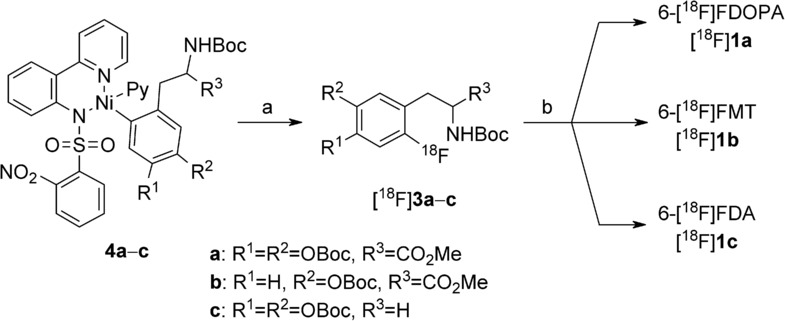
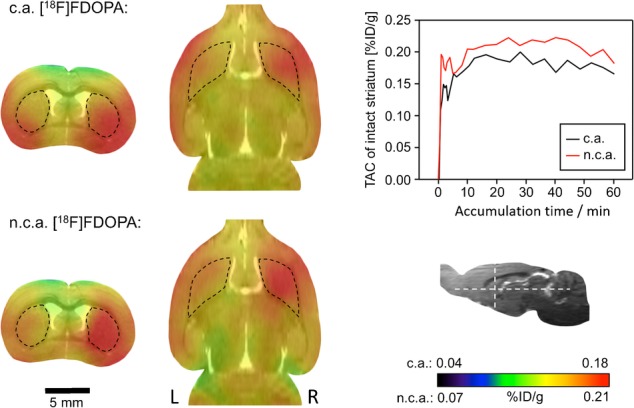
Recently a novel method for the preparation of (18)F-labeled arenes via oxidative [(18)F]fluorination of easily accessible and sufficiently stable nickel complexes with [(18)F]fluoride under exceptionally mild reaction conditions was published. The suitability of this procedure for the routine preparation of clinically relevant positron emission tomography (PET) tracers, 6-[(18)F]fluorodopamine (6-[(18)F]FDA), 6-[(18)F]fluoro-l-DOPA (6-[(18)F]FDOPA) and 6-[(18)F]fluoro-m-tyrosine (6-[(18)F]FMT), was evaluated. The originally published base-free method was inoperative. However, a "low base" protocol afforded protected radiolabeled intermediates in radiochemical conversions (RCCs) of 5-18 %. The subsequent deprotection step proceeded almost quantitatively (>95 %). The simple one-pot two-step procedure allowed the preparation of clinical doses of 6-[(18)F]FDA and 6-[(18)F]FDOPA within 50 min (12 and 7 % radiochemical yield, respectively). In an unilateral rat model of Parkinsons disease, 6-[(18)F]FDOPA with high specific activity (175 GBq μmol(-1)) prepared using the described nickel-mediated radiofluorination was compared to 6-[(18)F]FDOPA with low specific activity (30 MBq μmol(-1)) produced via conventional electrophilic radiofluorination. Unexpectedly both tracer variants displayed very similar in vivo properties with respect to signal-to-noise ratio and brain distribution, and consequently, the quality of the obtained PET images was almost identical.

Keywords: [18F]fluoride; nucleophilic aromatic substitution; positron emission tomography (PET); radiopharmaceuticals; radiosynthesis.


Figures

Figure 1
Figure 1
Structures of 6-[18F]FDOPA ([18F]1 a), 6-[18F]FMT ([18F]1 b), and 6-[18F]FDA ([18F]1 c).
Scheme 1
Scheme 1
Palladium- and nickel-mediated preparation of [18F]fluoroarenes according to Lee et al. (A and B, respectively). Reagents and conditions: a) acetone, 85 °C, 10 min; b) aq [18F]fluoride, 18-crown-6, MeCN, RT, <1 min; c) aq [18F]fluoride, 18-crown-6, MeCN, RT, <1 min, RCC=15±7 %; RCC=radiochemical conversion.
Scheme 2
Scheme 2
Radiosynthesis of protected [18F]FDA ([18F]3 c). Reagents and conditions: a) [18F]fluoride, base, 18-crown-6, oxidant 2, MeCN, RT, 1—20 min.
Figure 2
Figure 2
Influence of base on radiochemical conversion (RCC) of [18F]3 c. The appropriate [18F]fluoride salt/18-crown-6 complex (50–500 MBq) was prepared using the corresponding base (1.16 μmol) in MeOH (200 μL). MeOH was evaporated, and the residue taken up in MeCN (900 μL). The solution was added to nickel complex 4 c (5 μmol) and 2 (1 equiv), and the reaction mixture was stirred for 5 min at RT. Thereafter, water (5 mL) was added, the mixture was vigorously stirred for 1 min and then analyzed by radio-HPLC. Values represent the mean± standard deviation (SD) of at least three experiments.
Figure 3
Figure 3
Radiochemical conversion (RCC) of [18F]3 c as a function of the oxidant/precursor ratio. A solution of [18F]KF/18-crown-6 (50–500 MBq) in MeCN (900 μL) was added to nickel complex 4 c (5 μmol) and 2 (0.6–2.0 equiv), and the reaction mixture was stirred for 5 min at RT. Thereafter, water (5 mL) was added, the mixture was vigorously stirred for 1 min and then analyzed by radio-HPLC. Values represent the mean± standard deviation (SD) of at least three experiments.
Figure 4
Figure 4
Radiochemical conversion (RCC) of [18F]3 c in different solvents. A solution of [18F]KF/18-crown-6 (50–500 MBq) in the corresponding solvent (900 μL) was added to nickel complex 4 c (5 μmol) and 2 (6.5 μmol), and the reaction mixture stirred for 5 min at RT. Thereafter, water (5 mL) was added, the mixture was vigorously stirred for 1 min and then analyzed by radio-HPLC. Values represent the mean± standard deviation (SD) of at least three experiments.
Figure 5
Figure 5
Dependence of radiochemical conversion (RCC) of [18F]4 c on reaction time. A solution of [18F]KF/18-crown-6 (50–500 MBq) in MeCN (900 μL) was added to nickel complex 4 c (5 μmol) and 2 (1.3 equiv), and the mixture was stirred for the corresponding time at RT. Thereafter, water (5 mL) was added, the mixture was vigorously stirred for 1 min and then analyzed by radio-HPLC. Values represent the mean± standard deviation (SD) of at least three experiments.
Figure 6
Figure 6
Hypervalent iodine oxidants tested as possible alternatives to 2.
Scheme 3
Scheme 3
Preparation of 6-[18F]FDOPA ([18F]1 a), 6-[18F]FMT ([18F]1 b) and 6-[18F]FDOPA ([18F]1 c) via radiofluorination of nickel complexes 4 a–c. Reagents and conditions: a) [18F]KF/18-crown-6, oxidant 2, MeCN, RT, 5 min; b) 12 m aq HCl, 130 °C, 5–10 min. [18F]1 a, RCY=7 %, 220 MBq from 6.3 GBq 18F, SA=175 GBq μmol−1; [18F]1 b, RCY=5 %; [18F]1 c, RCY=12 %, 250 MBq from 4 GBq 18F, SA=60 GBq μmol−1; RCY=radiochemical yield; SA=specific activity.
Figure 7
Figure 7
No-carrier-added (n.c.a.) versus carrier-added (c.a.) 6-[18F]FDOPA: magnetic resonance/positron emission tomography (MR/PET) imaging in a rat model of Parkinsons disease. Two transverse (left column) and two horizontal images (middle column) from the same animal with left side lesion induced by the injection of 6-hydroxydopamine (6-OHDA) are shown. Left and right striatum are indicated by dashed black outlines. 6-OHDA-Induced lesion is visible as a reduction of the PET signal in the left striatum. Section levels are indicated by white dashed lines in the insert (bottom right). The time activity curves (TAC; top right) for both images were taken from the intact right striatum.

Similar articles

Cited by

References

    1. Juhasz C, Dwivedi S, Kamson DO, Michelhaugh SK, Mittal S. Mol. Imaging. 2014;13:1–16. - PMC - PubMed
    1. Varrone A, Halldin C. J. Nucl. Med. 2010;51:1331–1334. - PubMed
    1. Politis M. Nat. Rev. Neurol. 2014;10:708–722. - PubMed
    1. Berti V, Pupi A, Mosconi L. Ann. N. Y. Acad. Sci. 2011;1228:93–108. - PMC - PubMed
    1. Cropley VL, Fujita M, Innis RB, Nathan PJ. Biol. Psychiatry. 2006;59:898–907. - PubMed