Review
. 2015 Sep 22;2(5):ENEURO.0069-15.2015.
doi: 10.1523/ENEURO.0069-15.2015. eCollection 2015 Sep.

Organization of the Mammalian Locomotor CPG: Review of Computational Model and Circuit Architectures Based on Genetically Identified Spinal Interneurons(1,2,3)

Affiliations
Review

Organization of the Mammalian Locomotor CPG: Review of Computational Model and Circuit Architectures Based on Genetically Identified Spinal Interneurons(1,2,3)

Ilya A Rybak et al. eNeuro. .

Abstract

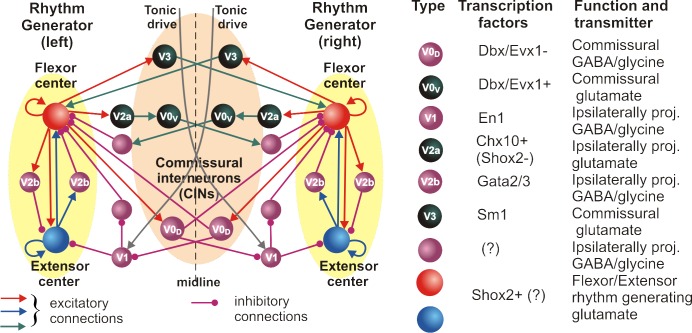
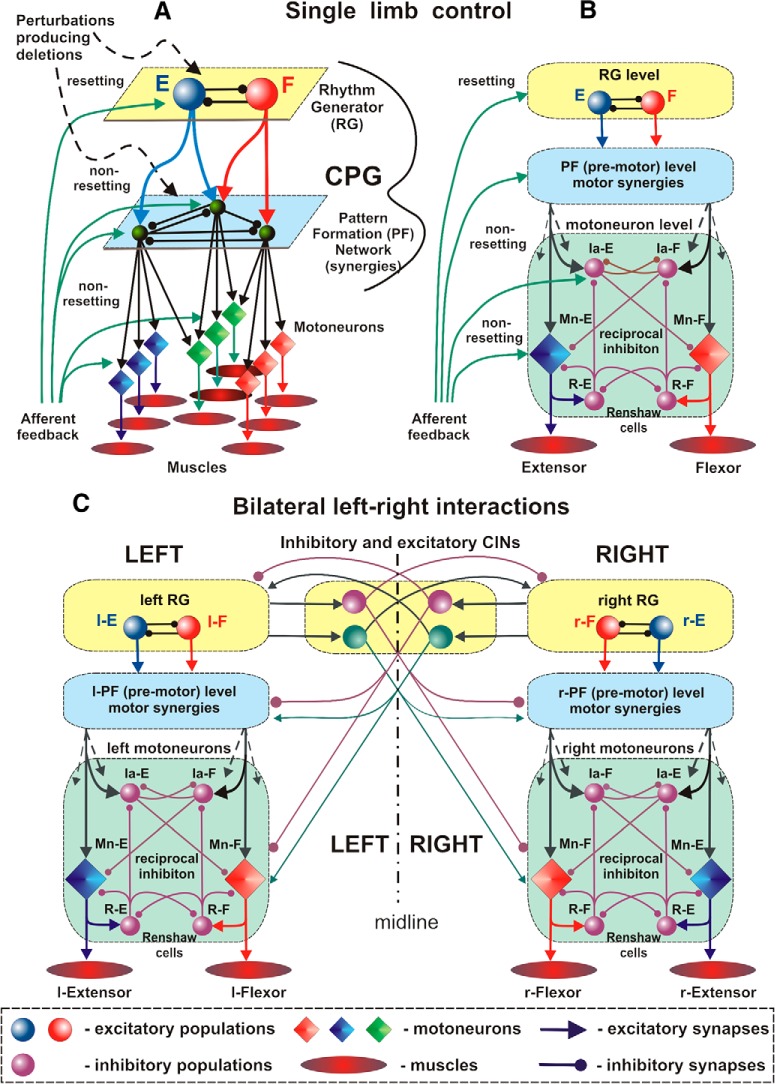
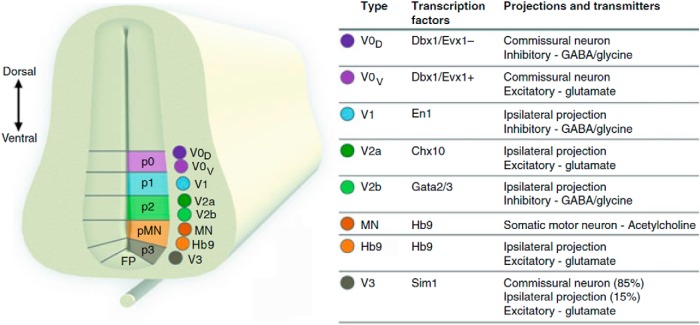
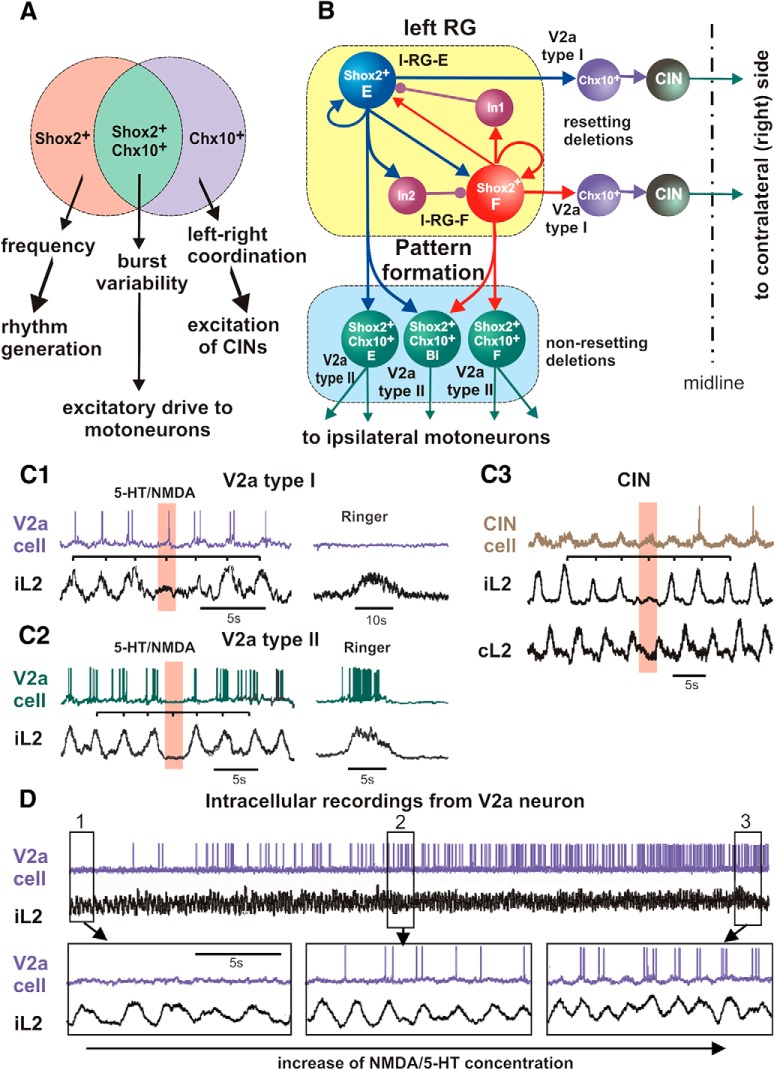
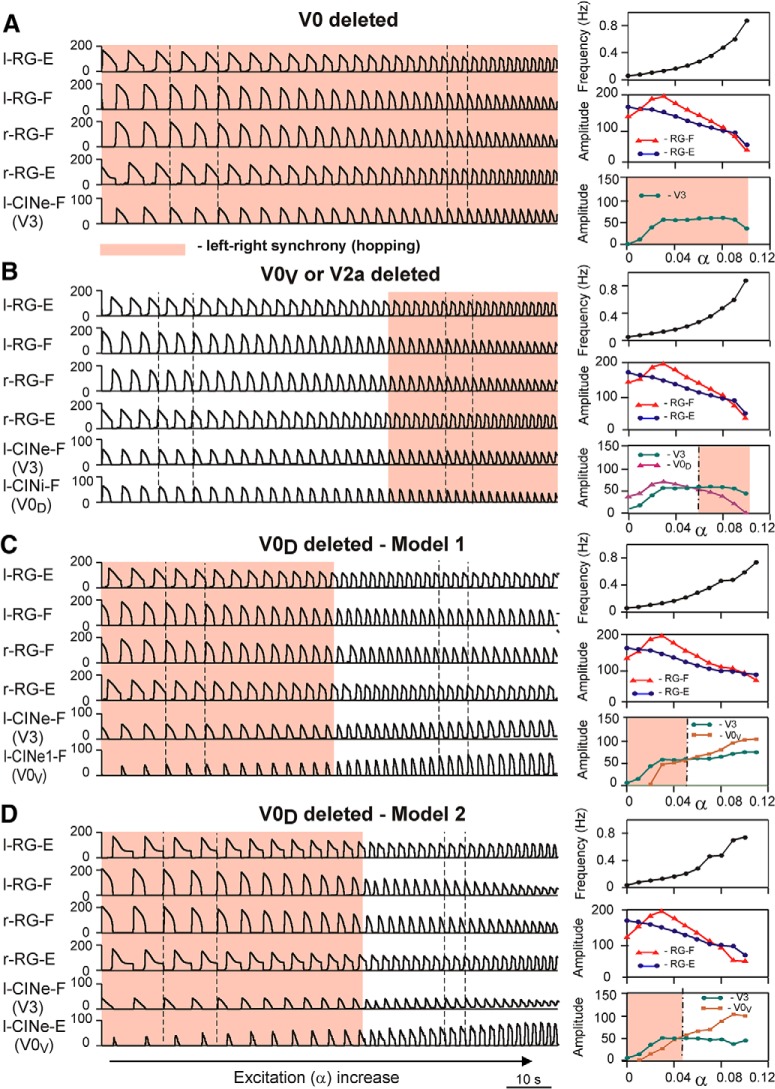
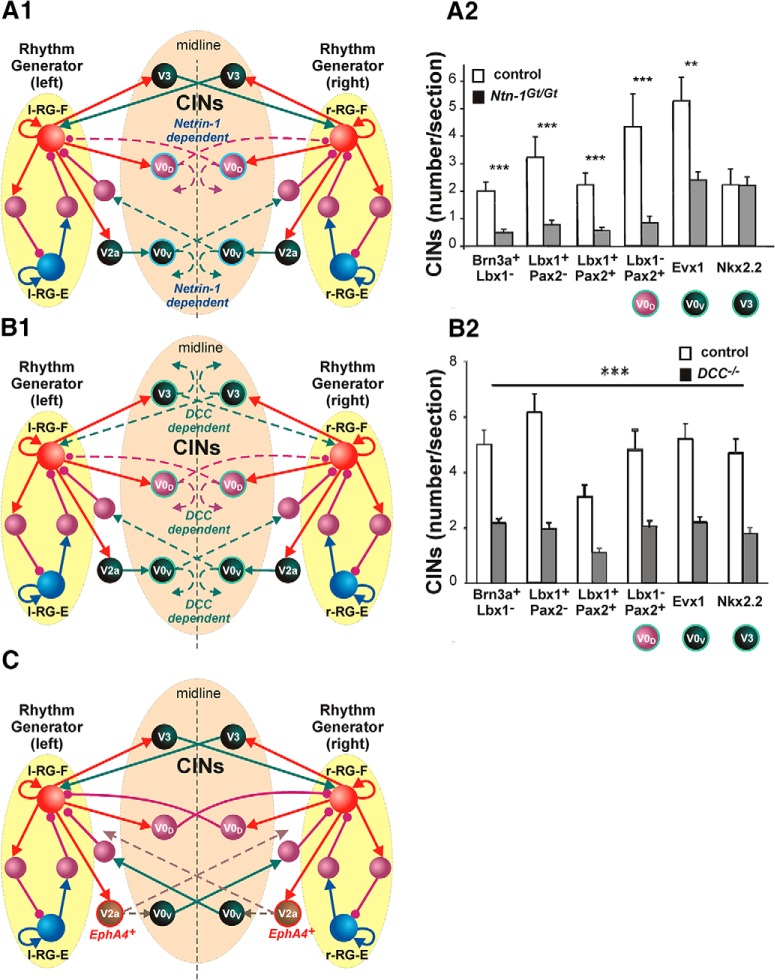
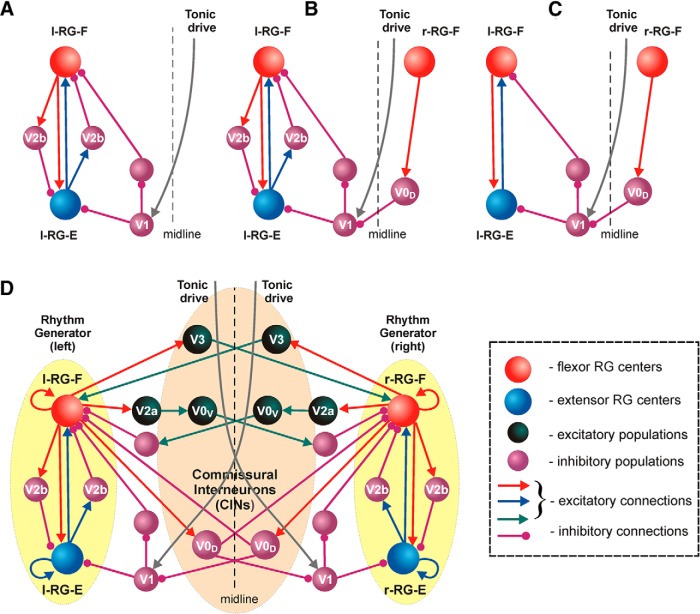
The organization of neural circuits that form the locomotor central pattern generator (CPG) and provide flexor-extensor and left-right coordination of neuronal activity remains largely unknown. However, significant progress has been made in the molecular/genetic identification of several types of spinal interneurons, including V0 (V0D and V0V subtypes), V1, V2a, V2b, V3, and Shox2, among others. The possible functional roles of these interneurons can be suggested from changes in the locomotor pattern generated in mutant mice lacking particular neuron types. Computational modeling of spinal circuits may complement these studies by bringing together data from different experimental studies and proposing the possible connectivity of these interneurons that may define rhythm generation, flexor-extensor interactions on each side of the cord, and commissural interactions between left and right circuits. This review focuses on the analysis of potential architectures of spinal circuits that can reproduce recent results and suggest common explanations for a series of experimental data on genetically identified spinal interneurons, including the consequences of their genetic ablation, and provides important insights into the organization of the spinal CPG and neural control of locomotion.

Keywords: central pattern generator; computational modeling; flexor–extensor coordination; genetically identified neurons; left–right coordination; locomotion; spinal cord.


Conflict of interest statement

The authors declare no competing financial interests.

Figures

None
Graphical abstract
Figure 1.
Figure 1.
Two-level model of locomotor CPG and left–right commissural interactions. A, A two-level functional organization is suggested to include bipartite half-center RG and PF circuits that mediate RG control of motoneuron activity and distribute RG inputs to functionally synergist motoneuron pools. Different perturbations and afferent stimuli affecting the system at the RG level may reset the rhythm (produce resetting deletions), whereas perturbations and afferent signals acting at the PF or motoneuron level cannot reset the rhythm and can only produce non-resetting deletions. B, Organization of interactions at the lower, motoneuron level, including flexor and extensor motoneurons (Mn), Ia interneurons, and Renshaw cells (R). C, Organization of bilateral left–right interactions in the spinal cord mediated by inhibitory and excitatory CINs. E, Extensor; F, flexor; l, left; r, right.
Figure 2.
Figure 2.
Molecular code determines the identity of ventral spinal neurons. Morphogens secreted from the floor plate and roof plate set up concentration gradients in the ventricular zone to specify progenitor domains p0–p3 and pMN, characterized by their differential expression of transcription factors. When the progenitor cells mature, they migrate laterally and are called V0–V3, Hb9, and motor neurons. The table on the right depicts the main transcription factors in the five cardinal classes of ventrally located neurons (V0–V3, Hb9) and motor neurons, the projection pattern, and the transmitter phenotype of these neurons. Dbx1, developing brain homeobox 1; Evx1, even-skipped homeobox; En1, engrailed 1; Chx10, Ceh-10 homeodomain-containing homolog; Gata2/3, GATA binding proteins 2 and 3; Sim 1, single-minded homolog 1; Hb9, homeobox 9; FP, floor plate. Reproduced from Kiehn and Dougherty (2013), their Figure 38.8, with permission.
Figure 3.
Figure 3.
Shox2+ neurons and two types of V2a (Chx10+) cells. A, The suggested different functional roles of Shox2+ (non-V2a), Shox2+ Chx10+ (V2a), and Shox2off Chx10+ (V2a) neurons. Reproduced from Dougherty et al. (2013), their Figure 8A, with permission. B, Different roles of V2a type I (Chx10+ Shox2off) and V2a type II (Chx10+ Shox2+) neurons. C1, V2a type I neuron continued to receive rhythmic excitatory synaptic inputs and fired rhythmic bursts during a non-resetting ipsilateral flexor deletion (iL2) occurring during NMDA/5-HT-induced fictive locomotion (current-clamp recording). Deletion is indicated by the pink bar. Recordings on the right show that this neuron did not receive any synaptic drive during a spontaneous nonlocomotor activity observed in the ipsilateral motor output (iL2). C2, V2a type II neuron was silent and lost synaptic drive during a non-resetting flexor (iL2) deletion. This neuron was excited and fired a prolonged burst of action potentials during a spontaneous nonlocomotor iL2 burst of activity (right). C3, Activity of a flexor-related CIN during a non-resetting flexor deletion. One can see rhythmic membrane potential oscillations in phase with the iL2 root activity, and the neuron continued to oscillate during flexor deletion. C1, C2, and C3 are reproduced from Zhong et al. (2012), their Figures 5D,E, 6C,D, and 4B, respectively, with permission. D, Intracellular recording from V2a neuron exhibiting an increased firing activity with increased drug (NMDA/5-HT) concentration. Insets 1, 2, and 3 show expanded recordings indicated in the top diagram. The iL2 trace represents smoothed and filtered ventral root activity. Reproduced from Zhong et al. (2011), their Figure 4ad, with permission.
Figure 4.
Figure 4.
Flexor–extensor asymmetry. A1, A2, Flexor and extensor deletions during NMDA/5-HT-induced fictive locomotion in the isolated rat spinal cord. Smoothed and rectified traces of motoneuron activity recorded from the left (lL2, lL5) and right (rL2, rL5) lumbar ventral roots. L2 recordings show predominantly flexor motoneuron activity, while L5 recordings show predominantly extensor activity. The bars above each set of traces show the expected timing of the bursts if the rhythm were unperturbed during the deletion. A1 shows an example of a non-resetting flexor deletion recorded from the lL2 root (indicated by the pink bar) accompanied by tonic activity in the ipsilateral extensor (lL5) root, but with no obvious effects on flexor or extensor activity on the opposite side of the cord. A2 shows non-resetting extensor deletions (marked by blue bars) and a flexor deletion (marked by pink bar). During extensor deletions in lL5, the ipsilateral flexor activity (lL2) and contralateral activities were not perturbed, while the flexor deletion in rL2 was accompanied by tonic activity in the rL5 ventral root. Reproduced from Zhong et al. (2012), their Figure 1Aa,Ba, with permission. B, Changes in flexor and extensor phase durations during NMDA/5-HT-induced fictive locomotion in the isolated mouse spinal cord as a function of locomotor frequency. Red filled squares and blue filled circles show average flexor and extensor phase durations, respectively. Reproduced from Shevtsova et al. (2015), their Figure 9C, with permission.
Figure 5.
Figure 5.
Modeling of an isolated rhythm-generating population. A, Raster plot of the activity of 50 neurons from the 200-neuron population. Each horizontal line represents a neuron, and each dot represents a spike. B, Integrated population activity represented by the average histogram of population activity [spikes/(neuron × s), bin = 100 ms]. In A and B, the average leakage reversal potential (ĒL) defining the average level of neuronal excitation was linearly increased from −70 to −58 mV for 400 s. Voltage regions of silence, bursting, and tonic activity are denoted at the bottom. Bursting emerges at lower values of ĒL in a limited number of neurons. With increasing ĒL, more neurons become involved and the population bursting becomes strongly synchronized. A further increase of ĒL leads to a transition to tonic activity. C and D, respectively, show the frequency of and amplitude of population activity as functions of ĒL. E and F, respectively, show the frequency and amplitude of NMDA/5-HT-evoked locomotor activity in the isolated mouse spinal cord recorded in vitro from the flexor ventral root as a function of NMDA (red circles) or d-glutamate (black squares) concentration (the amplitude was normalized with respect to the maximal amplitude). Graphs display the mean ± SD (n = 20 each). G shows changes of ĒL for flexor (ĒLF, red line) and extensor (ĒLE, blue line) RG centers during increasing neuronal excitation with an increase in drug concentration [defined by parameter α, (ĒLi = ĒLiO · (1 − α))] across areas for silence (white), bursting (blue), and tonic (yellow) population activity. This figure is reproduced from Shevtsova et al. (2015), their Figure 2, with permission.
Figure 6.
Figure 6.
The proposed organization of the excitatory and inhibitory commissural pathways involved in left–right coordination of activity in the spinal cord. The RG centers and other neural populations are shown by spheres. Excitatory and inhibitory synaptic connections are represented by arrows and circles, respectively. A, Organization of the excitatory (mediated by the V3 CINs) and inhibitory (mediated by the V0D CINs) pathways. B, C, Two possible organizations of commissural pathways mediated by V2a interneurons and V0V CINs.
Figure 7.
Figure 7.
Modeling the coordination of left and right rhythm generators in the spinal cord via several parallel CIN pathways. A and B show schematics of Model 1 and Model 2, respectively. Neural populations are shown by spheres. Each RG population (representing the flexor or extensor centers) contained 200 neurons; all other populations consisted of 50 neurons each. All neurons were modeled in the Hodgkin–Huxley style. Excitatory and inhibitory synaptic connections are represented by arrows and circles, respectively. Prefix l- or r- in population name indicates left or right. The RG on each side of the cord includes flexor and extensor RG centers (RG-F and RG-E, respectively) interacting via the inhibitory Inrg-F and Inrg-E populations. Suffix F- or E- in population name indicates that the population is coactive with the flexor or extensor RG center, respectively. The left and right rhythm generators interact via CINs: CINe-F (V3), CINi-F (V0D), and CINe1-F (V0V) in Model 1 (A); and CINe-F (V3), CINi-F (V0D), and CINe-E (V0V) in Model 2 (B). The full mathematical description of the model can be found in the study by Shevtsova et al. 2015. Reproduced from Shevtsova et al. (2015), their Figure 1, with permission. C1 and D1 show the performances of Model 1 and Model 2, respectively, in response to a slow ramp increase of neuronal excitation. The activity of all four RG centers (left and right RG-F and RG-E populations) and left CIN populations are shown as average histograms of population activity [spikes/(neuron × s), bin = 100 ms] in response to a slow ramp increase of neuronal excitation α (α increased for 100 s). Note the maintenance of left–right and flexor–extensor alternation and acceleration of rhythmic activity in both models. The vertical dashed lines indicate the beginning of the left flexor phases at lower (the left lines) and higher (the right lines) values of α. Reproduced from Shevtsova et al. (2015), their Figure 4, with permission. C2 and D2 show changes of the key model characteristics in Model 1 and Model 2, respectively, in response to a slow ramp increase of neuronal excitation. In both panels, the top diagram shows changes in the frequency of oscillation; the middle diagram represents changes in the amplitude of the activity of l-RG-F (red) and l-RG-E (blue) centers; and the bottom diagram shows changes in the amplitude of activity of V3 (green), V0D (purple), and V0V (brown) CIN populations. Reproduced from Shevtsova et al. (2015), their Figure 5, with permission.
Figure 8.
Figure 8.
Frequency-dependent changes in left–right coordination of activity following selective removal of particular CIN pathways. A, Performance of both models after removal of both V0 (V0V and V0D) CIN populations. B, Performance of both models after selective removal of V0V CIN or V2a populations. C, D, Performance of Model 1 and Model 2, respectively, after selective removal of V0D CIN populations. The left column in each panel shows the activity of all centers and the remaining (left) CIN populations. In all panels, α was increased for 200 s. The vertical dashed lines indicate the beginning of the left flexor phases at lower and higher values of α (and oscillation frequency). The right column in each panel shows changes of the key model characteristics in response to a slow ramp increase of neuronal excitation: the top diagram shows changes in the frequency of oscillation; the middle diagram represents changes in the amplitude of activity of l-RG-F (red) and l-RG-E (blue) centers; and the bottom diagram shows changes in the amplitude of activity of V3 (green), V0D (purple), and V0V (brown) CIN populations. The dash-dotted vertical lines in right panels indicate transitions between left–right alternation and left–right synchronization. The regions of left–right synchronized activity are highlighted by pink rectangles. Modified from Shevtsova et al. (2015), their Figures 7 and 8, with permission.
Figure 9.
Figure 9.
Potential changes in left–right coordination in models of mutants lacking particular axon-guiding molecules Netrin-1, DCC, or EphA4. A1, Model of circuits in Netrin-1 KO mice. The majority of axons of V0D and V0V CINs do not cross the midline (dashed lines), hence reducing mutual inhibition between left and right RGs. A2, Quantification of transcription factor phenotype in different traced CINs that shows significant differences in affected V0D and V0V CIN (but not V3) populations in Netrin-1 KO mice. Modified from Rabe et al. (2009), their Figure 5L, with permission. B1, Model of circuits in DCC KO mice: significant portions of axons of V0D and V0V, and V3 CINs do not cross the midline (dashed lines), hence reducing both mutual inhibition and mutual excitation between left and right RGs. B2, Quantification of transcription factor phenotype in different traced CINs that shows significant differences in affected V0D, V0V, and V3 CIN populations in DCC KO mice. Modified from Rabe Bernhardt et al. (2012), their Figure 4I, with permission. C, Model of circuits in EphA4 KO mice: many axons of EphA4+ V2a populations do not activate V0V CINs, hence reducing mutual inhibition between left and right RGs. In A1, B1, and C, both the right connections with reduced numbers of axons and the redirected axons in the corresponding mutant circuits are shown by dashed lines.
Figure 10.
Figure 10.
Role of V1 and V2b interneurons in flexor–extensor alternation. A, B, V2b neurons mediate mutual inhibition between flexor and extensor half-centers on each side of the cord. V1 neurons (involved in interactions between rhythm-generating centers) receive excitation from the contralateral side of the cord. This excitatory input should include tonic excitatory drive. These V1 neurons provide an additional inhibition of the ipsilateral extensor center and may disinhibit the ipsilateral flexor half-center. B, The activity of the above V1 cells is negatively modulated (reduced) in phase with the contralateral flexor activity via inhibition from the contralateral V0D CINs. C, The above modulation of V1 neuron activity allows them to secure flexor–extensor alternation after removing V2b neurons in the intact cord. D, The full schematic of bilaterally interacting rhythm generators in the spinal card with incorporated V1 and V2b circuits.

Similar articles

Cited by

References

    1. Akay T, Acharya HJ, Fouad K, Pearson KG (2006) Behavioral and electromyographic characterization of mice lacking EphA4 receptors. J Neurophysiol 96:642–651. 10.1152/jn.00174.2006 - DOI - PubMed
    1. Al-Mosawie A, Wilson JM, Brownstone RM (2007) Heterogeneity of V2-derived interneurons in the adult mouse spinal cord. Eur J Neurosci 26:3003–3015. 10.1111/j.1460-9568.2007.05907.x - DOI - PubMed
    1. Bannatyne BA, Edgley SA, Hammar I, Jankowska E, Maxwell DJ (2003) Networks of inhibitory and excitatory commissural interneurons mediating crossed reticulospinal actions. Eur J Neurosci 18:2273–2284. - PMC - PubMed
    1. Borgius L, Nishimaru, H, Caldeira V, Kunugise Y, Löw P, Reig R, Itohara S, Iwasato T, Kiehn O (2014) Spinal glutamatergic neurons defined by EphA4 signaling are essential components of normal locomotor circuits. J Neurosci 34:3841-3853. 10.1523/JNEUROSCI.4992-13.2014 - DOI - PMC - PubMed
    1. Brocard F, Tazerart S, Vinay L (2010) Do pacemakers drive the central pattern generator for locomotion in mammals? Neuroscientist 16:139–155. 10.1177/1073858409346339 - DOI - PubMed

LinkOut - more resources