. 2015 Oct 15;2(5):ENEURO.0014-15.2015.
doi: 10.1523/ENEURO.0014-15.2015. eCollection 2015 Sep.

The Good and Bad Differentially Encoded within the Subthalamic Nucleus in Rats(1,2,3)

Affiliations

The Good and Bad Differentially Encoded within the Subthalamic Nucleus in Rats(1,2,3)

Emmanuel Breysse et al. eNeuro. .

Abstract

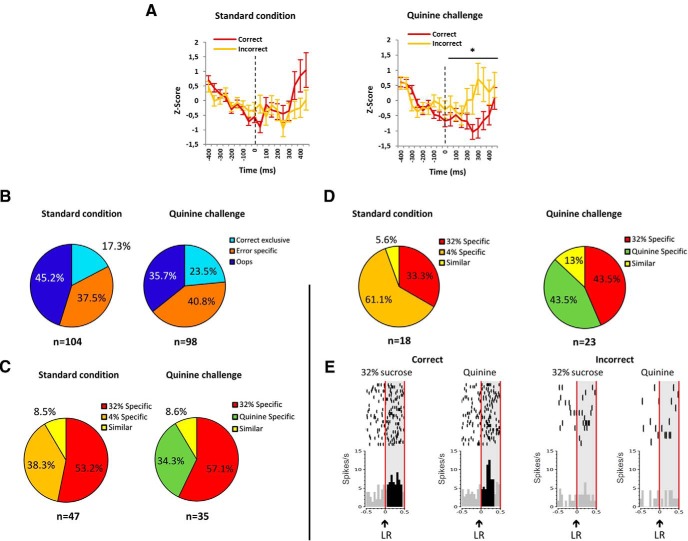
The subthalamic nucleus (STN) has only recently been added into the reward circuit. It has been shown to encode information regarding rewards (4% sucrose, 32% cocaine). To investigate the encoding of negative value, STN neurons were recorded in rats performing a task using discriminative stimuli predicting various rewards and especially during the replacement of a positive reinforcer (4% sucrose) by an aversive reinforcer (quinine). The results show that STN neurons encode information relative to both positive and aversive reinforcers via specialized subpopulations. The specialization is reset when the context is modified (change from a favorable context (4% vs 32% sucrose) to an unfavorable context (quinine vs 32% sucrose). An excitatory response to the cue light predicting the reward seems to be associated with the preferred situation, suggesting that STN plays a role in encoding the relative value of rewards. STN also seems to play a critical role in the encoding of execution error. Indeed, various subpopulations of neurons responding exclusively at early (i.e., "oops neurons") or at correct lever release were identified. The oops neurons respond mostly when the preferred reward (32% sucrose) is missed. Furthermore, STN neurons respond to reward omission, suggesting a role in reward prediction error. These properties of STN neurons strengthen its position in the reward circuit as a key cerebral structure through which reward-related processes are mediated. It is particularly important given the fact that STN is the target of surgical treatment for Parkinson's disease and obsessive compulsive disorders, and has been suggested for the treatment of addiction as well.

Keywords: basal ganglia; in vivo electrophysiology; motivation; quinine; reward; sucrose.


Conflict of interest statement

The authors declare no competing financial interests.

Figures

Figure 1.
Figure 1.
Behavioral task. A, This diagram illustrates the time elapsing during one trial (black arrow). The rats had to press the lever down for 1 s. During this 1 s period, after 400 ms had elapsed, one cue light was switched ON (either left or right) for 100 ms, providing information regarding the future reward (Left light, 4% sucrose or quinine; Right light, 32% sucrose). The rats had to maintain their paw on the lever until the end of the 1 s period (i.e., an extra 500 ms) that was signaled by a tone. The rewards were then delivered after the rats had withdrawn the lever. Reaction Time is the time between the trigger tone and the lever release; Movement Time is the time between the lever release and the detection of the nose of the rat in the magazine; and the time spent in the magazine after reward delivery (i.e., from detection of the nose of the rat until withdrawal) was measured as the consumption time. B, Operant box in which animals were trained and recorded. The box is equipped with two lights, one lever, one buzzer, and one magazine with two cups.
Figure 2.
Figure 2.
Histological, neuronal, and waveform characterization. A, Estimation of the placement of the 14 electrodes inside the STN. Sessions associated with the red track (inside the STN) were kept in the analysis, while those associated with the orange track (outside of the STN) were discarded. AP = −3.24 to −4.08: anteroposterior levels taken from the atlas of Paxinos and Watson (2005). Scale bar, 1 mm. B, Cresyl violet staining showing an electrode track inside the STN (delimited by the black dashed line). Scale bar, 500 µm. C, Distribution of the 382 STN neurons according to their mean firing rate (Hz). D, Example of different waveforms of some representative neurons recorded in the STN showing one spike (left), biphasic waveforms (middle), and triphasic waveforms (right).
Figure 3.
Figure 3.
Behavioral results. A, Taste reactivity measure. Positive responses (tongue protrusions) induced by various concentrations of sucrose [left; 32% sucrose (red), 10% sucrose (dark orange), 4% sucrose (orange)] and negative responses (gapes) induced by two different concentrations of quinine (right; green). *Significant concentration effect (p < 0.05). B, Mean Reaction Time (time to release the lever after the tone onset in milliseconds ±SEM) for 32% sucrose (red bars), 4% sucrose (orange bars), and quinine (green bars) in the standard condition and during the quinine challenge. #Significant challenge effect (p < 0.05). C, Mean Movement Time (time to reach the magazine after the lever release in milliseconds ±SEM) for 32% sucrose (red bars), 4% sucrose (orange bars), and quinine (green bars) in both standard and quinine challenge conditions. *Significant reward effect; #Significant challenge effect (p < 0.05). D, Mean Consumption Time (CT) (time spent in the magazine after reward delivery in milliseconds ±SEM) for 32% sucrose (red bars), 4% sucrose (orange bars), and quinine (green bars) in both standard and quinine challenge conditions. #Significant challenge effect (p < 0.05); ***significant reward effect (p < 0.001); §§§significantly different from 32% sucrose (p < 0.001); €€€significantly different from 4% sucrose (p < 0.001). E, Mean number of errors (premature lever release) after the cue light onset for 32% sucrose (red bars), 4% sucrose (orange bars), and quinine (green bars) in both standard and quinine challenge conditions. #Significant challenge effect (p < 0.05). F, Mean CT (in milliseconds ±SEM) during challenge 2 for 32% sucrose (red bars), 4% sucrose (orange bars), when the reward was delivered (rewarded trials) vs when for 20% of the successful trials the reward was omitted (unrewarded trials). *Significant reward effect (p < 0.05); #significant challenge effect (p < 0.05).
Figure 4.
Figure 4.
Responses of the STN neurons to the predictive cue lights (CLs). A, B, Proportions of the neuronal populations [32% sucrose specific (red), 4% sucrose specific (orange; A), quinine specific (green; B) and similar (yellow)] responding in the standard condition (A, n = 229 of 382) and during the quinine challenge (B, n = 235 of 382). C, Example of the firing pattern of one STN neuron classified as 32% specific, showing increased activity to the CL predicting 32% sucrose (left) and no significant response to the CL predicting 4% sucrose (right). D, Example of the firing pattern of another STN neuron classified as quinine specific showing increased activity to both the CL predicting 32% sucrose (left) and quinine (right), but with a higher increased activity to the CL predicting quinine. Rasters are centered on the occurrence of the CL (time = 0) that lasted 100 ms (two bins of 50 ms). The CL is indicated with a black arrow, and the light gray area delimited by the vertical red lines represents the period on which the bins were analyzed [0:500 ms]. The black bins represent the bins significantly different from the baseline ([−400:0 ms]). Top, Raster plot of spike firing on each trial (each row illustrates one trial), with the top row of dots corresponding to the first trial. Bottom, Mean firing rate across all trials, with a bin size of 50 ms. E, F, Average post-stimulus time histograms of the firing rate (expressed as z-score) aligned with the cue light (0 ms) in standard condition (E) and quinine challenge (F) constructed with 50 ms bins for 32% (red) and 4% sucrose or quinine (orange). The lines represent the average PSTHs (mean ± SEM) of the whole population that respond to the CL. *Significant reward effect (p < 0.05). Suc, Sucrose.
Figure 5.
Figure 5.
Excitation and inhibition at the cue light presentation and lever release. A, Average z-scores (mean ± SEM) of the firing activity for STN neurons responding by an activation (red line) or an inhibition (blue line) to the cue light (time = 0 ms) in standard condition (left) and quinine challenge (right). B, Average z-scores (mean ± SEM) of the firing activity for STN neurons responding by an activation (red line) or an inhibition (blue line) at the lever release (time = 0 ms) in correct trials (left) and incorrect trials (right). The black dotted lines represent the average activity of both activated and inhibited neuronal populations responding to the events. The percentages represent the mean variation of activity after each event for activated (red) and inhibited (blue) neuronal population. The z-scores are represented for the period on which the time bins were analyzed (−400:450 ms).
Figure 6.
Figure 6.
Evolution of the neuronal selectivity at the cue light (CL) according to the context (during challenge 1, when quinine replaces 4% sucrose). A, Proportions of the 288 neurons responsive to the CL, showing a stable selectivity (red) or a change of selectivity (variable; blue) during challenge 1. Stable neurons (red) are neurons keeping the same selectivity after the quinine introduction (a 32% sucrose-specific neuron remaining 32% specific when quinine has replaced the 4% sucrose), while variable neurons (blue) are neurons changing their selectivity after the quinine introduction. B, Example of the evolution of the firing pattern of an STN neuron classified as a 32% sucrose-specific neuron in the standard condition, showing increased activity in response to the cue light predicting the 32% sucrose (left) and no change of activity to the CL predicting 4% sucrose (right), which stopped to respond during the quinine challenge to both cue lights. Rasters are centered on the occurrence of the CL (time = 0) that lasted 100 ms (two bins of 50 ms). The CL is indicated with a black arrow, and the light gray area delimited by the vertical red lines represents the period on which the bins were analysed [0:500 ms]. The black bins represent the bins significantly different than the baseline (−400:0 ms). Top, Raster plot of spike firing on each trial (each row illustrates one trial), with the top row of dots corresponding to the first trial. Bottom, Mean firing rate across all trials; bin size is 50 ms.
Figure 7.
Figure 7.
Proportions of neurons responsive to correct vs incorrect premature lever release. A, Average post-stimulus time histograms (PSTHs) of the firing rate (expressed as z-score) aligned with the cue light (0 ms, black dotted line), in standard condition (left) and quinine challenge (right) constructed with 50 ms bins preceding trials with future correct (red line) and incorrect (orange line) lever release. The lines represent the PSTHs (mean ± SEM) that respond to the cue light. *Significant reward effect (p < 0.05). B, Proportions of neurons responding exclusively at lever release for correct trials (“correct exclusive neurons”; turquoise area), at lever release in both correct and incorrect trials but in a different manner (“error-specific neurons”; orange area), and responding exclusively at lever release for incorrect trials (oops neurons; dark blue area) in standard condition (left) and quinine challenge (right). C, Selectivity to reward in oops neurons expressed as proportions in both standard condition (left) and quinine challenge (right) of 32% sucrose-specific neurons (red), 4% sucrose-specific neurons (orange), similar neurons (yellow), and quinine-specific neurons (green). D, Selectivity to reward in exclusive correct neurons expressed as proportion in both standard condition (left) and quinine challenge (right) of 32% sucrose-specific neurons (red), 4% sucrose-specific neurons (orange), similar neurons (yellow), and quinine-specific neurons (green). E, Example of the firing pattern of one STN neuron classified correct exclusive neuron showing increased activity at correct lever release only (left), in a similar manner for both 32% sucrose and quinine, but showing no response at lever release for incorrect trials (right), whatever the reward missed. Rasters are centered on the occurrence of the lever release (LR) (time = 0). The LR is indicated with a black arrow, and the light gray area delimited by the vertical red lines represents the period on which the bins were analyzed [0:500 ms]. The black bins represent the bins that were significantly different from the baseline [−400:0 ms]. Top, Raster plot of spike firing on each trial (each row illustrates one trial), with the top row of dots corresponding to the first trial. Bottom, Mean firing rate across all trials; bin size is 50 ms.
Figure 8.
Figure 8.
Responses of the STN neurons at the magazine entry during challenge 2, when the rewards were omitted in 20% of cases. A, Proportions of the different neuronal categories responding at magazine entry for the unrewarded trials [32% sucrose specific (red), 4% sucrose-specific (orange), and “similar” (yellow)]. B, Example of the firing pattern of one STN neuron classified as 32% sucrose specific at the cue light (CL; left), and its response to 32% sucrose delivery at the magazine entry (ME; middle) and at the ME when 32% sucrose was omitted (right). Rasters are centered on the occurrence of the CL (time = 0) that lasted 100 ms (2 bins of 50 ms; left) and the ME (time = 0; middle and right). The CL and the ME are indicated with a black arrow, and the light gray area delimited by the vertical red lines represents the period on which the bins were analyzed (0:500 ms). The black bins represent the bins significantly different of the baseline [−400:0 ms]. Top, Raster plot of spike firing on each trial (each row illustrates one trial), with the top row of dots corresponding to the first trial. Bottom, Mean firing rate across all trials; bin size is 50 ms. C, Proportions of activated (bright green area), inhibited (violet area), and mixed (activation and inhibition; white area) neurons responding to magazine entry for the unrewarded trials.

References

    1. Amiez C, Joseph JP, Procyk E (2005) Anterior cingulate error-related activity is modulated by predicted reward. Eur J Neurosci 21:3447-3452. 10.1111/j.1460-9568.2005.04170.x - DOI - PMC - PubMed
    1. Arkadir D, Morris G, Vaadia E, Bergman H (2004) Independent coding of movement direction and reward prediction by single pallidal neurons. J Neurosci 24:10047-10056. 10.1523/JNEUROSCI.2583-04.2004 - DOI - PMC - PubMed
    1. Baunez, C., Amalric M. and Robbins T. W. (2002) Enhanced food-related motivation after bilateral lesions of the subthalamic nucleus. J Neurosci 22 (2): 562-568. - PMC - PubMed
    1. Baunez, C., Nieoullon A. and Amalric M. (1995) In a rat model of parkinsonism, lesions of the subthalamic nucleus reverse increases of reaction time but induce a dramatic premature responding deficit. J Neurosci 15 (10): 6531-6541. - PMC - PubMed
    1. Baunez, C. and Robbins T. W. (1997) Bilateral lesions of the subthalamic nucleus induce multiple deficits in an attentional task in rats. Eur J Neurosci 9 (10): 2086-2099. - PubMed