. 2015 Oct 29;526(7575):719-22.
doi: 10.1038/nature15524. Epub 2015 Oct 19.

Bacteriocin production augments niche competition by enterococci in the mammalian gastrointestinal tract

Affiliations

Bacteriocin production augments niche competition by enterococci in the mammalian gastrointestinal tract

Sushma Kommineni et al. Nature. .

Abstract

Enterococcus faecalis is both a common commensal of the human gastrointestinal tract and a leading cause of hospital-acquired infections. Systemic infections with multidrug-resistant enterococci occur subsequent to gastrointestinal colonization. Preventing colonization by multidrug-resistant E. faecalis could therefore be a valuable approach towards limiting infection. However, little is known about the mechanisms E. faecalis uses to colonize and compete for stable gastrointestinal niches. Pheromone-responsive conjugative plasmids encoding bacteriocins are common among enterococcal strains and could modulate niche competition among enterococci or between enterococci and the intestinal microbiota. We developed a model of colonization of the mouse gut with E. faecalis, without disrupting the microbiota, to evaluate the role of the conjugative plasmid pPD1 expressing bacteriocin 21 (ref. 4) in enterococcal colonization. Here we show that E. faecalis harbouring pPD1 replaces indigenous enterococci and outcompetes E. faecalis lacking pPD1. Furthermore, in the intestine, pPD1 is transferred to other E. faecalis strains by conjugation, enhancing their survival. Colonization with an E. faecalis strain carrying a conjugation-defective pPD1 mutant subsequently resulted in clearance of vancomycin-resistant enterococci, without plasmid transfer. Therefore, bacteriocin expression by commensal bacteria can influence niche competition in the gastrointestinal tract, and bacteriocins, delivered by commensals that occupy a precise intestinal bacterial niche, may be an effective therapeutic approach to specifically eliminate intestinal colonization by multidrug-resistant bacteria, without profound disruption of the indigenous microbiota.


Conflict of interest statement

The authors declare no competing financial interests.

Figures

Extended Data Figure 1
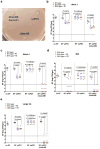
Extended Data Figure 1. EF colonization
(a) C57Bl6 mice (N=5) were given EFr in drinking water for 14 days. Fecal samples were taken from each animal at the transition to sterile drinking water (week 0) and then weekly. EFr abundance was determined by enumeration on BHI agar with rifampicin. (b) V583r, OG1RF, JL214 strains of EF that are rifampicin resistant were fed to groups of mice (N=5/group). EF strains were enumerated weekly as described above. Horizontal lines indicate geometric mean. Each symbol represents an individual animal, data is representative of more than three experiments in (a) and (b; for V583r and OG1RF) and result of one experiment for (b; JL214).
Extended Data Figure 2
Extended Data Figure 2. Physical map of plasmid pPD1
The 59 ORFs identified in the nucleotide sequence of pPD1 are located on a circular map. Arrows indicating the direction of transcription show the ORFs. Different colors indicate coding regions for conjugation (black), bac operon (red) and maintenance/repair (blue). Hypothetical coding regions are shown in magenta. A circular plasmid map was generated using the SnapGene software (from GSL Biotech; available at snapgene.com). Schematic diagrams of multiple alignments of plasmids were produced by manually realigning the linear plasmid maps generated by the SnapGene Viewer.
Extended Data Figure 3
Extended Data Figure 3. pPD1 enhances EF competition for an intestinal niche
(a) Bacteriocin assay by the soft agar method with EFr+pPD1::ΔbacAB, bacA-E+, EFr+pPD1 and EFr+pPD1::ΔbacAB spotted on a lawn of susceptible EF. Mice (N=5/group) were given EFr or EFr +pPD1 or EFr+pPD1::ΔbacAB or sterile drinking water for 14 days, at which time all mice were given sterile water. (b) One week and (c) four weeks after withdrawal of EF from drinking water, fecal samples were collected and abundance of total enterococci was determined by enumeration on m-Enterococcus selective agar (Ent agar, ○). Lab strain of EF was enumerated using Ent agar with rifampicin (Rf) (○), or BHI agar with rifampicin (○). (d and e and Fig. 1e) At the end of week four, animals were euthanized and abundance of EF was determined in distal small intestine (DSI) and large intestine (LI). The results shown are representative of two biologically independent experiments. Horizontal lines indicate geometric mean. Each symbol represents an individual animal.
Extended Data Figure 4
Extended Data Figure 4. EF+pPD1 but not EF r+pCF10 dominates the intestinal enterococcal population
pCF10 is a well-studied pheromone-inducible conjugative plasmid of EF that encodes resistance to tetracycline but does not encode a known bacteriocin determinant. (a) EFr: (o, N=3 mice, no plasmid), EFr+pPD1: (☐, N=3 mice, pPD1) or EFr+pCF10, (∇, N=5 mice, pCF10) was added to drinking water for 14 days, and then replaced by sterile drinking water. (a) Fecal samples were taken from each animal at the transition to sterile drinking water (week 0) and then weekly. EF abundance was determined by enumeration on BHI agar with rifampicin. (b) Four weeks after withdrawal of EF from drinking water, animals were euthanized and abundance of EFr+pCF10 was determined in each segment of the GI tract (distal small intestine, DSI; cecum; and large intestine, LI). Mice colonized with EFr+pCF10 maintained long-term fecal shedding of EFr+pCF10 similar to EFr, and persistent colonization throughout the GI tract. Abundance of enterococci in the feces was determined by enumeration on m-Enterococcus agar (Ent agar, o), Ent agar with rifampicin (Rf) (○), or BHI agar with rifampicin (○) at week 1 (c) and week 4 (d). Unlike EFr+pPD1 that dominated the enterococcal niche in the GI tract (Fig. 1e), EFr+pCF10 did not outcompete the indigenous enterococci, colonizing at levels comparable to EFr (c and d). (a) The lines are fitted using an exponential decay model, and there are significant differences in rate of decay for the “pCF10” group vs. “pPD1” group (P=0.012) and for the “pPD1” vs. “no plasmid” group (P=0.007). Horizontal lines in (b, c, and d) indicate geometric mean. Each symbol represents an individual animal; data are obtained from one experiment.
Extended Data Figure 5
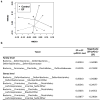
Extended Data Figure 5. Microbiome analysis
(a) NMDS Ordination of control and EF samples as separated by Bray-Curtis beta diversity metric. Control (no EF treatment, N=5 mice) and EF samples (N= 5 mice) are intermixed and showed no significant difference in beta diversity between the two groups. Adonis P value=0.298. Samples are connected with lines to help visualize grouping. (b) Analysis at the OTU level between EF and EF+pPD1 suggests changes in the abundance of four bacterial genera, in particular Deferribacteraceae; Mucispirillum and Lachnospiraceae; Incertae Sedis (P = 0.0001 and 0.005, respectively; heteroscedastic two-sided Student’s t-test). Bacteria belonging to these genuses were ten-fold and two-fold lower respectively in EF+pPD1 colonized mice (note the magnitude of change is shown in log10 scale). Changes in Defluviitaleaceae; Incertae Sedis, and Lachnospiraceae; Blautia were not as pronounced (P = 0.03; heteroscedastic two-sided Student’s t-test). Nevertheless, analyses at the family taxonomy level suggest that the change in Deferribacteraceae was statistically significant.
Extended Data Figure 6
Extended Data Figure 6. Reciprocal experiment for Fig. 2a, d and g
Groups of mice (N=5 mice per group) were given mixtures of EFr+pPD1 and EFs in drinking water at ratios of 10%/90% (a), 50%/50% (b) and 90%/10% (c) respectively. Fecal samples were obtained at the transition to sterile drinking water (week 0) and then weekly. Abundance of each EF strain in feces was determined by enumeration on BHI agar with rifampicin and BHI agar with spectinomycin. (☐) represent abundance of EFr+pPD1 and (○) represent abundance of EFs. Each symbol represents an individual animal. The differences between the two groups at each week were compared using a nonparametric Wilcoxon test, and all P values were ns (non significant) (a); and <0.005 (b). The P values in (c) are 0.0122 (week 0) and 0.0075 (week 1–4). The lines are fitted using an exponential decay model in (a) and (b). The results in a, b and c are from one experiment.
Extended Data Figure 7
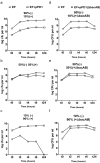
Extended Data Figure 7. pPD1 associated competition in vitro
Three independent cultures were carried out with various mixed populations of EFr (−) and EFs+pPD1(+) or EFr (−) and EFs +pPD1::ΔbacAB (+ΔbacAB) in 10 ml BHI broth at ratios of 90%/10% (a and d), 50%/50% (b and e) and 10%/90% (c and f). Samples were taken for serial dilution at 0, 2, 4, 6 and 24 hours after the start of the experiment. Abundance of each EF strain in feces was determined by enumeration on BHI agar with rifampicin and BHI agar with spectinomycin. Evidence of conjugation was observed in vitro co-cultures of (a) and (b) only by screening for transconjugants (EFr+pPD1) via colony PCR. (☐) represent abundance of EFs+pPD1 (a, b and c) or EFs+pPD1:: ΔbacAB (d, e and f). (○) represent abundance of EFr (a–e). Data is representative of two biologically independent experiments.
Extended Data Figure 8
Extended Data Figure 8. Complementation of Bac-21 production restores colonization phenotype by providing competitive advantage
Bacteriocin activity was restored upon ectopic expression of bacABCDE (from pAM401) in EF+pPD1::ΔbacAB but not in EF lacking pPD1, indicating that the distal part of the bac operon (bacFGHI) is necessary for bacteriocin expression and that the bacAB in-frame deletion is not polar on downstream genes. Mice (N=5) were given EFr+pPD1::ΔbacAB, bacABCDE+ as described in the methods and abundance was determined by enumeration on m-Enterococcus agar (Ent agar), Ent agar plus rifampicin (Rf), or BHI agar with rifampicin. The presence of pAM401A::bacABCDE+ (complementing plasmid) was determined by enumerating CFU on BHI agar with rifampicin and chloramphenicol (Cm). Fecal samples were obtained at week 1 (a) and week 4 (b) after transition to sterile drinking water. Horizontal lines indicate geometric mean. Each symbol represents an individual animal and data is a representative of two biologically independent experiments. EFs +pPD1::ΔbacAB bacABCDE+ stably colonized the GI tract (a), although in the absence of chloramphenicol selection, pAM401::bacABCDE was gradually lost from the population (b). Over time, loss of pAM401::bacABCDE resulted in the complemented strain reverting back to the bacteriocin-defective ΔbacAB strain, with the loss of bacteriocin activity. Nevertheless, this strain persisted in the gut, suggesting that Bac-21 was essential for clearing a niche for EF, but once cleared, EF uses other mechanisms to maintain colonization (a and b).
Extended Data Figure 9
Extended Data Figure 9. EFr levels are not altered by sequential colonization with EFs+pPD1
Groups of mice (N=5 mice per group) were given EFr in drinking water for two weeks and subsequently challenged with EFs+pPD1 in drinking water for another 2 weeks (beginning at week −2) before transition to sterile water (week 0). Fecal samples were obtained weekly to enumerate the abundance of EFr (a) and EFs+pPD1 (b) on BHI agar with rifampicin and spectinomycin respectively. Each symbol represents an individual animal and data is from one experiment.
Extended Data Figure 10
Extended Data Figure 10. Conjugation frequency of pPD1 between lab strain (EF+pPD1) and indigenous enterococci (IE) in vitro
To understand conjugation dynamics between non-isogeneic species of enterococci, we investigated indigenous enterococcal (IE) transconjugants in mice that were colonized with EFr+pPD1 (Fig. 1e and Extended Data Fig. 3b–e). However, we were unable to detect Rf-sensitive enterococci (IE) from the feces sample at week 4 (Extended Data Fig. 3c). At week one, only 9 clones of IE that were Rf-sensitive (out of 730 enterococci) were isolated from 3 out of 5 mice (Extended Data Fig 3b). Bacteriocin assays and probing for bacA gene sequence confirmed that 6 out of 9 clones were transconjugants and were Bac-21 positive. 16S rDNA gene sequencing of these 9 clones show high similarities to E. faecalis 16S rDNA. To understand the reason behind low conjugation frequency between IE and the lab strain of EFr+pPD1, in vitro conjugation experiments were performed to assess the frequency of plasmid transfer. Ten new clones of IE were isolated from the feces of five mice (2 clones per mouse that were not colonized with any lab strain) by culturing on m-Enterococcus agar. EFr +pPD1 was mixed with each of these ten IE clones in BHI broth at a 1:9 ratio. Samples were taken for serial dilution at the start of the culture (t0; a) and after 24 hours (t24; b) from the start of the experiment. Abundance of total enterococci was determined by using m-Enterococcus agar, and EFr +pPD1 on BHI agar+Rf. Data is representative of 3 biologically independent experiments. In vitro bacteriocin assays revealed that EFr +pPD1 is capable of killing most of the non-pPD1 containing IE strains (not shown). In vitro conjugation assays between individual IE clones and EFr+pPD1 led to three observations: (i) 4 out of 10 clones were susceptible to Bac-21 and were eliminated by EFr+pPD1 (#3, #4, #8 and #9); (ii) 6 out of 10 were immune to Bac-21 killing (#1, #2, #5, #6, #7 and #10); (iii) probing for bacA provided evidence for pPD1-containing IE transconjugants in 4 out of 6 above-mentioned immune IE clones. The two clones that failed to conjugate and were resistant to Bac-21 killing in mixed culture experiment were also resistant to EFr +pPD1 on bacteriocin assay plates. The mechanism for resistance of these two clones is not clear, however one could speculate that they might harbor cross-resistance traits.
Figure 1
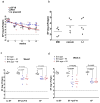
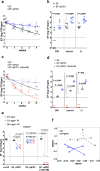
Figure 1. pPD1 enhances EF competition for an intestinal niche
Mice were colonized by EFr (o, N=5) or EFr+pPD1 (☐, N=6) which were enumerated weekly from feces (a), and at week 4 from each segment of the GI tract (b) (distal small intestine, DSI; cecum; and large intestine, LI). (c–d) Mice were colonized with EFr+pPD1::ΔbacAB (∆, N=5), EFr (o, N=3) or EFr +pPD1 (☐, N=3). EF fecal abundance was determined weekly (c) and in GI tract at week 4 (d). (e) Mice (N=5/group) were colonized with EFr, EFr+pPD1, EFr+pPD1::ΔbacAB or sterile drinking water; at week four, abundance of total enterococci (indigenous + lab strains) and rifampicin–resistant lab strains of EF were enumerated in each segment of the GI tract. (f) Microbiome analysis: Ordination of EF (o, N=5 mice) and EF+pPD1 (☐, N=5 mice) samples were separated by Bray-Curtis beta diversity metric (Adonis P=0.007). Samples are connected to help visualize grouping. An exponential decay model was fitted to the data in (a) and (c). (a) Rate of decay is significantly different between the two groups in (a) P<0.0001) and (c) EFr+pPD1:: ΔbacAB vs EF r (P<0.0001) and EFr+pPD1:: ΔbacAB vs. EF+pPD1 (P<0.0001). Horizontal lines indicate geometric mean. Each symbol represents an individual animal; data are representative of six (a–b) and two (e) biologically independent experiments. Data is from one experiment in c, d and f. All graphs: dashed line indicates the limit of detection at 100 CFU per gram feces.
Figure 2
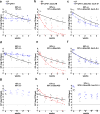
Figure 2. Bacteriocin provides a competitive survival advantage to EF in the GI tract
Mice (N=5/group) were given mixtures of [EFr (−) and EFs +pPD1 (+)] or [EFr and EFs +pPD1::ΔbacAB] or [EFr and EFs+pPD1::ΔbacAB, bacA-E+] in drinking water at indicated ratios, and fecal shedding was determined weekly. Each symbol represents an individual animal. Lines are fitted using an exponential decay model. Rate of decay is significantly different between the two groups (a) P=0.0004; (b) P<0.0001; (c) P=ns (d) P<0.0001; (e) P=0.001; (f) P=ns; (g) P=0.0117 (Week 0) and 0.0075 (Week 1, 2, 3, and 4); (h) P=0.008; (i) P=0.012 (Week 0 and 1) and 0.0075 (Week 2, 3, and 4). The results in a, d and g are representative of three biologically independent experiments; data in b, c, e, f, h and i are results of one experiment.
Figure 3
Figure 3. pPD1 is transferred via conjugation within the mouse GI tract
(a and b) Mice (N=5/group) were colonized with mixtures of EFr and EFs+pPD1 water at indicated ratios. One hundred EFr colonies (from feces) per animal were screened weekly for pPD1. (c) Mice (N=5/group) were stably colonized with EFr and then challenged with EFs+pPD1. Fifty EFr colonies (from feces) per animal were screened weekly for pPD1. (a–c) Each symbol represents the percentage of fecal transconjugants in an individual animal. The line is the fitted logistic curve. The results in a, b and c are from one experiment each.
Figure 4
Figure 4. Bacteriocin reduces V583r colonization
Mice (N=5/group) were colonized with V583r. V583r was removed from drinking water for both groups (week -2). Group 1 received sterile water and group 2 received EFs+pPD1::ΔbacAB, bacA-E+ in drinking water for two additional weeks, followed by sterile water at Week 0. Fecal V583r (a) and EFs +pPD1::ΔbacAB, bacA-E+ (b) levels were enumerated weekly. The retention of complementation plasmid pAM401A::bacA-E+ by EFs+pPD1::ΔbacAB, bacA-E+ was determined weekly (b). Lines are fitted using an exponential decay model, and the rate of decay is significantly different between the two groups in (a) P<0.0001 and (b) P<0.0001. Each symbol represents an individual animal and data are representative of three biologically independent experiments. Dashed line indicates the limit of detection at 100 CFU per gram feces.

References

    1. Richards MJ, Edwards JR, Culver DH, Gaynes RP. Nosocomial infections in combined medical-surgical intensive care units in the United States. Infect Control Hosp Epidemiol. 2000;21(8):510–515. - PubMed
    1. Broaders E, Gahan CG, Marchesi JR. Mobile genetic elements of the human gastrointestinal tract: potential for spread of antibiotic resistance genes. Gut Microbes. 2013;4(4):271–280. - PMC - PubMed
    1. Nes Ingolf F, D BD, Yasuyoshi Ike. Enterococcal Bacteriocins and Antimicrobial Proteins that Contribute to Niche Control BTI - Enterococci: From Commensals to Leading Causes of Drug Resistant Infection. In: Gilmore E-i-c Michael S, Clewell Don B, Ike Yasuyoshi, Shankar Nathan., editors. Enterococci: From Commensals to Leading Causes of Drug Resistant Infection. Massachusetts Eye and Ear Infirmary; Boston: 2014. - PubMed
    1. Fujimoto S, Tomita H, Wakamatsu E, Tanimoto K, Ike Y. Physical mapping of the conjugative bacteriocin plasmid pPD1 of Enterococcus faecalis and identification of the determinant related to the pheromone response. Journal of Bacteriology. 1995;177(19):5574–5581. - PMC - PubMed
    1. Hooper LV, Midtvedt T, Gordon JI. How host-microbial interactions shape the nutrient environment of the mammalian intestine. Annu Rev Nutr. 2002;22(0199-9885):283–307. (Print) - PubMed

Publication types

MeSH terms