. 2015 Nov 5;527(7576):100-104.
doi: 10.1038/nature15376. Epub 2015 Oct 19.

Microenvironment-induced PTEN loss by exosomal microRNA primes brain metastasis outgrowth

Affiliations

Microenvironment-induced PTEN loss by exosomal microRNA primes brain metastasis outgrowth

Lin Zhang et al. Nature. .

Abstract

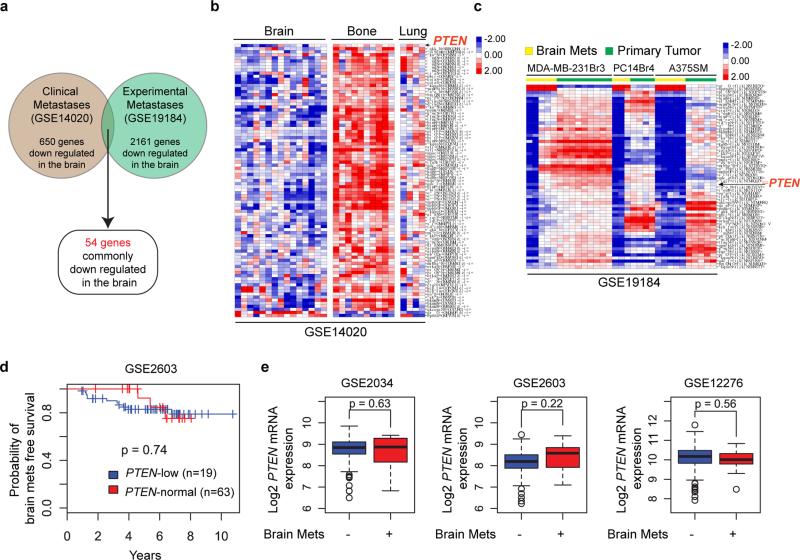
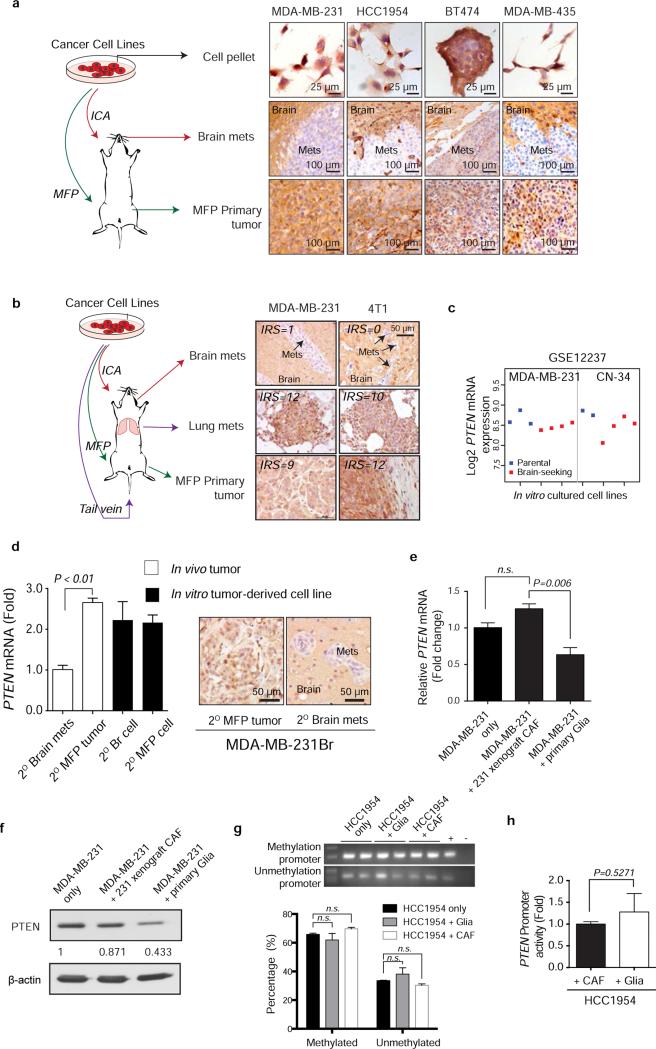
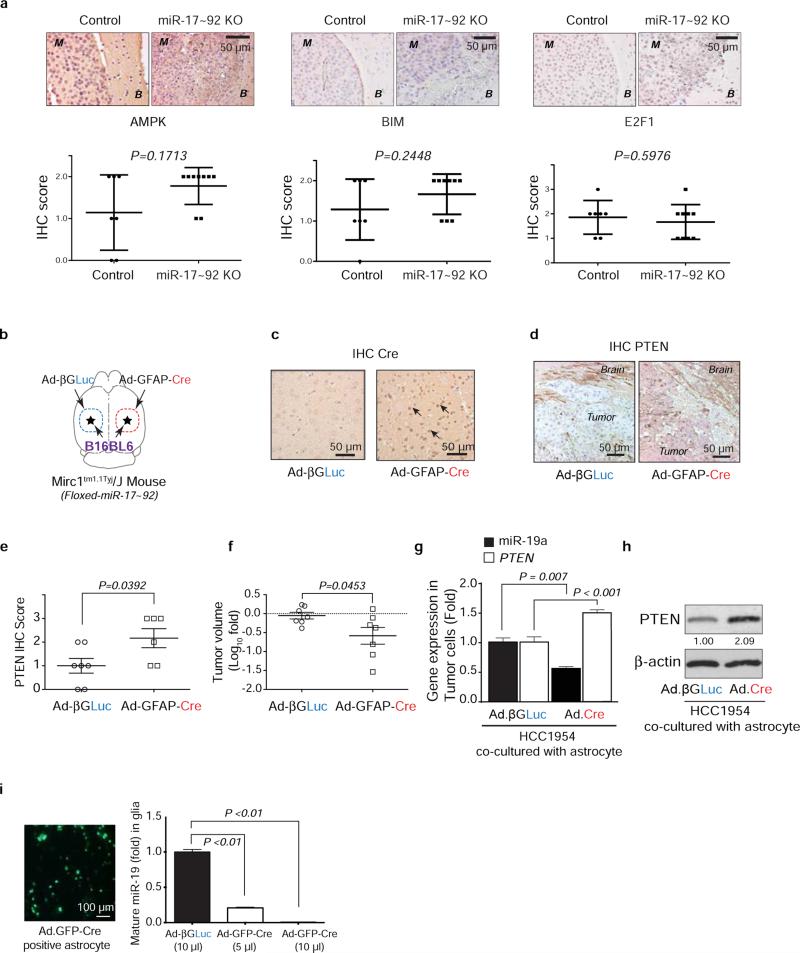
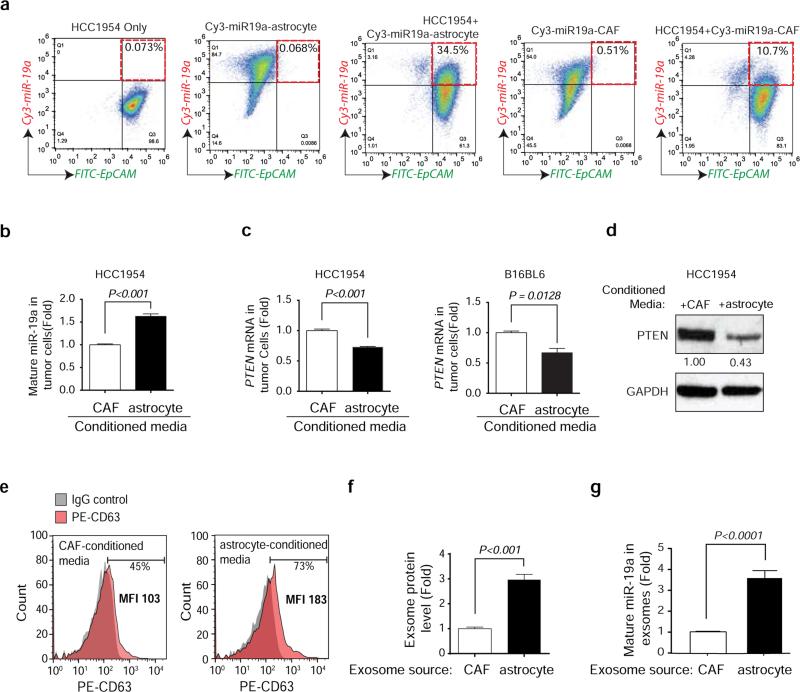
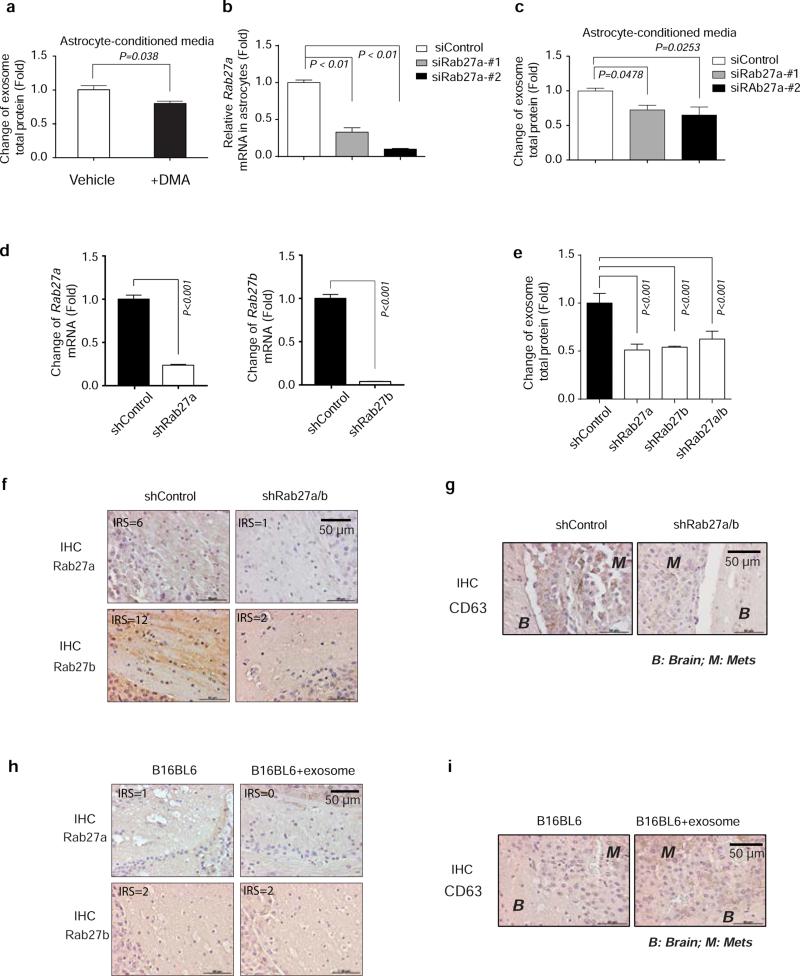
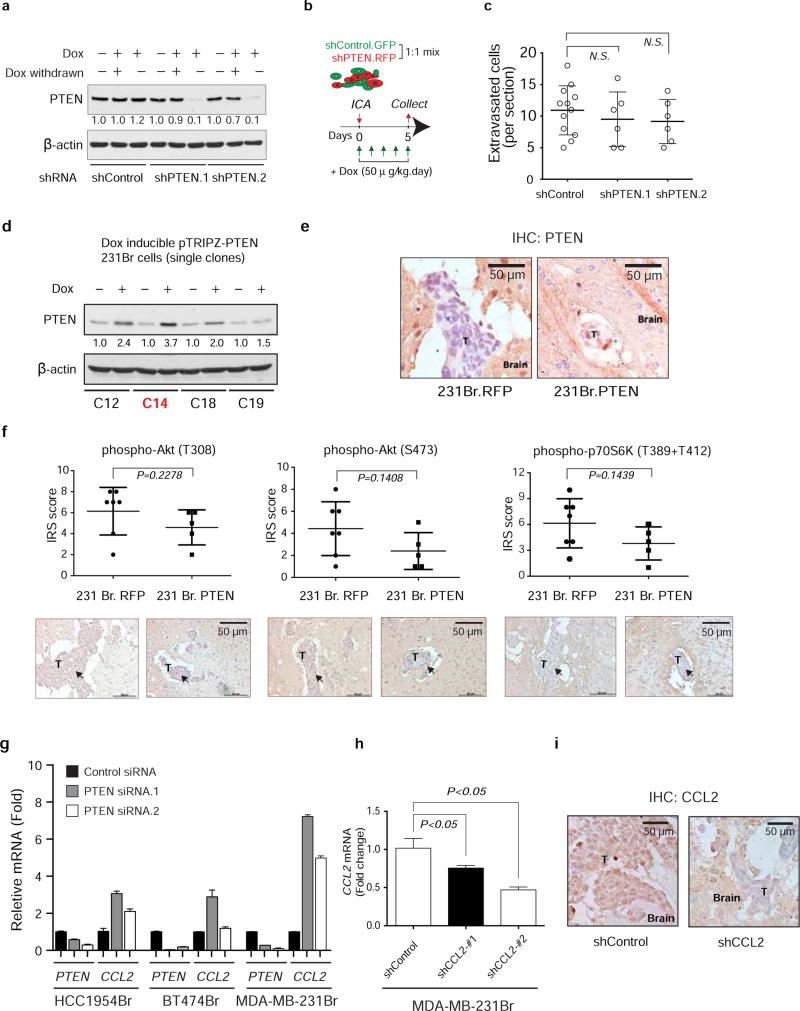
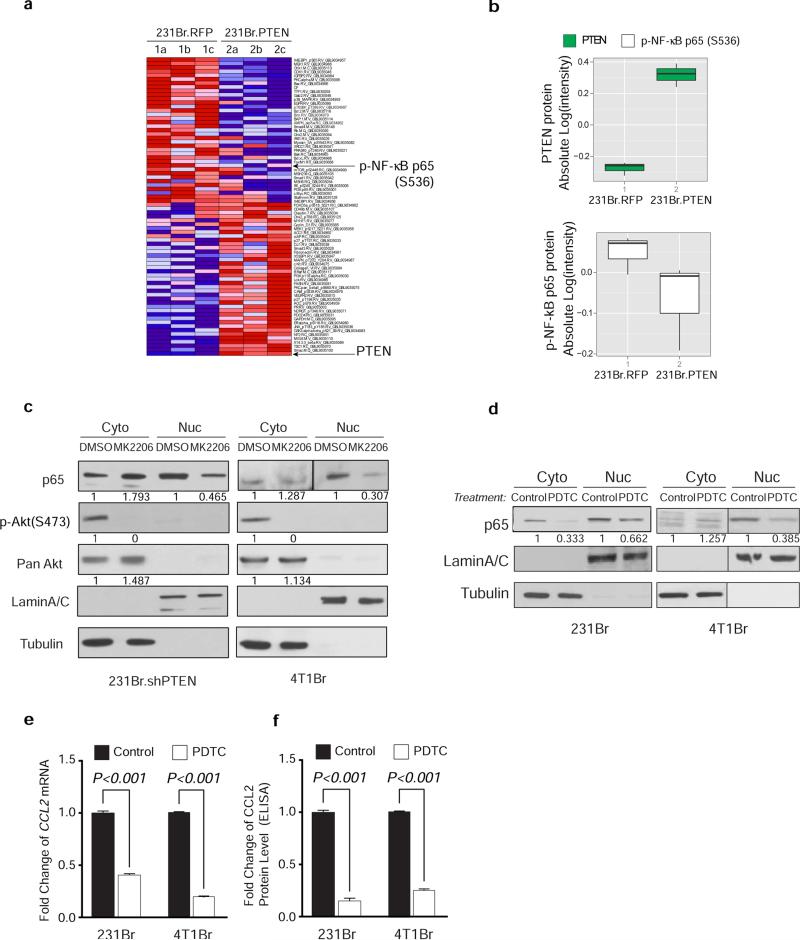
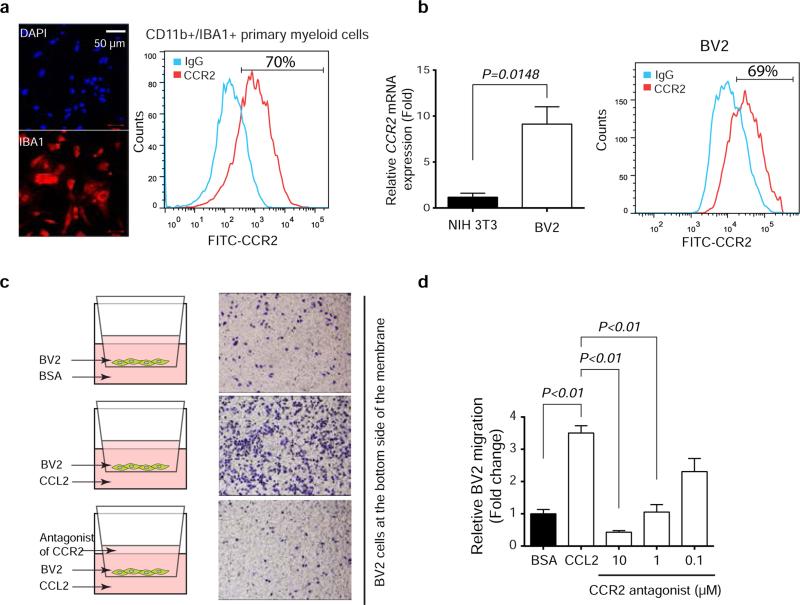
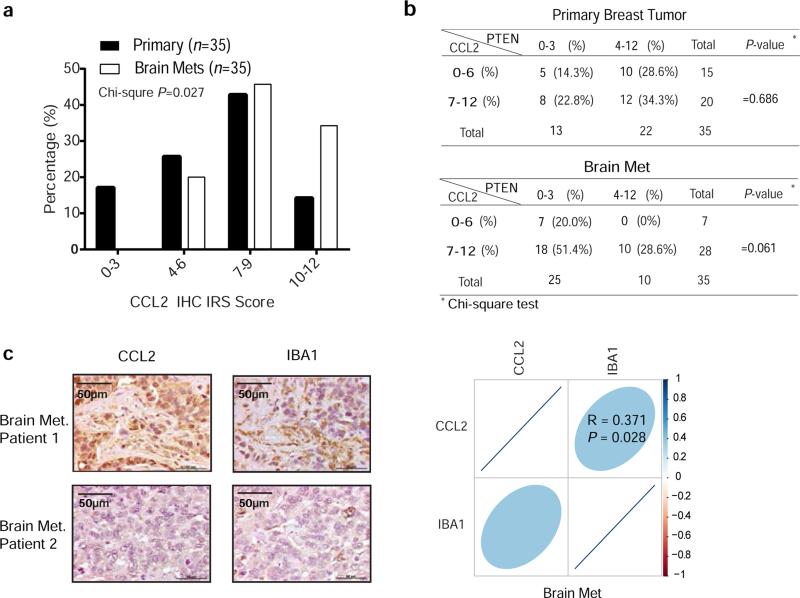
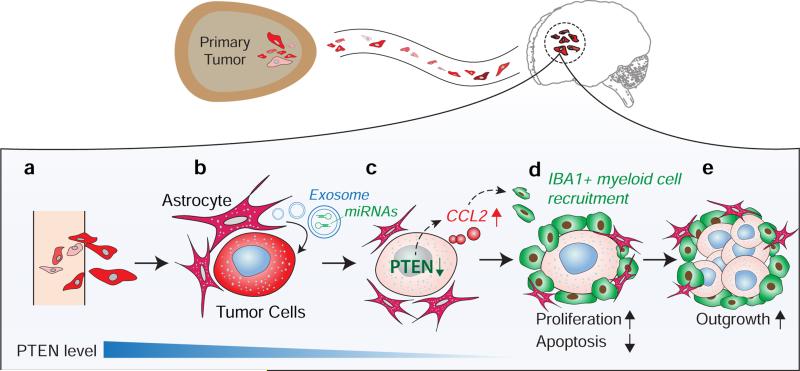
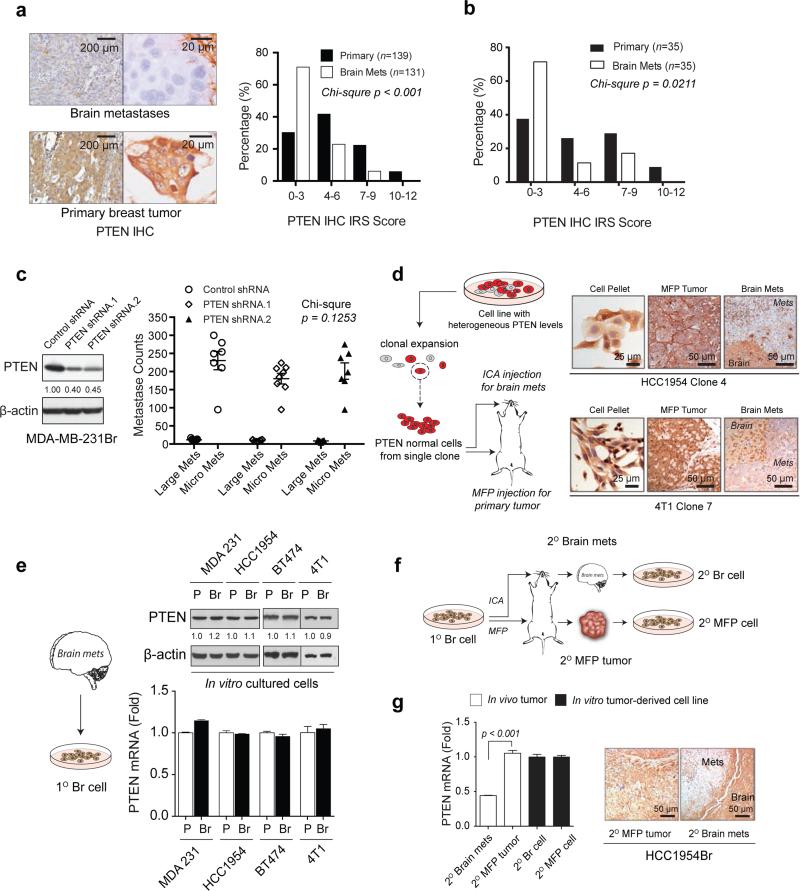
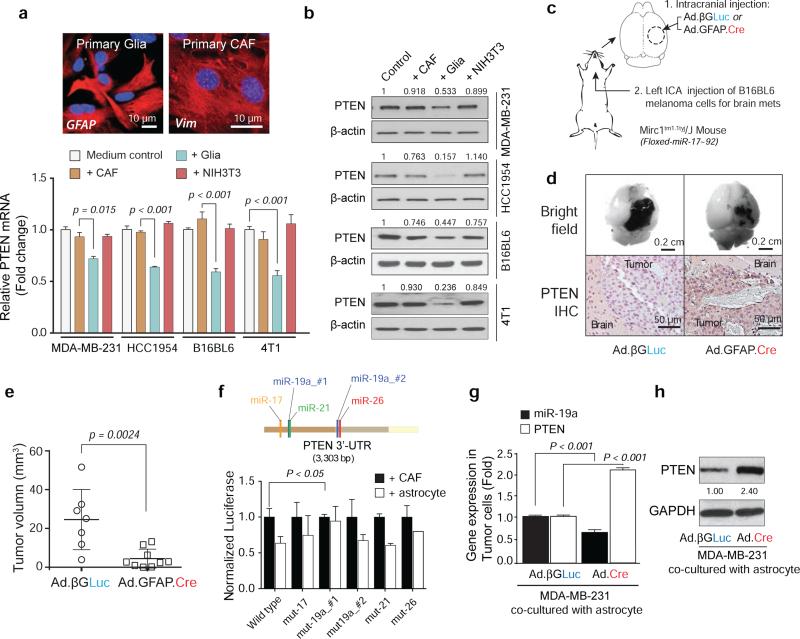
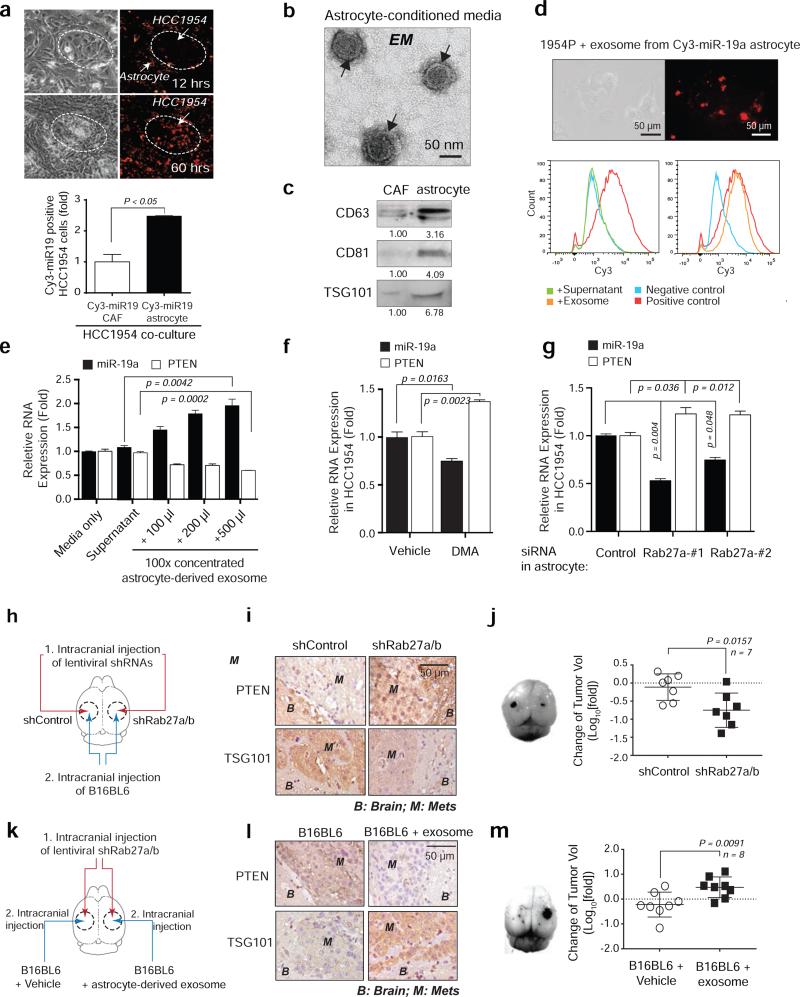
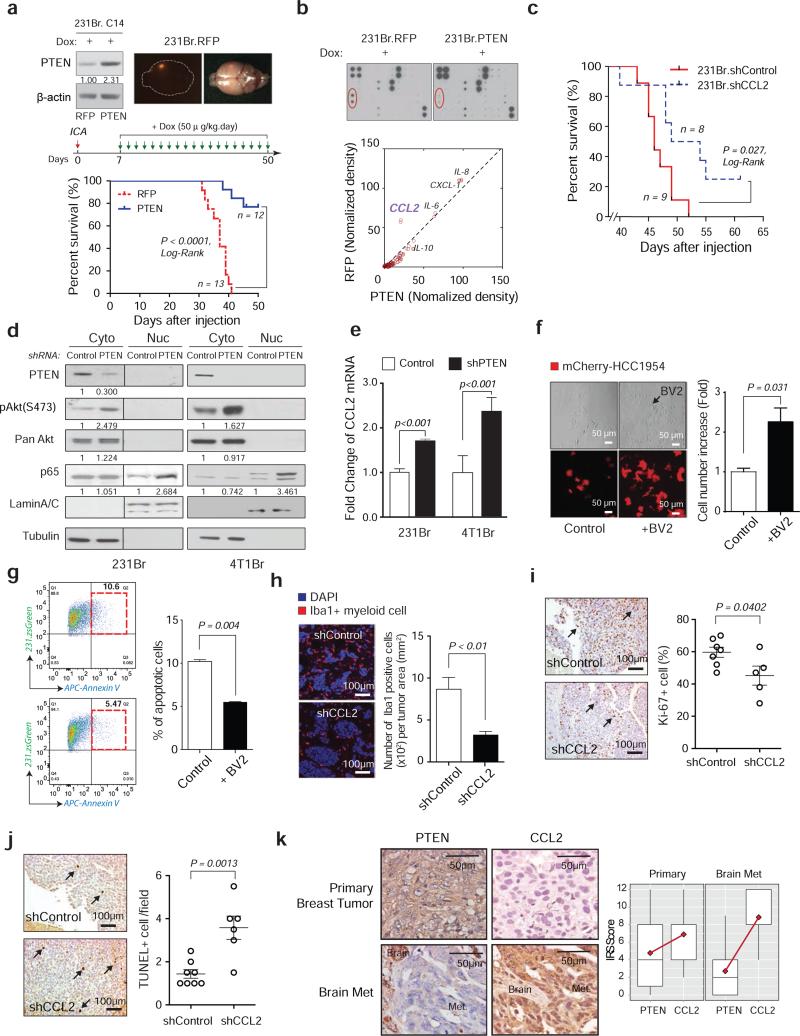
The development of life-threatening cancer metastases at distant organs requires disseminated tumour cells' adaptation to, and co-evolution with, the drastically different microenvironments of metastatic sites. Cancer cells of common origin manifest distinct gene expression patterns after metastasizing to different organs. Clearly, the dynamic interaction between metastatic tumour cells and extrinsic signals at individual metastatic organ sites critically effects the subsequent metastatic outgrowth. Yet, it is unclear when and how disseminated tumour cells acquire the essential traits from the microenvironment of metastatic organs that prime their subsequent outgrowth. Here we show that both human and mouse tumour cells with normal expression of PTEN, an important tumour suppressor, lose PTEN expression after dissemination to the brain, but not to other organs. The PTEN level in PTEN-loss brain metastatic tumour cells is restored after leaving the brain microenvironment. This brain microenvironment-dependent, reversible PTEN messenger RNA and protein downregulation is epigenetically regulated by microRNAs from brain astrocytes. Mechanistically, astrocyte-derived exosomes mediate an intercellular transfer of PTEN-targeting microRNAs to metastatic tumour cells, while astrocyte-specific depletion of PTEN-targeting microRNAs or blockade of astrocyte exosome secretion rescues the PTEN loss and suppresses brain metastasis in vivo. Furthermore, this adaptive PTEN loss in brain metastatic tumour cells leads to an increased secretion of the chemokine CCL2, which recruits IBA1-expressing myeloid cells that reciprocally enhance the outgrowth of brain metastatic tumour cells via enhanced proliferation and reduced apoptosis. Our findings demonstrate a remarkable plasticity of PTEN expression in metastatic tumour cells in response to different organ microenvironments, underpinning an essential role of co-evolution between the metastatic cells and their microenvironment during the adaptive metastatic outgrowth. Our findings signify the dynamic and reciprocal cross-talk between tumour cells and the metastatic niche; importantly, they provide new opportunities for effective anti-metastasis therapies, especially of consequence for brain metastasis patients.


Figures

Extended Data Figure 1
Extended Data Figure 1. Organ-specific loss of PTEN in brain metastases
a, Schematics of microarray analyses. Patients’ brain metastases exhibited a discrete gene expression profile with 650 genes significantly down-regulated compared to bone or lung metastases (GSE14020). Cancer cells were injected into immunodeficient mice to produce orthotopic primary tumors (MDA-MB-231 cells for mammary tumor, PC14 for prostate tumor, A375SM for melanoma) and experimental brain metastases (all three lines). Brain metastases derived from these three cancer cell lines exhibited 2161 commonly down-regulated genes compared to their respective primary tumors (GSE19184). PTEN is one of only 54 commonly down-regulated genes in brain metastases of both datasets. b, Heat-maps showing expression of 54 commonly down-regulated genes (see a) in clinical brain metastases versus lung metastases and bone metastases. c, Heat-maps showing expression of the 54 genes (see a) in cell line-induced primary tumors versus experimental brain metastases. d, Kaplan–Meier survival analyses showing no significant differences in brain metastasis-free survival between breast cancer patients with primary tumors expressing normal PTEN or low PTEN mRNA in GEO cDNA microarray set GSE2603. e, PTEN mRNA levels detected in primary breast tumors from patients with or without brain metastasis relapse. Three GEO cDNA microarray datasets (GSE2034, GSE2603 and GSE12276) with clinical annotation were analyzed. Relative PTEN expression levels were compared by t-test.
Extended Data Figure 2
Extended Data Figure 2. PTEN expression in different metastatic organ microenvironments and in vitro culture condition
a, Breast cancer cell lines (MDA-MB-231, HCC1954, BT474, and MDA-MB-435) were cultured and injected either to mammary fad pad (MFP) to form primary tumor or intracarotidly to form brain metastases. Cells pellets and tumor tissues were stained for PTEN expression by immunohistochemistry using anti-PTEN antibodies as done previously. b, IHC staining of PTEN in brain metastases, paired lung metastases and primary tumor derived from either MDA-MB-231 or 4T1 cells. PTEN expression level was analyzed based on IRS scoring system. c, PTEN mRNA levels between parental MDA-MB-231 and CN-34 breast cancer cell lines (blue) and their brain-seeking sublines (red). Normalized PTEN-specific probe intensity values were extracted from cDNA microarray dataset GSE12237. Dot plot shows the mean probe intensity derived from independent RNA samples. d, PTEN qRT-PCR (mean ± s.e.m., t-test) and IHC in MDA.MB.231Br secondary tumors and cultured cells. e-f, qRT-PCR (e) and western blot (f) analysis of PTEN mRNA expression (mean ± s.e.m., t-test) or protein expression in MDA-MB-231 cells after co-culture with either primary mouse CAFs isolated from MDA-MB-231 xenograft tumors or primary mouse glia isolated from mouse brain. g, Representative methylation-specific PCR of PTEN promoter and quantification under co-culture with glia or CAF (mean ± s.e.m., t-test). h, PTEN promoter activity measured by luciferase reporter in HCC1954 cells after co-culture with either CAF or glia cells for 48 hours (mean ± s.e.m., t-test).
Extended Data Figure 3
Extended Data Figure 3. Cre-mediated depletion of PTEN-targeting microRNAs in astrocytes
a, IHC analyses of AMPK, Bim, and E2F1 expression (mean ± s.d, t-test) in brain metastasis tumors with/without pre-knocking out (KO) miR-17-92 cluster in brain microenvironment. M: brain metastases; B: brain tissue. b, Schematic of experimental design. GFAP-Cre adenovirus (Ad-GFAP-Cre) was injected intracranially to the right hemisphere of the Mirc1 mouse, and the control adenovirus (Ad-βGLuc) was injected intracranially to contralateral side of the brain. Then B16BL6 cells were injected intracranially to both sides. c, IHC analysis of Cre expression in the brain astrocytes. d, IHC analysis of PTEN expression in the tumor cells. e, Quantifications of PTEN expression in tumor cells (mean ± s.d., t-test). f, Quantification of intracranial tumor outgrowth by volume (mean ± s.e.m., t-test). g, qRT-PCR analyses of miR-19a and PTEN mRNA in tumor cell HCC1954 after 48 hour co-culture with primary astrocytes from Mirc1tm1.1Tyj/J mice pre-infected (48 hours) by adenovirus (Ad-βGLuc or Ad.GFP.Cre) (mean ± s.e.m., t-test). h, WB of PTEN protein in the indicated tumor cells co-cultured as in (g). i, Knockout of miR-17-92 allele in cultured primary astrocytes. miR-17~92 cluster is flanked by loxP site in Mirc1tm1.1Tyj/J mouse. Primary astrocytes were isolated from Mirc1 mouse brain then infected by adenovirus encoding for βGLuc or GFP.Cre protein. Concentrated adenovirus particles of indicated volume (same MOI ~108 units/mL) encoding βGLuc or GFP.Cre proteins were added to 106 astrocytes. Left, representative photo showing the infection efficiency. Right: bar diagram showing the relative miR-19a expression (one of the five miRNA genes in the miR-17-92 cluster) three days after adenovirus infection (mean ± s.e.m., t-test).
Extended Data Figure 4
Extended Data Figure 4. Contact-independent down-regulation of PTEN in tumor cells by miR-19a from astrocyte derived exosomes
a, Flow cytometric detection of Cy3-miR-19a and FITC-EpCAM in tumor cells 60 hours after co-culture with Cy3-miR-19a-transfected astrocytes and CAFs. b-c, Tumor cells were co-cultured with conditioned media from astrocytes or CAFs for 60 hours. RT-PCR analyses of PTEN-targeting miR-19a level (b) and PTEN mRNA level (c) in tumor cells (mean ± s.e.m., t-test). d, Western blot detecting PTEN protein levels in HCC1954 cells after culture with conditioned media from either astrocytes or CAFs for 60 hours. e, Flow cytometry detecting CD63+ exosomes extracted from CAF- or astrocyte-conditioned media. f, Histogram showing the exosome protein level detected from CAF- and astrocyte-conditioned media normalized by cell number (mean ± s.e.m., t-test).g, RT-PCR analyses of miR-19a level in exosomes extracted from CAF or astrocyte conditioned media normalized by equal cell numbers (mean ± s.e.m., t-test).
Extended Data Figure 5
Extended Data Figure 5. Inhibition of exosome release by DMA, Rab27a siRNA or Rab27 shRNAs
a, Exosome-releasing inhibitor (DMA) treatment reduced exosome secretion from astrocytes compared to vehicle treated astrocytes. Astrocytes were treated with DMA (25μg/ml) or vehicle for 4 hours; exosomes were concentrated from astrocyte-conditioned media and total proteins from exosomes were examined by BCA assay (normalized to total cell numbers) (mean ± s.e.m., t-test). b, Knockdown of Rab27a in astrocytes by siRNA. Two siRNAs targeting mouse Rab27a were transiently transfected into astrocytes and mRNA level of Rab27a was examined by RT-PCR 48 hours after transfection (mean ± s.e.m., t-test). c, Knocking down Rab27a in astrocytes inhibited exosome release. 48 hours after Rab27a-targeting siRNAs were transfected, exosomes were collected from astrocyte-conditioned media and total proteins from exosomes were examined by BCA assay (normalized to total cell numbers) (mean ± s.e.m., t-test). d, Histogram showing relevant changes of Rab27a and Rab27b mRNA level in primary astrocytes infected with pLKO.shRab27a or pLKO.shRab27b virus (mean ± s.e.m., t-test, P<0.001, 3 biological replicates, with 3 technical replicates each). e, Change of exosome protein level detected in astrocyte-conditioned media from cells infected by pLKO.shRab27a or pLKO.shRab27b virus by BCA assay (normalized to total cell numbers) (mean ± s.e.m., t-test, P<0.001, 3 biological replicates, with 3 technical replicates each). f-g. IHC analysis showing the expression level of Rab27a, Rab27b (f) and exosome marker expression CD63 (g) in the brain tissue derived from mice injected with control lentivirus or Rab27a/b shRNA lentiviruses and subsequently intracranially injected with B16BL6 cells. h-i. IHC analysis showing the expression level of Rab27a and Rab27b (h) and exosome marker expression CD63 (i) in the brain tissue derived from mice injected with Rab27a/b shRNA lentiviruses and subsequently intracranially injected with B16BL6 cells with vehicle or B16BL6 cells with astrocyte derived exosomes.
Extended Data Figure 6
Extended Data Figure 6. Brain extravasation of MDA-MB-231 parental cells with or without induction of Dox-inducible PTEN shRNA knockdown, PTEN expression and CCL2 shRNA knockdown
a, Western blot showing PTEN expression levels after treating MDA-MD-231 cells with doxycycline (Dox). MDA-MD-231 cells were stably infected with inducible shRNA expression vectors (pTRIPZ-Control.sh.GFP as control and pTRIPZ.shRNA.RFP for PTEN shRNA). Dox (1 μg/ml) was added to induce shRNA expression for five days. As indicated, Dox were withdrawn in some samples for another five days before analysis. b, Schematics of in vivo extravasation assay. shControl.GFP and shPTEN.RFP cells were mixed at 1:1 ratio. Total 200,000 cells were injected intracarotidly into mice. Dox (50 μg/kg) was given to mice intraperitoneally daily. Brains were collected 5 days after injection. ICA: intracarotid injection. c, Dot-plot of extravasated cell counts five days after intracarotid injection of indicated MDA-MB-231 sublines. Tumor bearing brains were collected and sectioned into 100 μm brain coronal slices. The extravasated tumor cells were counted under the fluorescence microscope (mean ± s.d., t-test). d, MDA-MB-231Br single cells were expanded into subclones (C12, C14, C18, and C19) which were transfected with Dox-inducible pTRIPZ.RFP or pTRIPZ.PTEN. 48 hours after Dox (1μg/mL) treatment, PTEN induction was tested by western blotting. C14 clone were used for further in vivo assays (see Fig. 4a, and Extended Data 6e-f). e, Induced PTEN expression in brain metastases. IHC staining of PTEN expression levels in brain metastases derived from mice injected with MDA-MB-231Br (231Br. RFP or 231Br. PTEN) cells. T: brain metastasis tumors at day 30 post intracarotid injection. f, IHC analysis of PTEN downstream singling pathway, including phospho-Akt(T308), phospho-Akt(S473) and phospho-P70S6K(T389+T412) in brain metastases from mice injected with 231Br.RFP versus 231Br.PTEN cells. Top, dot-plot of IHC data quantification by immuno-reactive score (IRS) (mean ± s.d., t-test); bottom, representative IHC staining data. T: brain metastasis tumors at day 30 post intracarotid injection. g, Histograms of PTEN and CCL2 mRNA levels (mean ± s.e.m., t-test) in indicated cancer cell lines 48 hours after transfection with control or PTEN siRNAs. h, Histogram showing the inducible CCL2 knockdown. MDA-MB-231Br cells were stably infected with pTRIPZ inducible CCL2 shRNAs. 48 hours after Dox (1μg/ml) treatment, CCL2 mRNA was examined by RT-PCR (mean ± s.e.m., t-test). i, Dox-induced CCL2 knockdown in brain metastases. Mice were ICA injected with MDA-MB-231Br cells harboring control or CCL2 shRNAs. Dox (50 μg/kg) was given to mice intraperitoneally daily after injection. IHC staining of CCL2 expression levels in brain metastases derived from MDA-MB-231Br cells. T: brain metastasis tumors at day 30 post intracarotid injection.
Extended Data Figure 7
Extended Data Figure 7. PTEN-regulated CCL2 expression through NFκB pathway
a, Heatmap showing differentially expressed protein markers of Reverse Phase Protein Array (RPPA) analysis. Dox-inducible pTRIPZ.RFP or pTRIPZ.PTEN cells. MDA-MB-231Br were stably infected with pTRIPZ.RFP or pTRIPZ.PTEN (231Br. RFP or 231Br. PTEN) and induced by Dox (1μg/mL) for 48 hours. b, Box chart showing the absolute intensity of PTEN and NF-κB p65 (S536). c, Western blot analysis of NF-κB p65 nuclear translocation after Akt inhibitor (MK2206) treatment. Cells were treated with MK2206 (10 μg/mL) 24 hours before being separated into cytosol (Cyto) and nuclear (Nuc) fraction. d, Western blot analysis of NF-κB p65 nuclear translocation after NF-κB inhibitor PDTC treatment. Cells were treated with PDTC (0.2 mM) 16hours before being separated into cytosol (Cyto) and nuclear (Nuc) fraction. e, Relative CCL2 mRNA expression after NF-κB inhibitor PDTC treatment analyzed by qPT-PCR (mean ± s.e.m., t-test). Cells were treated with PDTC (0.2 mM) 16 hours. f, Relative CCL2 protein expression after NF-κB inhibitor PDTC treatment analyzed by ELISA (mean ± s.e.m., t-test). Cells were treated the same as (e).
Extended Data Figure 8
Extended Data Figure 8. CCR2-mediated Iba1+ myeloid cell directional migration
a, Co-expression of Iba1 and CCR2 on myeloid cells freshly isolated from mouse brain by CD11b beads. Representative picture of immunofluorescence staining of Iba1 (left). FACS analysis of CD11b-positive cells for CCR2 expression. b, Relative CCR2 expression in the BV2 microglia cell line compared with NIH 3T3 fibroblasts. CCR2 mRNA level was analyzed by qRT-PCR (mean ± s.e.m., t-test) (left) and protein expression was analyzed by FACS (right). c, Transwell migration assay examining the directional migration of BV2 cells toward CCL2. 105 BV2 cells were seeded in the top chamber of the transwell units and CCL2 or BSA (20ng/ml) was added into serum-free media in the bottom chamber. The migrated cell numbers were counted at 24h. Next, CCR2 antagonists with different concentrations (10uM, 1uM, 0.1uM) were added into the top chamber with BV2 cells, and CCL2 (20ng/ml) was added into serum-free media in the bottom chamber. The migrated cell numbers were counted at 24h. d, Quantification of BV2 cell migration assay (means ± s.e.m., t-test).
Extended Data Figure 9
Extended Data Figure 9. The association between PTEN, CCL2 expression and recruitment of Iba-1+ myeloid cells in patients’ brain metastases and matched primary breast tumors
a, Summary histogram of CCL2 protein levels in primary breast tumors and matched brain metastases from 35 patients. Chi-square test was used to compare IHC score in primary breast tumors versus matched brain metastases. p<0.05 is defined as significantly different. b, Tables showing IHC scores of PTEN and CCL2 expression in primary breast tumors and matched brain metastases. c, Representative IHC staining of CCL2 proteins and Iba1+ myeloid cells in patients’ brain metastases, and the correlation plot showing the Pearson correlation between CCL2 and Iba1 staining in patients’ brain metastases.
Extended Data Figure 10
Extended Data Figure 10. PTEN loss induced by astrocyte-derived exosomal microRNA primes brain metastasis outgrowth via functional cross-talk between disseminated tumor cells and brain metastatic microenvironment
Top: Disseminated tumor cells extravasate into the brain. Bottom: a-c, Exosomes secreted by astrocytes in the brain microenvironment transfer PTEN-targeting miRNA into extravasated brain metastatic tumor cells leading to PTEN down-regulation in tumor cells. c-d, PTEN loss in brain metastatic tumor cells increases their CCL2 secretion, facilitating recruitment of Iba1+/CCR2+ myeloid cells at the micrometastasis site. d-e, The recruited Iba1+ myeloid cells enhance proliferation and inhibit apoptosis of metastatic tumor cells, and promote metastatic outgrowth.
Figure 1
Figure 1. Brain microenvironment-dependent reversible PTEN down-regulation in brain metastases (Mets)
a, Representative IHC staining and histograms of PTEN protein levels in primary breast tumors and unmatched brain metastases (Chi-square test). b, Histograms of PTEN protein levels in primary breast tumors and matched brain metastases from 35 patients (Chi-square test). c, PTEN western blots (WB, left) and brain metastasis counts 30 days after intracarotid injection (right) of MDA-MB-231Br cells transfected with control or PTEN shRNAs. Large Mets: >50 μm in diameter (mean ± s.e.m., Chi-square test). d, PTEN IHC staining of tumors derived from clonally expanded of PTEN-normal sublines. ICA: intracarotid artery; MFP: mammary fat pad. e, WB and qRT-PCR of PTEN expression in the indicated parental (P) and brain-seeking (Br) cells under culture. f, Schematic of in vivo re-establishment of secondary brain metastasis, MFP tumor, and their derived cell lines. g, PTEN qRT-PCR (mean ± s.e.m., t-test) and IHC in HCC1954Br secondary tumors and cultured cells.
Figure 2
Figure 2. Astrocyte-derived miRNAs silence PTEN in tumor cells
a, PTEN mRNA in the indicated tumor cells after 2-5 days co-culture with GFAP-positive primary glia or vimentin (Vim)-positive primary cancer-associated fibroblasts (CAFs) or NIH3T3 fibroblasts (mean ± s.e.m., t-test). b, WB of PTEN protein under co-culture as in (a). c, Schematic of astrocyte-specific miR-17-92 deletion by GFAP-driven Cre adenovirus (Ad.GFAP-Cre) in Mirc1tm1.1Tyj/J mice. d, Representative image of tumor sizes and PTEN IHC of brain metastases. e, Quantification of brain metastases volume (mean ± s.d., t-test). f, PTEN 3’-UTR- luciferase activity after co-culture (mean ± s.e.m., t-test). g, qRT-PCR analyses of miR-19a and PTEN mRNA in MDA-MB-231 cells after 48 hour co-culture with primary astrocytes from Mirc1tm1.1Tyj/J mice pre-infected (48 hours) by adenovirus (Ad-βGLuc or Ad.GFP.Cre) (mean ± s.e.m., t-test). h, WB of PTEN protein in MDA-MB-231 cells co-cultured as in (g).
Figure 3
Figure 3. Intercellular transfer of PTEN-targeting miR-19a to tumor cells via astrocyte-derived exosomes
a, Intercellular transfer of miR-19a. Top: light microscopy and fluorescent images of HCC1954 cells 12 and 60 hours after co-cultured with astrocytes loaded with Cy3-labeled miR-19a. Bottom: flow cytometry analysis of Cy3-miR-19a in tumor cells 60 hours after co-culture (mean ± s.e.m., t-test). b-c, Transmission electron microscopy (b) of exosome vesicles in astrocyte-conditioned media that are confirmed by western blot for CD63, CD81, and TSG101 exosome markers released by 1 × 10⁶ of CAFs or astrocytes (c). d, Representative data showing presence of Cy3-miR-19a in HCC1954 breast cancer cells after adding exosomes purified from Cy3-miR-19a transfected astrocytes for 24 hours. Bottom panel: flow cytometry analysis of Cy3-miR-19a-positive HCC1954 cells after treatment with supernatant (without exosomes), or exosomes purified from Cy3-miR-19a-transfected astrocytes. Negative control is HCC1954 cells without treatment. Positive control is Cy3-miR-19a-transfected astrocytes. e, Histograms of miR-19a and PTEN mRNA in HCC1954 cells 48 hours after addition of media, astrocyte supernatant, or exosomes purified from astrocyte-conditioned media (mean ± s.e.m., t-test). f-g, Histograms of miR-19a and PTEN mRNA in HCC1954 cells after 48 hour co-culture in conditioned media from vehicle- or DMA-treated (4 hours) astrocytes (f) and control- or Rab27a-siRNA- transfected (48 hours) astrocytes (g) (mean ± s.e.m., t-test). h–j, Schematics of in vivo experiments (h), IHC analyses of PTEN and exosome marker expression (i) and changes of tumor volume (j) (mean ± s.d., t-test). k-m, Schematics showing in vivo rescue of exosome effect by pre-incubation of tumor cells with astrocyte-derived exosomes (k), IHC analyses of PTEN and exosome marker expression (l) and changes of tumor volume (m) (mean ± s.d., t-test).
Figure 4
Figure 4. Brain-dependent PTEN-loss instigates metastatic microenvironment to promote metastatic cell outgrowth
a, Prolonged mouse survival by restoration of PTEN expression. Upper: dox-inducible RFP (left) and PTEN expression (right) in 231Br cells. Middle: schematics of brain metastasis assay with dox-induced RFP or PTEN expression. Lower: overall survival of mice bearing brain metastases of 231Br cells with induced PTEN re-expression or RFP expression (Log-Rank test). b, Cytokine array of 231Br cells with dox-induced RFP or PTEN expression. c, Overall survival of mice bearing brain metastases of 231Br cells transfected with control or CCL2 shRNAs (Log-Rank test). d, WB analysis of NF-κB p65 nuclear translocation after knocking down PTEN. e, Histogram showing CCL2 mRNA level after PTEN knockdown detected by qPCR (mean ± s.e.m., t-test). f, Light and fluorescent microscopy images and quantification of mCherry-labeled tumor cells with or without BV2 microglia co-culture under 2-day serum starvation (mean ± s.e.m., t-test). g, FACS analyses of AnnexinV+ apoptotic zsGreen-labeled 231Br cells under doxorubicin treatment with or without BV2 microglia co-culture (mean ± s.e.m., t-test). h, Immunofluorescence (IF) staining of Iba1+ myeloid cells in brain metastases of 231Br cells containing control or CCL2 shRNAs (mean ± s.e.m., t-test). i-j, IHC analyses showing decreased proliferation (i: Ki-67) and increased apoptosis (j: TUNEL staining) in brain metastases after shRNA-mediated CCL2 knockdown in vivo (mean ± s.e.m., t-test). k: PTEN and CCL2 expression in matched primary breast tumors and brain metastases. Left: representative IHC staining of PTEN and CCL2. Right: quantification of PTEN and CCL2 expression in 35 cases of matched primary breast tumors and brain metastases (mean ± s.d.).

Comment in

References

    1. Quail DF, Joyce JA. Microenvironmental regulation of tumor progression and metastasis. Nat. Med. 2013;19:1423–1437. - PMC - PubMed
    1. Park ES, et al. Cross-species hybridization of microarrays for studying tumor transcriptome of brain metastasis. Proc. Natl. Acad. Sci. 2011;108:17456–17461. - PMC - PubMed
    1. Joyce JA, Pollard JW. Microenvironmental regulation of metastasis. Nat. Rev. Cancer. 2009;9:239–252. - PMC - PubMed
    1. Vanharanta S, Massagué J. Origins of Metastatic Traits. Cancer Cell. 2013;24:410–421. - PMC - PubMed
    1. Gray J. Cancer: Genomics of metastasis. Nature. 2010;464:989–990. - PubMed

Publication types

MeSH terms