Review
. 2015 Nov;17(11):1484-96.
doi: 10.1038/ncb3255. Epub 2015 Oct 19.

6-Phosphogluconate dehydrogenase links oxidative PPP, lipogenesis and tumour growth by inhibiting LKB1-AMPK signalling

Affiliations
Review

6-Phosphogluconate dehydrogenase links oxidative PPP, lipogenesis and tumour growth by inhibiting LKB1-AMPK signalling

Ruiting Lin et al. Nat Cell Biol. 2015 Nov.

Abstract

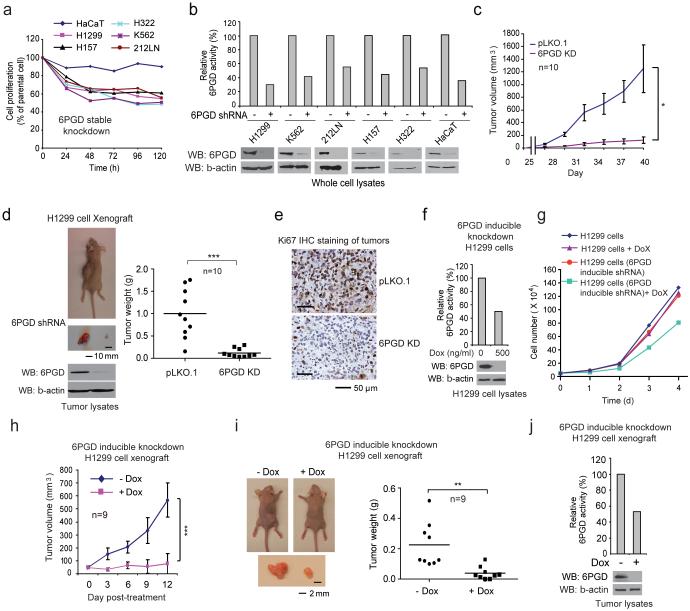
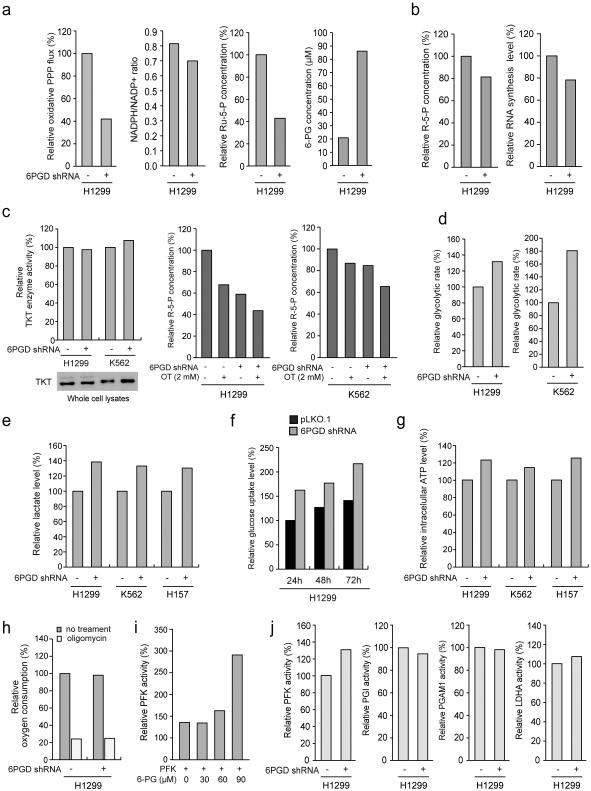
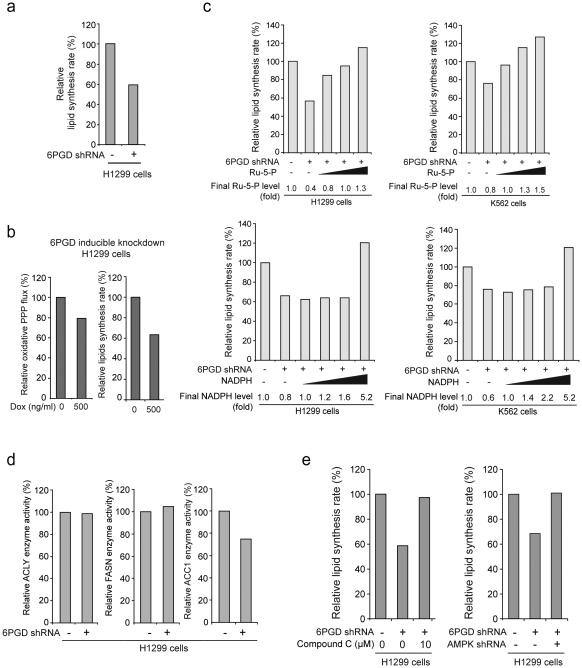
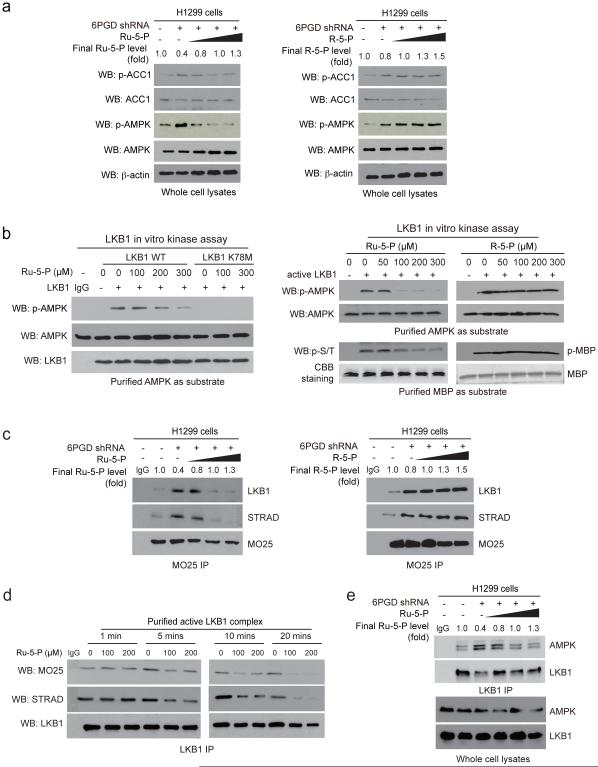
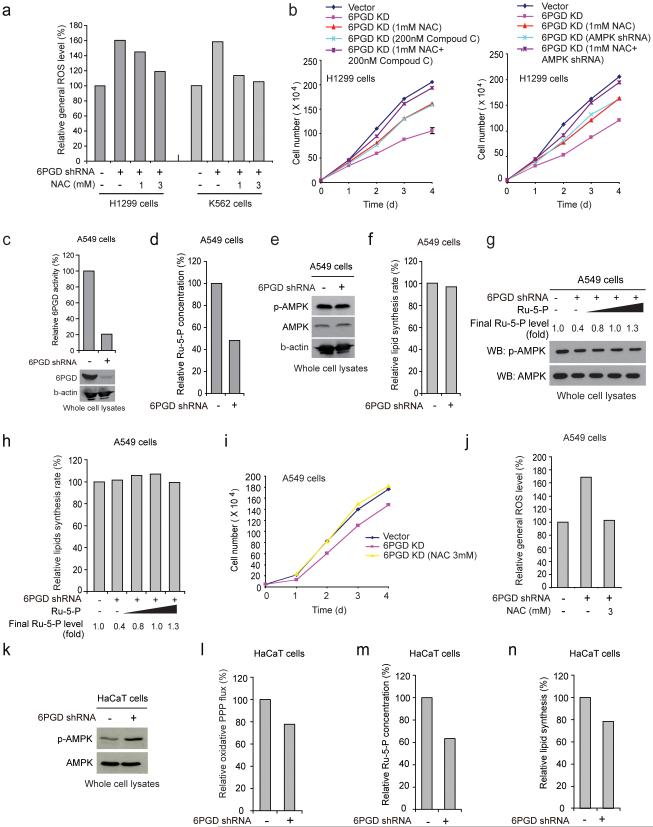
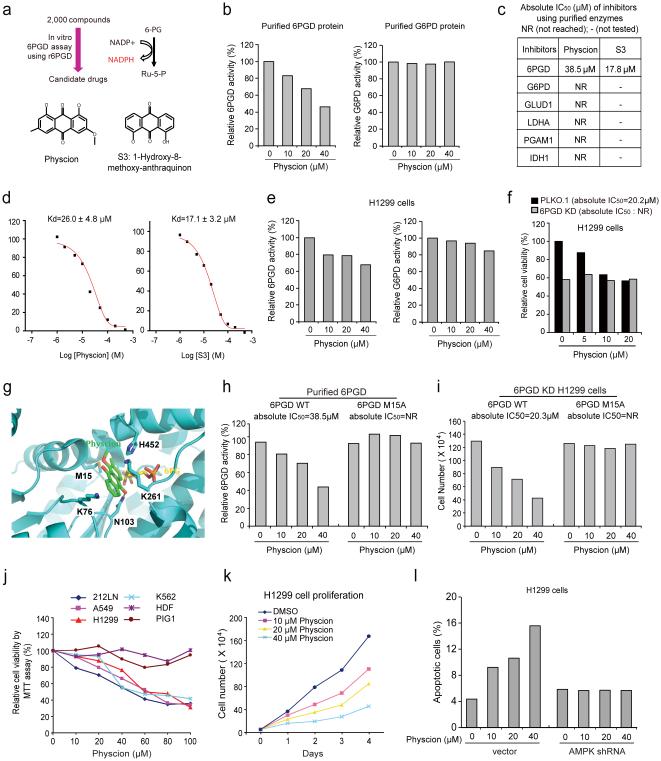
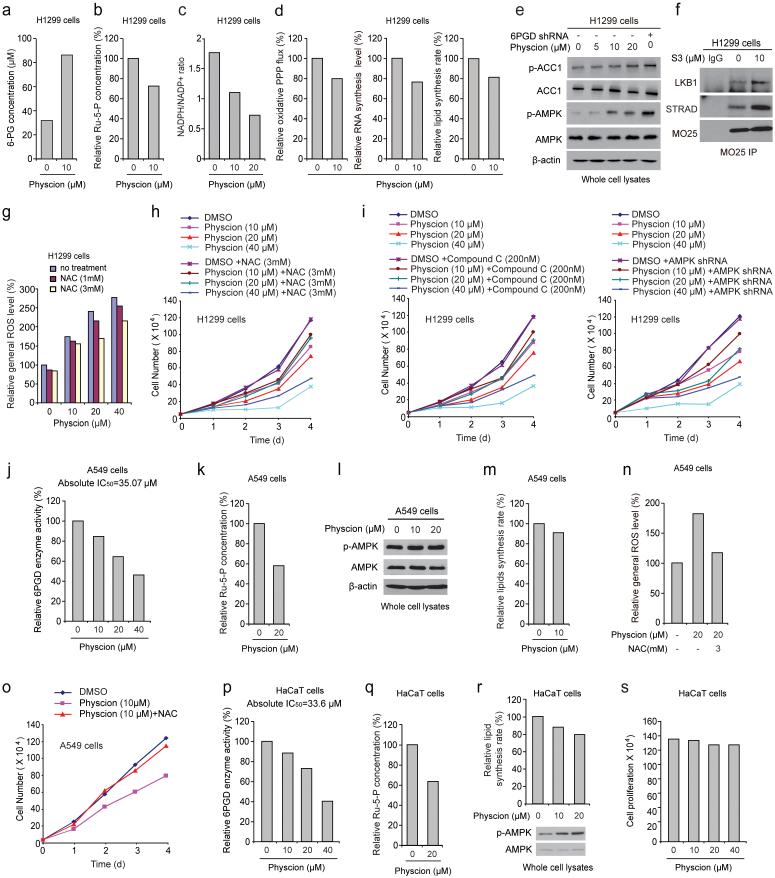
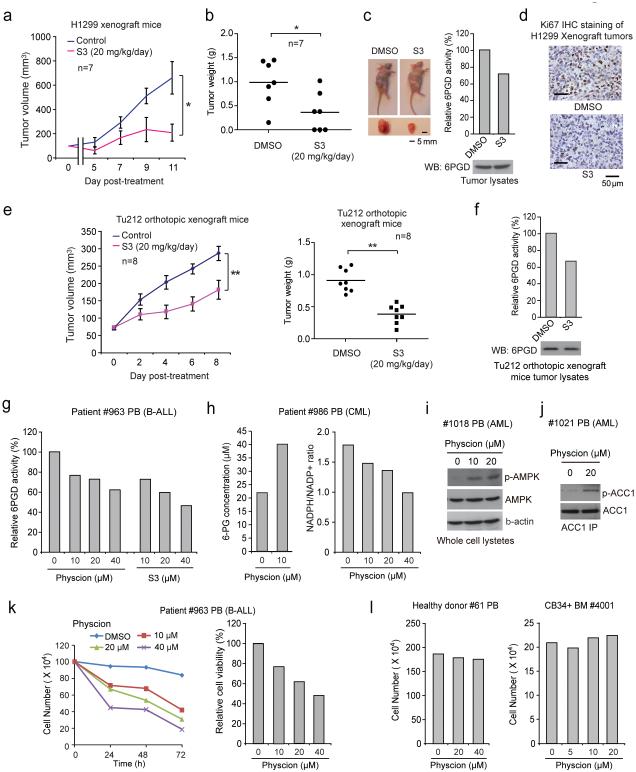
The oxidative pentose phosphate pathway (PPP) contributes to tumour growth, but the precise contribution of 6-phosphogluconate dehydrogenase (6PGD), the third enzyme in this pathway, to tumorigenesis remains unclear. We found that suppression of 6PGD decreased lipogenesis and RNA biosynthesis and elevated ROS levels in cancer cells, attenuating cell proliferation and tumour growth. 6PGD-mediated production of ribulose-5-phosphate (Ru-5-P) inhibits AMPK activation by disrupting the active LKB1 complex, thereby activating acetyl-CoA carboxylase 1 and lipogenesis. Ru-5-P and NADPH are thought to be precursors in RNA biosynthesis and lipogenesis, respectively; thus, our findings provide an additional link between the oxidative PPP and lipogenesis through Ru-5-P-dependent inhibition of LKB1-AMPK signalling. Moreover, we identified and developed 6PGD inhibitors, physcion and its derivative S3, that effectively inhibited 6PGD, cancer cell proliferation and tumour growth in nude mice xenografts without obvious toxicity, suggesting that 6PGD could be an anticancer target.


Figures

Fig. 1
Fig. 1
6PGD is important for cancer cell proliferation and tumor growth. (a-b) Cell proliferation rates determined by cell counting (a) and 6PGD activity (b; upper) in diverse human cancer cells with 6PGD stable knockdown (b; lower), which were normalized to the corresponding control vector cells. Keratinocyte HaCaT cells were included as controls. (c) Tumor growth was compared between xenograft nude mice injected with 6PGD KD H1299 cells and control vector cells. (d) Left: Dissected tumors in a representative nude mouse are shown. Scale bar represents 10 mm. Right: Tumor mass in xenograft nude mice injected with 6PGD KD H1299 cells compared to mice injected with the control vector cells. (e) Representative images of IHC staining of Ki-67 from xenograft mice injected with control vector or 6PGD KD H1299 cells. Scale bars indicate 50 μM. (f) 6PGD activity (upper) and protein expression (lower) in H1299 cells with inducible knockdown of 6PGD in the presence and absence of doxycycline (Dox). (g) Cell proliferation rates determined by cell counting in H1299 cells with inducible 6PGD knockdown and control cells in the presence and absence of Dox. (h) Tumor growth was compared between xenograft mice injected with H1299 cells with inducible 6PGD knockdown fed with drinking water in the presence or absence of Dox. (i-j) Dissected tumors in two representative nude mice (i; left) and tumor mass of xenograft mice injected with H1299 cells with inducible 6PGD knockdown (i; right) fed with drinking water in the presence or absence of Dox are shown. Scale bars represent 2 mm. 6PGD activity (upper) and protein expression (lower) in tumor lysates are shown (j). (a-g, and j) Data are from a single experiment that is representative of 2 independent experiments for (a) and 3 independent experiments for (b-g, and j). Source data for independently repeated experiments are provided in Supplementary Table 1. (c) Mean ± S.E.M.; n=10 tumors from 10 mice, (d) n=10 tumors from 10 mice; centerlines represent means, (h) Mean ± S.E.M.; n=9 tumors from 9 mice, (i) n=9 tumors from 9 mice; centerlines represent means. The P values were determined by two-sided unpaired Student’s t-test for (c, h, and i) and paired two-sided Student’s t-test for (d) (*: 0.01<p<0.05; **: 0.001<p<0.01; ***: p<0.001). (a-g, j). Source data for independent replications and experiments with sample size<5 are available in Supplementary Table 1. Uncropped Western blots are provided in Supplementary Figure 9.
Fig. 2
Fig. 2
6PGD contributes to regulation of oxidative PPP and glycolysis. (a) 6PGD KD and control cells harboring an empty vector were tested for oxidative PPP flux and NADPH/NADP+ ratio (left panels), and intracellular levels of Ru-5-P and 6-PG (right panels). (b) 6PGD KD H1299 cells and control vector cells were tested for intracellular R-5-P levels (b; left) and RNA biosynthesis (b; right). (c) Left: H1299 and K562 cells with stable knockdown of 6PGD were tested for transketolase (TKT) protein expression (lower) and enzyme activity (upper) levels. Right: H1299 and K562 cells with stable knockdown of 6PGD were tested for intracellular R-5-P levels in the presence and absence of TKT inhibitor oxythiamine (OT). (d-g) 6PGD KD and vector control cells were tested for glycolytic rate (d), lactate production (e), glucose uptake rate (f) and intracellular ATP level (g). (h) 6PGD KD H1299 cells and control vector cells were tested for oxygen consumption rate in the presence or absence of 100 nM oligomycin (ATP synthase inhibitor). (i) H1299 cell lysates were incubated with increasing concentrations of 6-PG, followed by in vitro PFK enzyme activity assay. PFK activities were normalized to the control sample without 6-PG treatment. (j) 6PGD KD and control vector H1299 cells were tested for activity of glycolytic enzymes including PFK, PGI, PGAM1 and LDHA. (a-j) Data are from a single experiment that is representative of 2 independent experiments for (a, g; middle, and h-j), 3 independent experiments for (b-d, and f), and 4 independent experiments for (e and g; left and right). Source data for independent replications and experiments with sample size<5 are available in Supplementary Table 1. Uncropped Western blots are provided in Supplementary Figure 9.
Fig. 3
Fig. 3
6PGD contributes to lipogenesis through regulation of AMPK and ACC1 activity. (a) 6PGD KD and control cells harboring an empty vector were tested for lipogenesis. (b) H1299 cells with inducible knockdown of 6PGD were tested for oxidative PPP flux (left) and lipogenesis (right) in the presence and absence of Dox. (c) Cell lysates from 6PGD KD H1299 and K562 cells were treated with increasing concentrations of Ru-5-P (upper panels) or NADPH (lower panels) for 12 hours, followed by lipid biosynthesis assay. Final levels (fold) of Ru-5-P and NADPH were normalized to the control vector cells without treatment with Ru-5-P or NADPH, respectively. Lipid biosynthesis rates (%) were normalized to the control vector cells without treatment with Ru-5-P (upper) or NADPH (lower). (d) 6PGD KD cells and control vector H1299 cells were tested for enzyme activity of ACLY (left), FASN (middle) and ACC1 (right). Enzyme activities were normalized to the control vector cells. (e) Cell lysates from 6PGD KD H1299 cells were treated with or without AMPK inhibitor Compound C (10 μM) for 12 hours (left) and 6PGD stable KD cells were infected with lentivirus harboring AMPK shRNA (right). The samples were applied to lipid biosynthesis assay. (a-e) Data are from a single experiment that is representative of 3 independent experiments for (a and c) and 2 independent experiments for (b and d-e). Source data for independent replications and experiments with sample size<5 are available in Supplementary Table 1. Uncropped Western blots are provided in Supplementary Figure 9.
Fig. 4
Fig. 4
Ru-5-P inhibits LKB-AMPK pathway by disrupting active LKB1 complex. (a) Cell lysates from 6PGD KD H1299 cells were treated with increasing concentrations of Ru-5-P (left) or R-5-P (right) for 4 hours, followed by Western blot for phosphorylation levels of AMPK (pT172) and ACC1 (pS79). Final levels (fold) of Ru-5-P or R-5-P were normalized to the control vector cells without treatment. (b) In vitro LKB1 kinase assays were performed using LKB1 wild type (WT) or a kinase dead form (K78M) purified from A549 cells (left panel) or LKB1 WT purified from H1299 cells (right panel) incubated with recombinant AMPK (left and upper right) or MBP (lower right) as substrates in the presence of increasing concentrations of Ru-5-P (left), or Ru-5-P or R-5-P (right) at 37 °C for 20 minutes. Samples were applied for Western blot. (c) Cell lysates of 6PGD KD H1299 cells were incubated with increasing concentrations of Ru-5-P (left) or R-5-P (right), followed by immunoprecipitation of MO25 and Western blot to detect co-immunoprecipiated LKB1 and STRAD. (d) Purified active LKB1 complex purchased from Upstate (Millipore) were incubated with Ru-5-P (100 or 200 μM) for indicated time points, followed by immunoprecipitation of LKB1 and Western blot to detect co-immunoprecipiated MO25. (e) Cell lysates of 6PGD KD H1299 cells were incubated with increasing concentrations of Ru-5-P, followed by immunoprecipitation of LKB1 and Western blot to detect co-immunoprecipiated AMPK. (a-e) Results of one representative experiment from at 2 independent experiments (a-b) and 3 independent experiments (c-e) are shown. Uncropped Western blots are provided in supplementary Figure 9.
Fig. 5
Fig. 5
6PGD controls Ru-5-P level to regulate LKB1-AMPK signaling and subsequently ACC1 activity and lipogenesis. (a) 6PGD KD H1299 (left) and K562 (right) cells were assayed for general ROS levels in the absence and presence of NAC (1 and 3 mM) by measuring intracellular ROS-mediated DCFDA oxidation to fluorescent DCF by flow cytometry. The relative general ROS levels were normalized to the control vector cells without NAC treatment. (b) Cell proliferation rates were determined by cell counting in 6PGD KD H1299 cells treated with either or both NAC and Compound C (left) or 6PGD KD cells treated with either or both AMPK shRNA and NAC (right). (c-f) LKB1-deficient A549 cells with 6PGD knockdown (c) and control vector cells were assayed for intracellular Ru-5-P levels (d), phosphorylation levels of AMPK (e), and lipogenesis (f). (g-h) Cell lysates from 6PGD KD A549 cells were treated with increasing concentrations of Ru-5-P, followed by Western blot for phosphorylation levels of AMPK (g) or lipogenesis assay (h). Final levels (fold) of Ru-5-P were normalized to the control vector cells without treatment. (i-j) A549 vector and 6PGD knockdown cells were tested for cell proliferation rate by cell counting (i) and ROS level (j) in the presence or absence of NAC (3 mM). (k-n) Normal proliferating HaCaT vector and 6PGD knockdown cells were assayed for phosphorylation levels of AMPK (k), oxidative PPP flux rate (l), intracellular Ru-5-P levels (m), and lipogenesis (n). (a-n) Data are from a single experiment that is representative of 3 independent experiments for (a, c, e, g) and 2 independent experiments for (b, d, f, h-n). Source data for independent replications and experiments with sample size<5 are available in Supplementary Table 1. Uncropped Western blots are provided in Supplementary Figure 9.
Fig. 6
Fig. 6
Identification of Physcion and its derivative S3 as 6PGD inhibitors (a) Upper: Screening strategy for lead compounds as 6PGD inhibitors. Lower: Structure of Physcion and its derivative S3. (b) Purified 6PGD (left) and G6PD (right) were assayed for 6PGD and G6PD activity, respectively, in the presence of Physcion. (c) Absolute IC50 values of Physcion and S3 were determined in activity assays using purified enzymes. (d) Kd values were determined for Physcion or S3 binding to purified human 6PGD proteins. The fluorescence intensity (Ex: 280nm, Em: 350nm) was measured . (e-f) Physcion-treated H1299 cells were assayed for 6PGD (e; left) and G6PD (e; right) activity, and cell viability (f). (g) Schematic representation of molecular docking study of Physcion based on the crystal structure of 6PGD (PDB code: 3FWN) in complex with its substrate 6-PG. Physcion (green) is docked in a pocket near the binding site of 6-PG (yellow) that is surrounded by residues including M15, K76, K261 and H452. (h) Purified 6PGD WT (left) and M15A mutant (right) were treated with Physcion and assayed for 6PGD activity. Absolute IC50 values are shown; NR=not reached. (i) H1299 6PGD knockdown cells were transfected with 6PGD WT (left) and M15A mutant (right), followed by cell proliferation assay based on cell numbers in the presence of Physcion. (j) Cell viability of Physcion-treated human cancer cells were determined by MTT assay. Normal proliferating human dermal fibroblasts (HDF) and melanocyte PIG1 cells were included as controls. (k) Cell proliferation rates of H1299 cells treated with Physcion were determined. (l) Apoptotic cell death (48 hours) of H1299 cells harboring AMPK shRNA or an empty vector in the presence of Physcion were determined by annexin V staining. Data are from a single experiment that is representative of 3 independent experiments for (b, e, h), 2 independent experiments for (f, i, l), and 4 independent experiments for (j-k). Source data for independent replications and experiments with sample size<5 are available in Supplementary Table 1. Uncropped Western blots are provided in Supplementary Figure 9.
Fig. 7
Fig. 7
6PGD inhibitor Physcion inhibits cancer cell metabolism and proliferation. (a-d) H1299 cells were assayed for intracellular concentration of 6-PG (a) and Ru-5-P (b), NADPH/NADP+ ratio (c), as well as oxidative PPP flux and biosynthesis of RNA and lipids (d) in the presence and absence of Physcion. (e) H1299 cells were treated with increasing concentrations of Physcion, followed by Western blot to detect phosphorylation levels of ACC1 (pS79; upper) and AMPK (pT172; lower). 6PGD KD cells were included as a control. (f) Cell lysates of S3-treated H1299 cells were used for immunoprecipitation of MO25 and Western blot to detect co-immunoprecipiated LKB1 and STRAD. (g-h) H1299 cells treated with or without Physcion were assayed for general ROS levels (g) and cell proliferation rates by cell counting (h) in the presence and absence of NAC. (i) H1299 cells treated with or without Physcion were assayed for cell proliferation rates by cell counting in the presence and absence of Compound C (left) or lentivirus harboring AMPK shRNA (right). (j-o) Effects of treatment with Physcion on LKB1-deficient A549 cells were assayed for 6PGD activity (j), intracellular Ru-5-P levels (k), phosphorylation levels of AMPK (l) and lipid biosynthesis (m), as well as general ROS levels (n) and cell proliferation rates by cell counting (o) in the presence and absence of NAC. (p-s) Effects of Physcion treatment on normal proliferating HaCaT cells were assayed for 6PGD activity (p), intracellular Ru-5-P levels (q), phosphorylation levels of AMPK and lipid biosynthesis (r), as well as cell proliferation rates by cell counting (s). (a-s) Data are from a single experiment that is representative of 3 independent experiments for (b-c, e) and 2 independent experiments for (a, d, f-s). Source data for independent replications and experiments with sample size<5 are available in Supplementary Table 1. Uncropped Western blots are provided in Supplementary Figure 9.
Fig. 8
Fig. 8
6PGD inhibitors effectively attenuate tumor growth in xenograft mice and cell proliferation of human primary leukemia cells. (a-b) Tumor growth curve (a) and tumor mass (b) in H1299-xenograft mice treated with S3 or DMSO. (c) Left: Dissected tumors in representative mice treated with DMSO or S3 are shown. Scale bar represents 5 mm. Right: 6PGD enzyme activity in tumor lysates of H1299 xenograft mice treated with DMSO or S3 is shown. (d) Representative images of IHC staining of Ki-67 from H1299 xenograft mice treated with DMSO or S3 are shown. Scale bars indicate 50 μM. (e-f) Tumor growth curve (e; left) and tumor mass (e: right) in orthotopic xenograft nude mice injected with Tu212 cells treated with S3 or DMSO. 6PGD activity (upper) and protein (lower) levels in tumor lysates are shown (f). (g) 6PGD activity in Physcion- or S3-treated human primary leukemia cells isolated from PB samples from a representative B-ALL patient. (h) 6-PG levels (left) and NADPH/NADP+ ratio (right) in Physcion-treated human primary leukemia cells from a representative CML patient. (i-j) AMPK (pT172; i) and ACC1 (pS79; j) phosphorylation levels were examined by immunoblotting using Physcion-treated human primary leukemia cells isolated from PB samples from representative AML patients. (k) Cell proliferation (left) and viability (right) in Physcion-treated human primary leukemia cells isolated from PB samples from a representative B-ALL patient. (l) Physcion shows no toxicity in treatment (72h) of peripheral blood cells (left) and CD34+ cells isolated from bone marrow samples (right) from representative healthy human donors. PB: peripheral blood; BM: bone marrow; B-ALL: Acute B Lymphoblastic Leukemia; AML: Acute Myeloid Leukemia. (a) Mean ± S.E.M.; n=7 tumors from 7 mice, (b) n=7 tumors from 7 mice; centerlines represent means, (e) Mean ± S.E.M.; n=8 tumors from 8 mice; centerlines represent means. The P values were determined by two-sided unpaired Student’s t-test for (b and e) (ns: not significant; *: 0.01<p<0.05; **: 0.001<p<0.01) (a-c, f) Data are from a single experiment that is representative of 2 independent experiments. Source data for independent replications and experiments with sample size<5 are available in Supplementary Table 1. Uncropped Western blots are provided in Supplementary Figure 9.

Similar articles

Cited by

References

    1. Warburg O. On the origin of cancer cells. Science. Science. Science. Science. Science. 1956;123:309–314. - PubMed
    1. Cairns RA, Harris IS, Mak TW. Regulation of cancer cell metabolism. Nature reviews. Cancer. 2011;11:85–95. - PubMed
    1. Kroemer G, Pouyssegur J. Tumor cell metabolism: cancer's Achilles' heel. Cancer Cell. 2008;13:472–482. - PubMed
    1. Christofk HR, et al. The M2 splice isoform of pyruvate kinase is important for cancer metabolism and tumour growth. Nature. 2008;452:230–233. - PubMed
    1. Hitosugi T, et al. Phosphoglycerate mutase 1 coordinates glycolysis and biosynthesis to promote tumor growth. Cancer Cell. 2012;22:585–600. - PMC - PubMed

Publication types

MeSH terms

Substances