. 2015 Dec;17(12):1577-1587.
doi: 10.1038/ncb3257. Epub 2015 Oct 19.

Definition of a consensus integrin adhesome and its dynamics during adhesion complex assembly and disassembly

Affiliations

Definition of a consensus integrin adhesome and its dynamics during adhesion complex assembly and disassembly

Edward R Horton et al. Nat Cell Biol. 2015 Dec.

Abstract

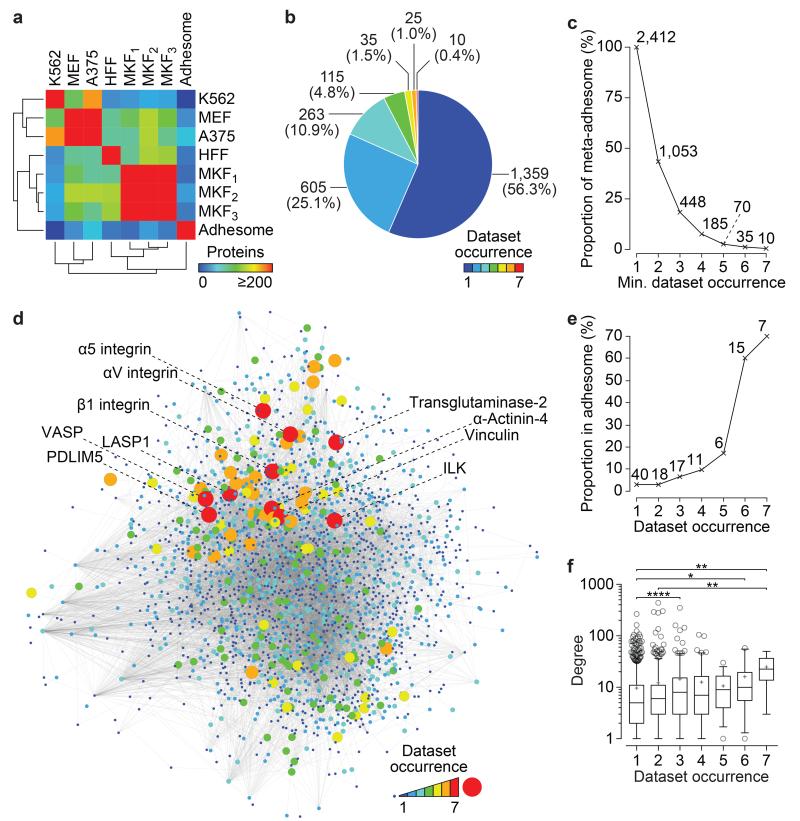
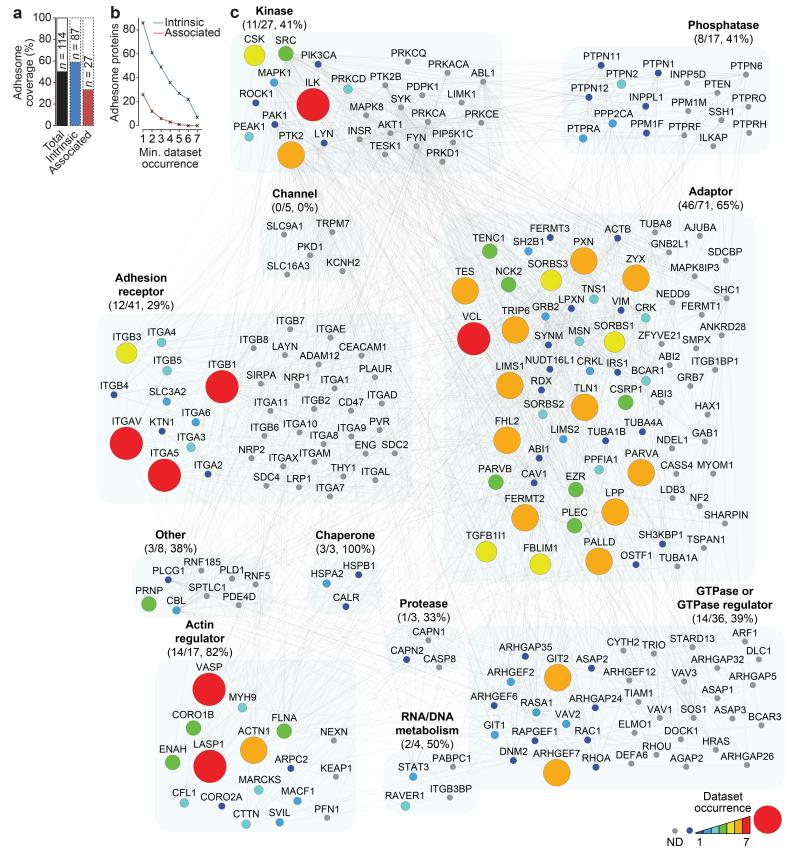
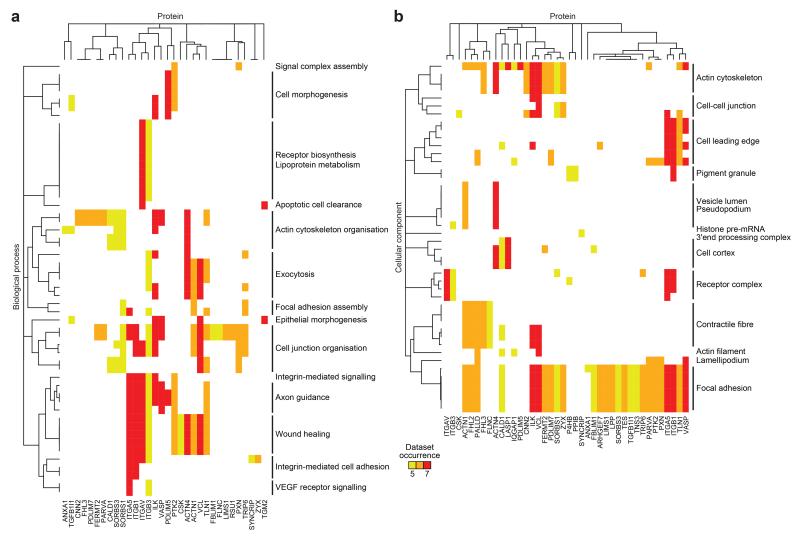
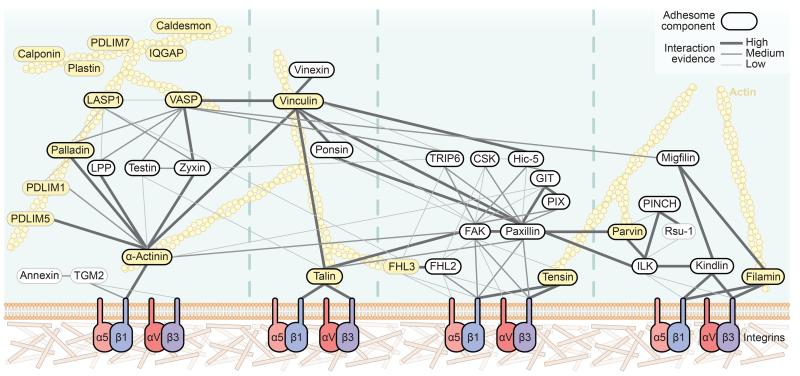
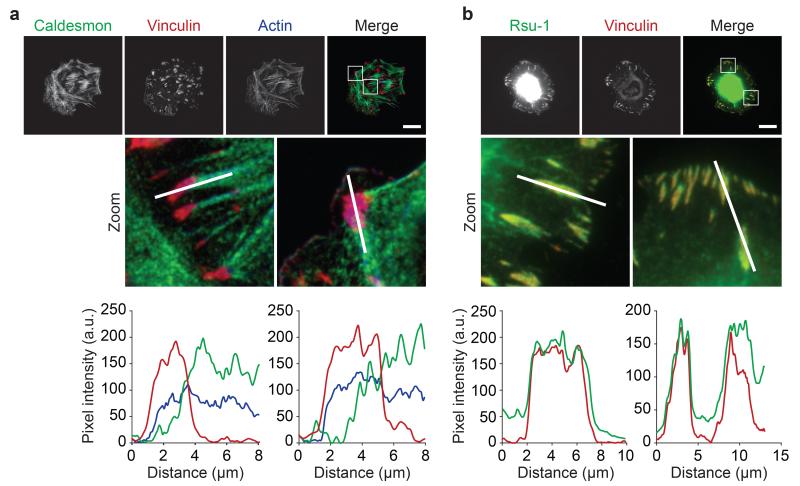
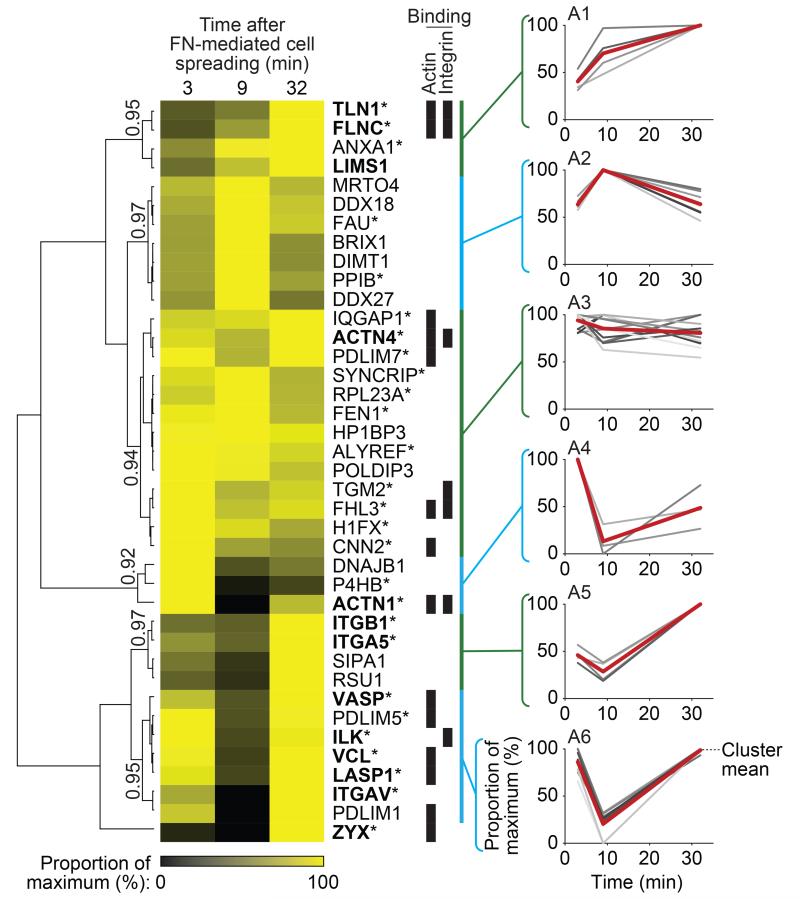
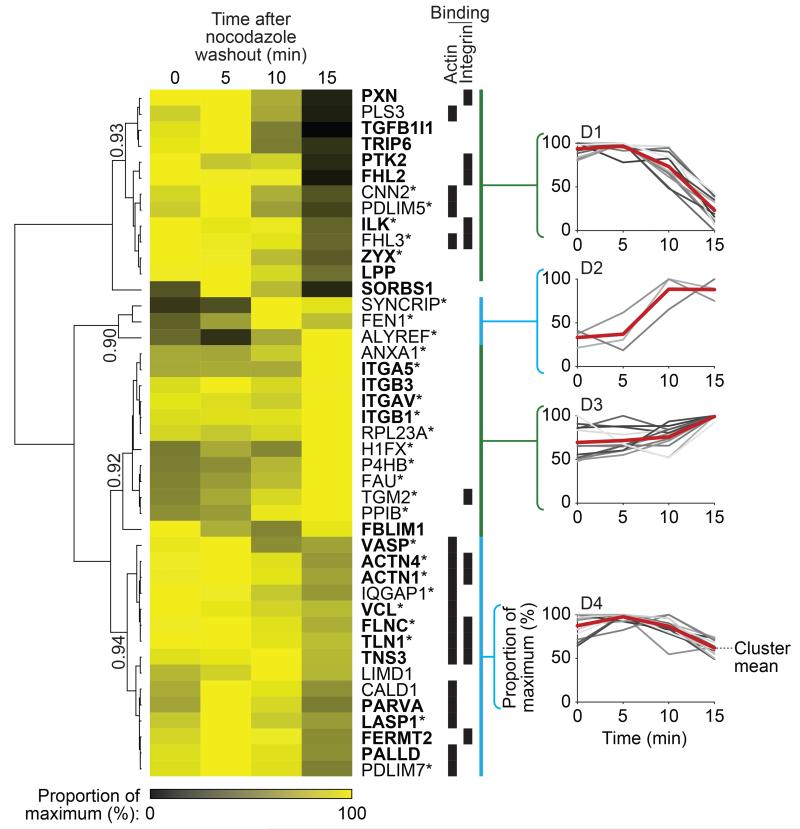
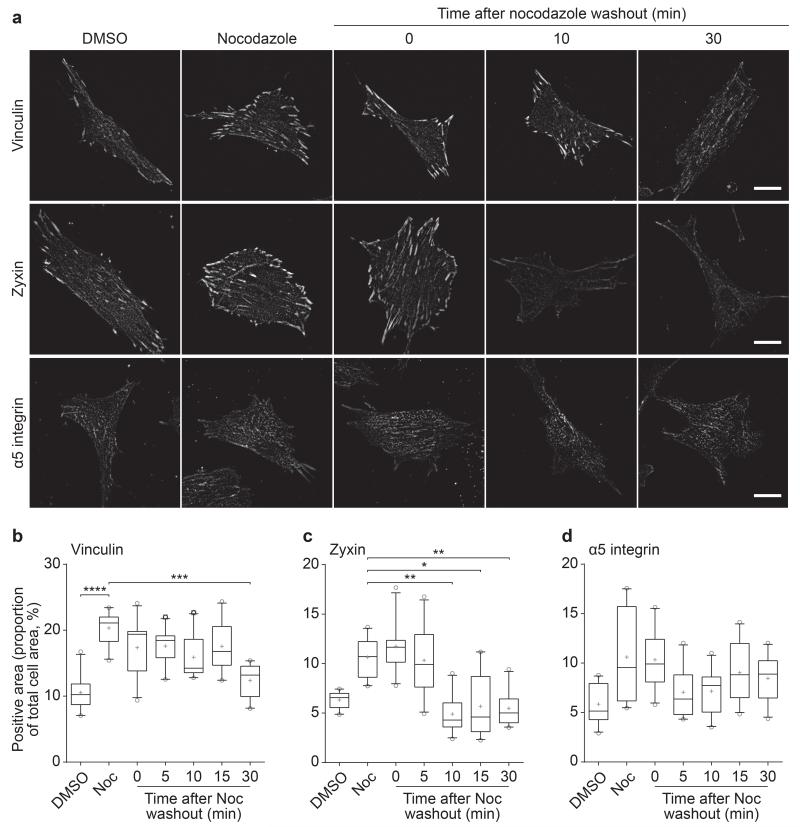
Integrin receptor activation initiates the formation of integrin adhesion complexes (IACs) at the cell membrane that transduce adhesion-dependent signals to control a multitude of cellular functions. Proteomic analyses of isolated IACs have revealed an unanticipated molecular complexity; however, a global view of the consensus composition and dynamics of IACs is lacking. Here, we have integrated several IAC proteomes and generated a 2,412-protein integrin adhesome. Analysis of this data set reveals the functional diversity of proteins in IACs and establishes a consensus adhesome of 60 proteins. The consensus adhesome is likely to represent a core cell adhesion machinery, centred around four axes comprising ILK-PINCH-kindlin, FAK-paxillin, talin-vinculin and α-actinin-zyxin-VASP, and includes underappreciated IAC components such as Rsu-1 and caldesmon. Proteomic quantification of IAC assembly and disassembly detailed the compositional dynamics of the core cell adhesion machinery. The definition of this consensus view of integrin adhesome components provides a resource for the research community.


Figures

Figure 1
Figure 1
Overlap and comparison of IAC proteomes in the meta-adhesome. (a) Pairwise overlaps of FN-enriched proteins identified in the seven proteomic datasets and the literature-curated adhesome are displayed as a hierarchically clustered heatmap. K562, human chronic myelogenous leukaemia cells; MEF, mouse embryonic fibroblast cells (this study); A375, human malignant melanoma cells; HFF, human foreskin fibroblast cells; MKF1, mouse kidney fibroblast cells; MKF2 and MKF3, mouse kidney fibroblast cells. Details of the proteomic datasets are provided in Supplementary Table 1. (b) The number of proteomic datasets in which proteins in the meta-adhesome are identified (dataset occurrence) is displayed as a pie chart. Numbers of proteins identified are indicated for each segment (proportions of the meta-adhesome are shown in parentheses). (c) Line graph showing the cumulative proportion of the meta-adhesome in at least x proteomic datasets, where x is the minimum (min.) dataset occurrence category. Numbers of proteins identified are indicated for each data point. (d) Protein-protein interaction network model of the meta-adhesome. The 2,412 meta-adhesome proteins were mapped onto a curated database of reported protein-protein interactions. The largest connected graph component is displayed, comprising 11,430 interactions (grey lines; edges) between 2,035 proteins (circles; nodes). Node size and colour are proportional to the number of proteomic datasets in which a protein was identified. Locations of proteins identified in all seven datasets are indicated. (e) Line graph showing the proportion of identified proteins that are in the literature-curated adhesome. Numbers of literature-curated adhesome proteins identified are indicated for each data point. (f) The number of reported protein-protein interactions (degree) for each protein is plotted according to the number of proteomic datasets in which it was identified. Box-and-whisker plot shows the median (line), mean (plus sign), 25th and 75th percentiles (box) and 5th and 95th percentiles (whiskers) (n = 1,117, 518, 238, 102, 33, 25 and 10 mapped proteins identified in 1–7 datasets, respectively, with degree ≥ 1). *P < 0.05, **P < 0.01, ****P < 0.0001; Kruskal–Wallis test with Dunn’s post hoc correction (see Supplementary Table 15 for statistics source data).
Figure 2
Figure 2
Meta-adhesome coverage of the literature-curated adhesome. (a) The proportion of the literature-curated adhesome identified in the meta-adhesome is plotted as a percentage bar chart. Proportions of the total literature-curated adhesome (black), intrinsic adhesome components (blue) and associated adhesome components (red) are shown. Numbers of identified proteins are indicated. (b) Line graph showing the cumulative number of literature-curated adhesome proteins identified in at least x proteomic datasets, where x is the minimum (min.) dataset occurrence category. Data for intrinsic (blue) and associated (red) adhesome components are shown. (c) Protein-protein interaction network of the literature-curated adhesome proteins identified in the meta-adhesome. Node size and colour are proportional to the number of proteomic datasets in which a protein was identified; ND, not detected (grey node). Nodes are clustered according to literature-curated adhesome functions; numbers (meta-adhesome/literature-curated adhesome total) and proportions of each functional category identified in the meta-adhesome are indicated in parentheses. Nodes are labelled with gene names for clarity (see Supplementary Table 3 for details).
Figure 3
Figure 3
Functional enrichment map of the consensus integrin adhesome. (a,b) Overrepresented biological process (a) and cellular component (b) terms from proteins identified in the consensus adhesome were hierarchically clustered according to proteomic dataset occurrence. This identified clusters of similarly detected proteins associated with a similar set of functional terms. Related terms are summarised (black bars). Proteins are labelled with gene names for clarity (see Supplementary Table 4 for details).
Figure 4
Figure 4
Curated network model of the consensus integrin adhesome. Protein-protein interaction network of the consensus adhesome. Interactions were manually validated and scored (high, medium, low) according to the level of experimental evidence for that interaction, shown by the thickness and saturation of the grey edges (see Supplementary Table 6). Thick black node border indicates literature-curated adhesome protein. Yellow node indicates actin-binding protein. The specific isoforms and subunits of proteins identified are detailed in Supplementary Table 4 by gene name. For clarity, α-actinin is depicted as one node, even though two α-actinin isoforms (α-actinin-1 and -4) were identified. Actin is depicted for illustrative purposes but was not present in the consensus adhesome. The network comprised 41 proteins with 92 interactions, excluding actin binding. Unconnected components or components with only one low-evidence interaction are not shown in the network; proteins unconnected to the main network were ALYREF, BRIX1, DDX18, DDX27, DIMT1, DNAJB1, FAU, FEN1, H1FX, HP1BP3, LIMD1, MRTO4, POLDIP3, RPL23A, SIPA1 and SYNCRIP; proteins connected to the network with a single low-evidence interaction were P4HB and PPIB.
Figure 5
Figure 5
Caldesmon and Rsu-1 localisation in IACs. (a,b) U2OS cells were spread on FN for 2 h and visualised using antibodies against caldesmon (green) (a) and Rsu-1 (green) (b). IACs were visualised by immunofluorescence staining for vinculin (red) and the actin cytoskeleton was visualised by staining with fluorophore-conjugated phalloidin (blue). Graphs show fluorescence intensity values for each channel across line segments in corresponding zoomed areas above each graph. In addition, colocalisation with vinculin-positive areas was quantified for caldesmon (MOC = 0.51 ± 0.19) and Rsu-1 (MOC = 0.98 ± 0.03). Values are mean ± s.d. (n = 20 cells from one independent experiment; see Supplementary Table 15 for source data). Scale bars, 20 μm.
Figure 6
Figure 6
Temporal profiling of the consensus adhesome during IAC assembly. IACs were isolated from K562 cells in biological duplicate after 3, 9 and 32 min incubation with FN-coated beads and analysed by MS (data are from 2 independent experiments; see Supplementary Table 11). Throughout IAC assembly, 39 of the 60 consensus adhesome proteins were identified and were analysed by unsupervised hierarchical clustering, revealing distinct temporal profiles of protein recruitment to IACs. Six clusters, labelled A1–6, were chosen on the basis of a Pearson correlation threshold greater than 0.9 and are indicated by blue and green bars. Clusters are shown alongside corresponding profile plots, with the mean temporal profile for each cluster indicated by a red line. Quantitative heat map displays mean spectral counts as a proportion of the maximum spectral count for each given protein. Proteins are labelled with gene names for clarity. Proteins also identified during IAC disassembly (Fig. 7, Supplementary Table 12) are indicated by an asterisk. Literature-curated adhesome proteins and their isoforms are in bold. Proteins able to bind actin or integrin are indicated by black bars.
Figure 7
Figure 7
Temporal profiling of the consensus adhesome during IAC disassembly. IACs were isolated from U2OS cells in biological triplicate upon nocodazole removal and 5, 10 and 15 min after nocodazole washout to examine changes in IAC composition throughout IAC disruption. Isolated IACs at each time point were analysed by MS (data are from 3 independent experiments; see Supplementary Table 12). Throughout IAC disassembly, 43 of the 60 consensus adhesome proteins were identified and were analysed by unsupervised hierarchical clustering, revealing distinct temporal profiles of protein dissociation from IACs. Four clusters, labelled D1–4, were chosen on the basis of a Pearson correlation threshold greater than 0.9 and are indicated by blue and green bars. Clusters are shown alongside corresponding profile plots, with the mean temporal profile for each cluster indicated by a red line. Quantitative heat map displays mean spectral counts as a proportion of the maximum spectral count for each given protein. Proteins are labelled with gene names for clarity. Proteins also identified during IAC assembly (Fig. 6, Supplementary Table 11) are indicated by an asterisk. Literature-curated adhesome proteins and their isoforms are in bold. Proteins able to bind actin or integrin are indicated by black bars.
Figure 8
Figure 8
Changes in consensus adhesome components during IAC disassembly. (a) HFF cells treated with DMSO, 10 μM nocodazole or after nocodazole removal at different times were stained for vinculin, zyxin and α5 integrin. Representative images are shown. Scale bars, 20 μm. (b–d) Quantification of images in a. Vinculin, zyxin and α5 integrin levels were quantified as a proportion of total cell area. Box-and-whisker plot shows the median (line), mean (plus sign), 25th and 75th percentiles (box) and 5th and 95th percentiles (whiskers) (n = 10 cells per condition from one independent experiment). *P < 0.05, **P < 0.01, ***P < 0.001, ****P < 0.0001; Kruskal–Wallis test with Dunn’s post hoc correction (comparisons with the nocodazole treatment group are shown; see Supplementary Table 15 for statistics source data).

References

    1. Hynes RO. Integrins: bidirectional, allosteric signaling machines. Cell. 2002;110:673–687. - PubMed
    1. Liu S, Calderwood DA, Ginsberg MH. Integrin cytoplasmic domain-binding proteins. J. Cell Sci. 2000;113:3563–3571. - PubMed
    1. Morse EM, Brahme NN, Calderwood DA. Integrin cytoplasmic tail interactions. Biochemistry. 2014;53:810–820. (Mosc.) - PMC - PubMed
    1. Winograd-Katz SE, Fässler R, Geiger B, Legate KR. The integrin adhesome: from genes and proteins to human disease. Nat. Rev. Mol. Cell Biol. 2014;15:273–288. - PubMed
    1. Zaidel-Bar R, Geiger B. The switchable integrin adhesome. J. Cell Sci. 2010;123:1385–1388. - PMC - PubMed

Publication types

MeSH terms