Mapping the energy landscape for second-stage folding of a single membrane protein
- PMID: 26479439
- PMCID: PMC4986997
- DOI: 10.1038/nchembio.1939
Mapping the energy landscape for second-stage folding of a single membrane protein
Abstract
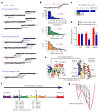
Membrane proteins are designed to fold and function in a lipid membrane, yet folding experiments within a native membrane environment are challenging to design. Here we show that single-molecule forced unfolding experiments can be adapted to study helical membrane protein folding under native-like bicelle conditions. Applying force using magnetic tweezers, we find that a transmembrane helix protein, Escherichia coli rhomboid protease GlpG, unfolds in a highly cooperative manner, largely unraveling as one physical unit in response to mechanical tension above 25 pN. Considerable hysteresis is observed, with refolding occurring only at forces below 5 pN. Characterizing the energy landscape reveals only modest thermodynamic stability (ΔG = 6.5 kBT) but a large unfolding barrier (21.3 kBT) that can maintain the protein in a folded state for long periods of time (t1/2 ∼3.5 h). The observed energy landscape may have evolved to limit the existence of troublesome partially unfolded states and impart rigidity to the structure.
Figures


Similar articles
-
Steric trapping reveals a cooperativity network in the intramembrane protease GlpG.Nat Chem Biol. 2016 May;12(5):353-360. doi: 10.1038/nchembio.2048. Epub 2016 Mar 21. Nat Chem Biol. 2016. PMID: 26999782 Free PMC article.
-
Topological constraints and modular structure in the folding and functional motions of GlpG, an intramembrane protease.Proc Natl Acad Sci U S A. 2016 Feb 23;113(8):2098-103. doi: 10.1073/pnas.1524027113. Epub 2016 Feb 8. Proc Natl Acad Sci U S A. 2016. PMID: 26858402 Free PMC article.
-
Direct observation of the three-state folding of a single protein molecule.Science. 2005 Sep 23;309(5743):2057-60. doi: 10.1126/science.1116702. Science. 2005. PMID: 16179479
-
Membrane protein folding and stability: physical principles.Annu Rev Biophys Biomol Struct. 1999;28:319-65. doi: 10.1146/annurev.biophys.28.1.319. Annu Rev Biophys Biomol Struct. 1999. PMID: 10410805 Review.
-
Folding kinetics of the outer membrane proteins OmpA and FomA into phospholipid bilayers.Chem Phys Lipids. 2006 Jun;141(1-2):30-47. doi: 10.1016/j.chemphyslip.2006.02.004. Epub 2006 Mar 20. Chem Phys Lipids. 2006. PMID: 16581049 Review.
Cited by
-
Contact Statistics Highlight Distinct Organizing Principles of Proteins and RNA.Biophys J. 2016 Jun 7;110(11):2320-2327. doi: 10.1016/j.bpj.2016.04.020. Biophys J. 2016. PMID: 27276250 Free PMC article.
-
On the Interpretation of Force-Induced Unfolding Studies of Membrane Proteins Using Fast Simulations.Biophys J. 2019 Oct 15;117(8):1429-1441. doi: 10.1016/j.bpj.2019.09.011. Epub 2019 Sep 17. Biophys J. 2019. PMID: 31587831 Free PMC article.
-
Folding and misfolding of potassium channel monomers during assembly and tetramerization.Proc Natl Acad Sci U S A. 2021 Aug 24;118(34):e2103674118. doi: 10.1073/pnas.2103674118. Proc Natl Acad Sci U S A. 2021. PMID: 34413192 Free PMC article.
-
Reversible Unfolding of Rhomboid Intramembrane Proteases.Biophys J. 2016 Mar 29;110(6):1379-90. doi: 10.1016/j.bpj.2016.01.032. Biophys J. 2016. PMID: 27028647 Free PMC article.
-
The role of single protein elasticity in mechanobiology.Nat Rev Mater. 2023 Jan;8:10-24. doi: 10.1038/s41578-022-00488-z. Epub 2022 Oct 24. Nat Rev Mater. 2023. PMID: 37469679 Free PMC article.
References
-
- Engelman DM, et al. Membrane protein folding: beyond the two stage model. FEBS Lett. 2003;555:122–125. - PubMed
-
- Bowie JU. Solving the membrane protein folding problem. Nature. 2005;438:581–589. - PubMed
-
- White SH, von Heijne G. How translocons select transmembrane helices. Annu Rev Biophys. 2008;37:23–42. - PubMed
Publication types
MeSH terms
Substances
Grants and funding
LinkOut - more resources
Full Text Sources
Other Literature Sources
Molecular Biology Databases

