. 2015 Oct 19;4(10):e172.
doi: 10.1038/oncsis.2015.32.

Nodes-and-connections RNAi knockdown screening: identification of a signaling molecule network involved in fulvestrant action and breast cancer prognosis

Affiliations

Nodes-and-connections RNAi knockdown screening: identification of a signaling molecule network involved in fulvestrant action and breast cancer prognosis

N Miyoshi et al. Oncogenesis. .

Abstract

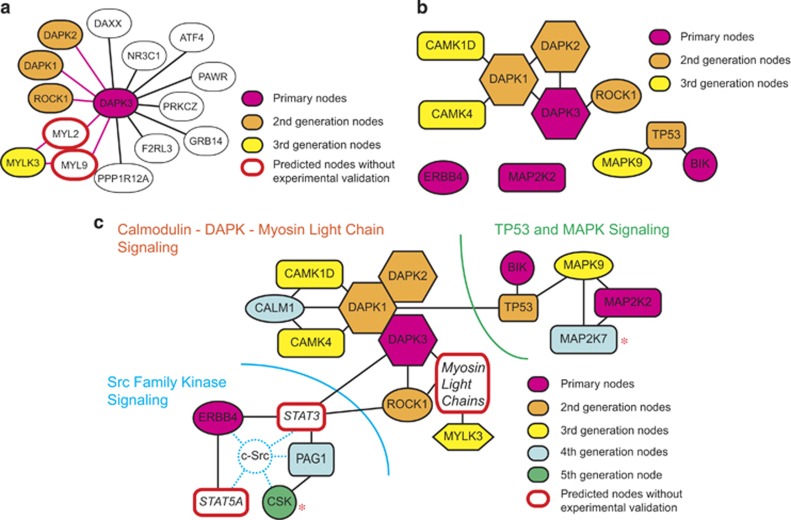
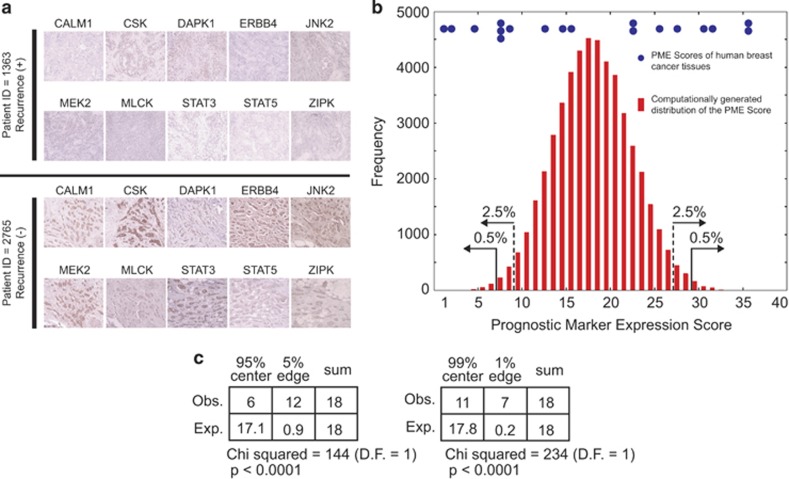
Although RNA interference (RNAi) knockdown screening of cancer cell cultures is an effective approach to predict drug targets or therapeutic/prognostic biomarkers, interactions among identified targets often remain obscure. Here, we introduce the nodes-and-connections RNAi knockdown screening that generates a map of target interactions through systematic iterations of in silico prediction of targets and their experimental validation. An initial RNAi knockdown screening of MCF-7 human breast cancer cells targeting 6560 proteins identified four signaling molecules required for their fulvestrant-induced apoptosis. Signaling molecules physically or functionally interacting with these four primary node targets were computationally predicted and experimentally validated, resulting in identification of four second-generation nodes. Three rounds of further iterations of the prediction-validation cycle generated third, fourth and fifth generation of nodes, completing a 19-node interaction map that contained three predicted nodes but without experimental validation because of technical limitations. The interaction map involved all three members of the death-associated protein kinases (DAPKs) as well as their upstream and downstream signaling molecules (calmodulins and myosin light chain kinases), suggesting that DAPKs play critical roles in the cytocidal action of fulvestrant. The in silico Kaplan-Meier analysis of previously reported human breast cancer cohorts demonstrated significant prognostic predictive power for five of the experimentally validated nodes and for three of the prediction-only nodes. Immunohistochemical studies on the expression of 10 nodal proteins in human breast cancer tissues not only supported their prognostic prediction power but also provided statistically significant evidence of their synchronized expression, implying functional interactions among these nodal proteins. Thus, the Nodes-and-Connections approach to RNAi knockdown screening yields biologically meaningful outcomes by taking advantage of the existing knowledge of the physical and functional interactions between the predicted target genes. The resulting interaction maps provide useful information on signaling pathways cooperatively involved in clinically important features of the malignant cells, such as drug resistance.


Figures

Figure 1
Figure 1
The nodes-and-connections strategy generating an interaction map of signaling molecule network required for the fulvestrant-induced MCF-7 cell apoptosis. (a) The in silico prediction and experimental validation of proteins functionally and/or physically interacting with the DAPK3 protein kinase (red). The Ingenuity Pathway Analysis (IPA) and other bioinformatics tools predicted 13 proteins regulating DAPK3 function or being regulated by it. Among them, requirement of three protein kinases (DAPK1, DAPK2 and ROCK1; orange) for the fulvestrant-induced MCF-7 cell apoptosis was confirmed by RNAi knockdown experiments. Although requirement of two other protein kinases (MYL2 and MYL9; open red) was unable to be confirmed by RNAi knockdown for technical limitations, requirement of MYLK3 (yellow), which regulates MYL2 and MYL9, was experimentally validated. RNAi knockdown of the other eight proteins (white) did not affect the fulvestrant-induced MCF-7 cell apoptosis. (b) An intermediate interaction map consisting of experimentally validated primary, second-generation and third-generation nodes. Two primary nodes (ERBB4 and MAPK2) are not yet connected to any other nodes. The four primary nodes have not been connected yet. (c) The interaction map of signaling molecules required for the fulvestrant-induced MCF-7 cell apoptosis. Three nodes (Myosin light chains, STAT3 and STAT5A) in this map were predicted by in silico analyses but not experimentally validated. All primary nodes are connected to each other, directly or indirectly, and the entire map is roughly divided into three sections—namely, SFK (Src family protein tyrosine kinase) signaling, DAPK signaling and other signaling molecules including BIK, TP53, MAP2Ks and MAPKs. Requirement of MAP2K7 and CSK (*) was also identified in an independently performed kinome-wide RNAi knockdown screening.
Figure 2
Figure 2
Effects of fulvestrant and 17β-estradiol on expression of the mRNA transcripts for the interaction map nodes in MCF-7 cells. (a, b) Cells were exposed to 100 nM fulvestrant or vehicle for 48 h followed by mRNA expression profiling by Affymetrix microarray. Robust Multi-array Average (RMA)-normalized relative mRNA expression of genes induced (a) or suppressed (b) by fulvestrant are shown; mRNA expression in vehicle-exposed cells is defined as 1.00 for each gene (mean±s.e.m., n≥5). Asterisk indicates statistically significant changes compared with exposure to vehicle (analysis of variance (ANOVA) *P<0.05). (c–e) Cells were exposed to varying concentrations of 17β-estradiol for 48 h followed by Affymetrix transcriptomal profiling. RMA-normalized relative mRNA expression of genes induced (a), suppressed (b) or unchanged (c) by 17β-estradiol are shown. Each datum point represents results of at least three independent experiments (mean±s.e.m.), and asterisk indicates statistically significant changes compared with exposure to vehicle (ANOVA *P<0.05; **P<0.005).
Figure 3
Figure 3
Kaplan–Meier recurrence-free survival curves of breast cancer cohorts whose surgically resected primary tumors strongly or weakly expressed the interaction map nodes. Each cohort of patients involved in the previously reported studies on breast cancer prognosis and mRNA expression profiles were divided into two groups of identical numbers of patients strongly (red) or weakly (blue) expressing the interaction map nodes. Thus, the weakest mRNA expression in a tumor belonging to the subcohort indicated by red line was stronger than the strongest mRNA expression in the subcohort indicated by blue line, although the absolute mRNA amounts and the shape of their distributions may differ for each panel. Kaplan–Meier curves of recurrence-free survival were drawn for each of the two groups, and the pair of curves showing significantly different survival rate are shown (false discovery rate (FDR) <0.25, Benjamini–Hochberg corrected one-sided log-rank P-values). Each panel indicates the pair of curves, the node protein and the cohort study.
Figure 4
Figure 4
Expression of the interaction map node proteins in human breast cancer tissues. (a) Immunohistochemical staining of a recurrence-positive tumor (top) and a recurrence-negative tumor (bottom) for 10 selected interaction map node proteins. (b, c) A permutation test demonstrating synchronized expression of the 10 interaction map node proteins in human breast cancer tissues. The PME score is the sum of intensity scores of the 10 antigens (see Materials and methods for details). The histogram (b) shows a theoretical distribution of the PME score computationally generated by 50 000-cycle permutations of randomly selected intensity scores of the raw data, and arrows indicate boundaries of 5 or 1% two-tail extremities. The PME scores of the 18 tumor specimens are shown with blue dots (b), and their statistical significance was determined by the χ2 test (c).

References

    1. 1Butt AJ, Sutherland RL, Musgrove EA. Live or let die: oestrogen regulation of survival signalling in endocrine response. Breast Cancer Res 2007; 9: 306. - PMC - PubMed
    1. 2Sainsbury R. The development of endocrine therapy for women with breast cancer. Cancer Treat Rev 2013; 39: 507–517. - PubMed
    1. 3Biganzoli L, Wildiers H, Oakman C, Marotti L, Loibl S, Kunkler I et al. Management of elderly patients with breast cancer: updated recommendations of the International Society of Geriatric Oncology (SIOG) and European Society of Breast Cancer Specialists (EUSOMA). Lancet Oncol 2012; 13: e148–e160. - PubMed
    1. 4Massarweh S, Schiff R. Unraveling the mechanisms of endocrine resistance in breast cancer: new therapeutic opportunities. Clin Cancer Res 2007; 13: 1950–1954. - PubMed
    1. 5Bedard PL, Freedman OC, Howell A, Clemons M. Overcoming endocrine resistance in breast cancer-are signal transduction inhibitors the answer? Breast Cancer Res Treat 2008; 108: 307–317. - PubMed