. 2016 Mar;42(3):386-400.
doi: 10.1037/xhp0000147. Epub 2015 Oct 19.

Sound segregation via embedded repetition is robust to inattention

Affiliations

Sound segregation via embedded repetition is robust to inattention

Keiko Masutomi et al. J Exp Psychol Hum Percept Perform. 2016 Mar.

Abstract

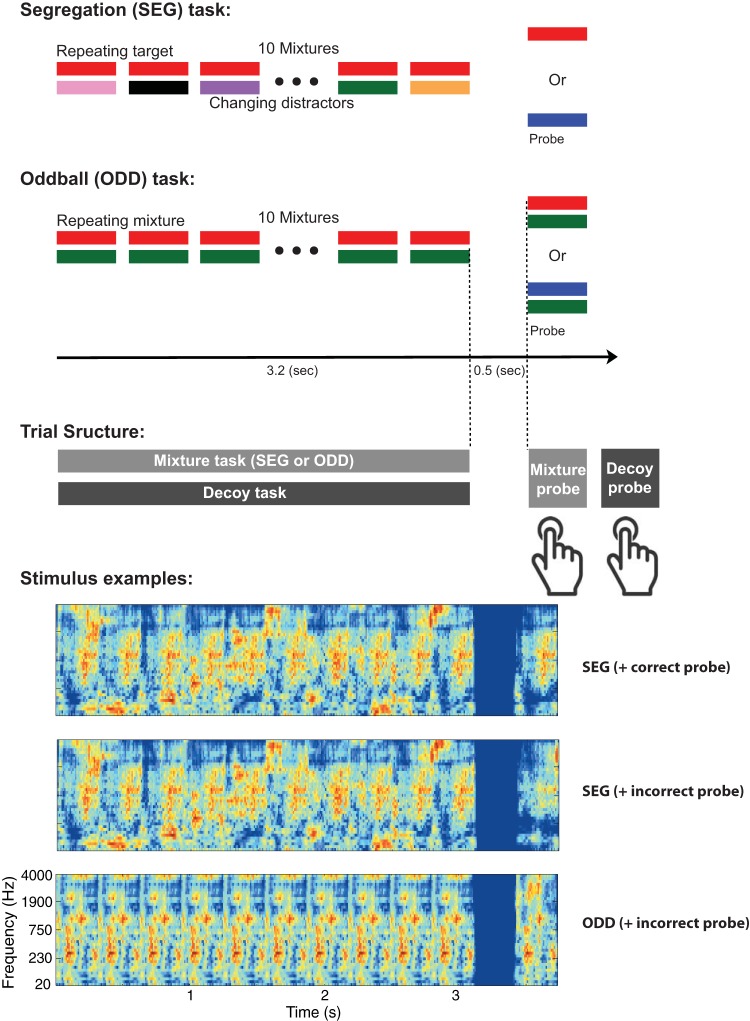
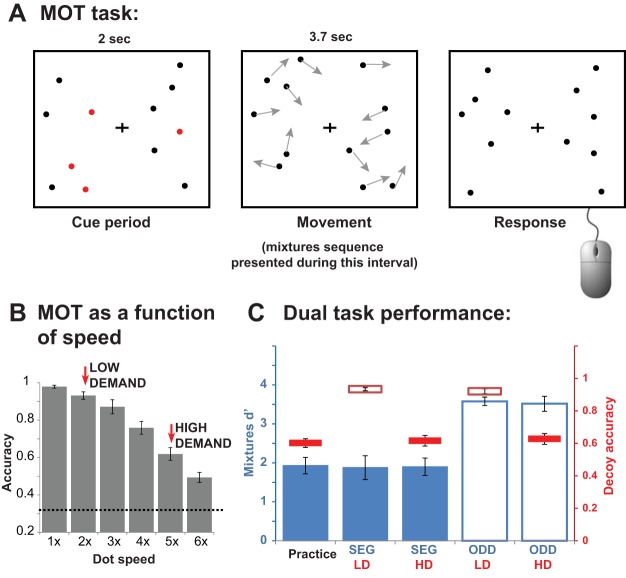
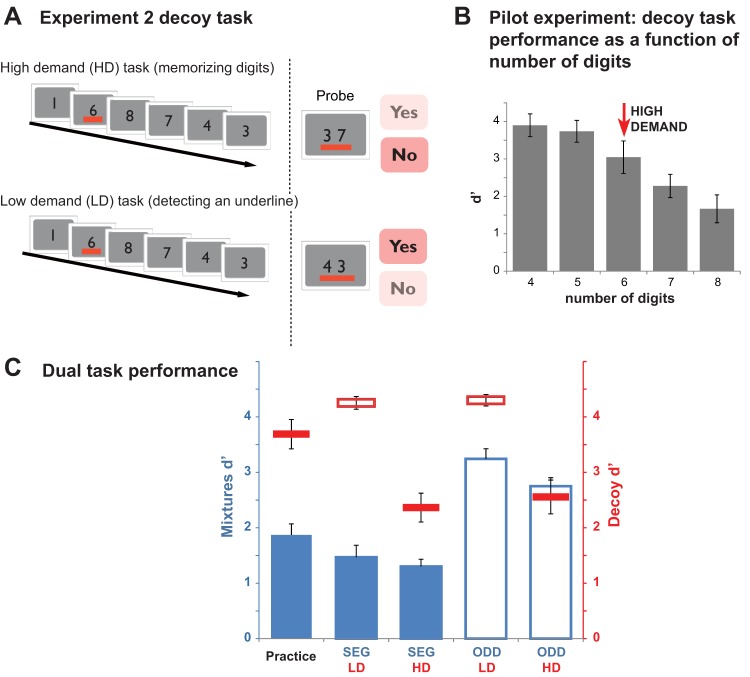
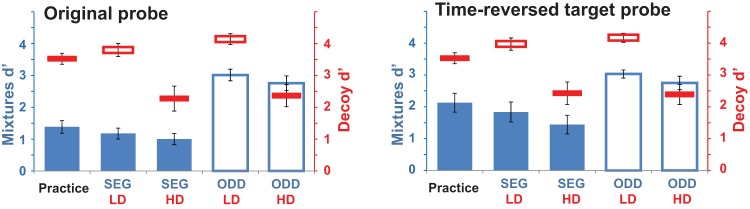
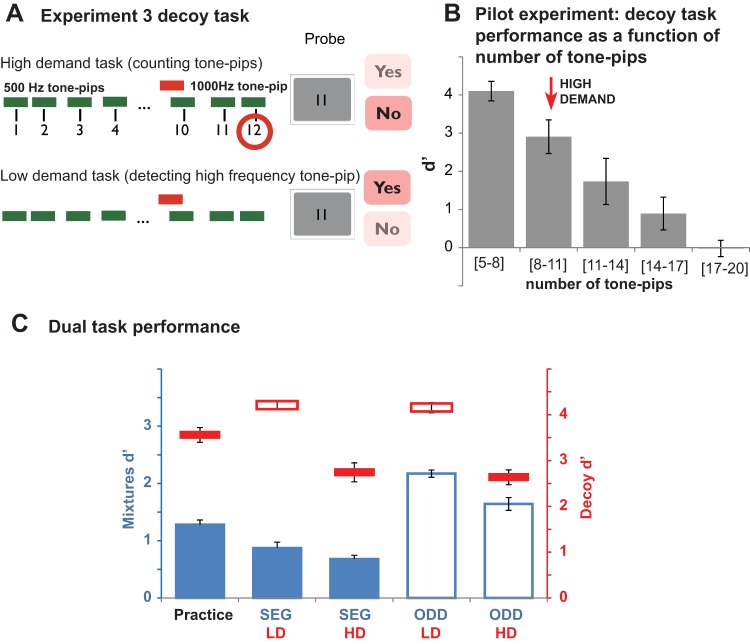
The segregation of sound sources from the mixture of sounds that enters the ear is a core capacity of human hearing, but the extent to which this process is dependent on attention remains unclear. This study investigated the effect of attention on the ability to segregate sounds via repetition. We utilized a dual task design in which stimuli to be segregated were presented along with stimuli for a "decoy" task that required continuous monitoring. The task to assess segregation presented a target sound 10 times in a row, each time concurrent with a different distractor sound. McDermott, Wrobleski, and Oxenham (2011) demonstrated that repetition causes the target sound to be segregated from the distractors. Segregation was queried by asking listeners whether a subsequent probe sound was identical to the target. A control task presented similar stimuli but probed discrimination without engaging segregation processes. We present results from 3 different decoy tasks: a visual multiple object tracking task, a rapid serial visual presentation (RSVP) digit encoding task, and a demanding auditory monitoring task. Load was manipulated by using high- and low-demand versions of each decoy task. The data provide converging evidence of a small effect of attention that is nonspecific, in that it affected the segregation and control tasks to a similar extent. In all cases, segregation performance remained high despite the presence of a concurrent, objectively demanding decoy task. The results suggest that repetition-based segregation is robust to inattention.


Figures

Figure 1
Figure 1
Schematic representation of the mixtures stimuli and trial structure. In the “segregation” (SEG) task, the stimulus consisted of a target sound (red (top) bars) repeatedly presented 10 times, each time with a different distractor (different colored bars). The mixture sequences were followed by a probe sound, and listeners were asked to judge whether the probe sound had been present in the mixture sequence. The probe was either the repeating target sound or a distinct sound. In the “oddball” (ODD) task, the stimulus consisted of 10 identical mixtures, followed by a probe mixture that was either identical to the repeated mixtures, or different by virtue of one of the original sounds composing the mixture having been replaced by a different sound. Cochleograms of example SEG and ODD sequences are provided at the bottom of the figure. Experimental trials were structured such that mixture sequences (SEG or ODD) were presented concurrently with decoy task stimuli to which subjects were instructed to attend. Following the presentation, subjects first responded to the mixtures probe and then to the decoy probe (separate keyboard buttons). Feedback was provided at the end of each trial. See the online article for the color version of this figure.
Figure 2
Figure 2
Stimuli and results for Experiment 1: Multiple Object Tracking (MOT) decoy task. (A) MOT task structure: At the start of a trial (2-s cue period), 12 static dots (eight black; four cued in red) appeared on the computer screen. At the start of the tracking period (3.7-s in duration) the color of the cued dots change to black and all dots began moving. At the end of the tracking period all dots stopped abruptly. Participants first responded to the auditory probe (see trial structure in Figure 1), and were then prompted to click on the MOT targets. (B) MOT performance as a function of dot speed (results of pilot experiment). Chance level is indicated with a dashed line. The 2× condition was chosen for the low demand (LD) task, and the 5× condition was chosen for the high demand (HD) task. (C) Results of the dual task experiment for each combination of mixtures and decoy task. Performance on the decoy task in plotted in red (horizontal bars; solid segments for HD; outline segments for LD; relative to the axis on the right) and performance on the mixtures task is plotted in blue (solid bars for the segregation [SEG] task; outline bars for the oddball “ODD” task; relative to the axis on the left). The practice data are single-task performance on the SEG condition and HD condition prior to the beginning of the experiment proper. Error bars here and elsewhere plot SEMs. See the online article for the color version of this figure.
Figure 3
Figure 3
Stimuli and results for Experiment 2A: Rapid Serial Visual Presentation (RSVP) memory load decoy task. (A) RSVP task structure: Stimuli consisted of a rapid serial presentation of single digits (from 1 to 8) at the center of the computer screen. The digit series were composed of five or six digits, depending on each participant’s performance in the practice session. In half of the trials, one of the digits (randomly chosen) was underlined in red. In the high demand (HD) task, participants were required to memorize the sequence of digits (and to ignore the underline if it was presented). At the end of the trial (following the response to the mixtures probe), a pair of digits (probe) was presented on the screen. These were always digits that appeared in the preceding sequence and participants were required to report (by pressing a “Yes” or “No” button) whether the two digits were exactly consecutive in the preceding sequence (in the example shown the correct answer is “No”). In the low demand (LD) task, participants were required to report whether an underline appeared within the sequence (in the example shown the correct answer is “Yes”). The probe structure (two digits and an underline) was identical in the HD and LD tasks however, participants were instructed to ignore the content of the probe in the LD tasks and respond regarding the presence of the underline only. (B) RSVP performance as a function of number of digits (results of pilot experiment). The six-digits condition was chosen for the main experiment (although some participants who performed poorly with six digits ran the main experiment on the five-digits condition). (C) Results of the dual task experiment for each combination of mixtures and decoy task. Conventions are as in Figure 2. See the online article for the color version of this figure.
Figure 4
Figure 4
Results of Experiment 2B, with time-reversed probes on half of the trials. Conventions are as in Figure 2. See the online article for the color version of this figure.
Figure 5
Figure 5
Stimuli and results for Experiment 3: Auditory counting decoy task. (A) Counting task structure: Trials consisted of a 3.2-s long sequence of a variable number of identical, 100-ms tone pips (green bars). In half of the trials, a high frequency tone pip (“deviant”; red bar) was presented at a random time during the trial. After the sequence (following the probe for the mixtures sequence), a cue, in the form of a number, was presented on the screen. That number was either identical to the number of tone-pips in the sequence (excluding the deviant, if present) or differed from it by 1. In the high demand (HD) task, participants were required to count the tones (ignoring the high frequency deviant) and determine (by pressing “Yes” or “No”), whether the number in the probe matched that total (in the example, the correct answer is “No” because 12 tones were presented). In the low demand (LD) task, participants ignored the content of the probe and reported whether a high-frequency tone was present in the sequence (in the example, the correct answer is “Yes”). (B) Counting performance as a function of number of tone pips (results of pilot experiment). The [8–11] tone-pips condition was chosen for the main experiment (although some participants who performed at ceiling ran the main experiment on the [11–14] condition). (C) Results of the dual task experiment for each combination of mixtures and decoy task. Conventions are as in Figure 2. See the online article for the color version of this figure.

References

    1. Agus T. R., Thorpe S. J., & Pressnitzer D. (2010). Rapid formation of robust auditory memories: Insights from noise. Neuron, 66, 610–618. 10.1016/j.neuron.2010.04.014 - DOI - PubMed
    1. Akram S., Englitz B., Elhilali M., Simon J. Z., & Shamma S. A. (2014). Investigating the neural correlates of a streaming percept in an informational-masking paradigm. PLoS ONE, 9, 10.1371/journal.pone.0114427 - DOI - PMC - PubMed
    1. Alain C., & Izenberg A. (2003). Effects of attentional load on auditory scene analysis. Journal of Cognitive Neuroscience, 15, 1063–1073. 10.1162/089892903770007443 - DOI - PubMed
    1. Alain C., & Woods D. L. (1994). Signal clustering modulates auditory cortical activity in humans. Perception & Psychophysics, 56, 501–516. 10.3758/BF03206947 - DOI - PubMed
    1. Alho K., Medvedev S. V., Pakhomov S. V., Roudas M. S., Tervaniemi M., Reinikainen K., et al. Näätänen R. (1999). Selective tuning of the left and right auditory cortices during spatially directed attention. Cognitive Brain Research, 7, 335–341. 10.1016/S0926-6410(98)00036-6 - DOI - PubMed

Publication types