

doi: 10.1007/s11538-015-0110-8.
Estimating Tumor Growth Rates In Vivo
- PMID: 26481497
- PMCID: PMC4764475
- DOI: 10.1007/s11538-015-0110-8
Item in Clipboard
Estimating Tumor Growth Rates In Vivo
Bull Math Biol.
2015 Oct.
Abstract
In this paper, we develop methods for inferring tumor growth rates from the observation of tumor volumes at two time points. We fit power law, exponential, Gompertz, and Spratt’s generalized logistic model to five data sets. Though the data sets are small and there are biases due to the way the samples were ascertained, there is a clear sign of exponential growth for the breast and liver cancers, and a 2/3’s power law (surface growth) for the two neurological cancers.
Figures

Correction factors f(V) for the models plotted against log(V). The Gompertz is the straight line of diamonds, Spratt are the squares, while power laws 2/3, 0.8 and 0.9 are in decreasing order the curves marked with triangles.

Comparison of log10
V (t) for our models. All start with one cell, V (0) = 10−9
cm3. Rates are chosen so that V (10) = 10 cm3. The solid lines in decreasing order are power laws α = 0.5, 2/3, 0.8, 0.9. The exponential is the straight line −9 + t. The dashed lines are Gompertz (larger) and Spratt (close to exponential).

Heuser data set: Exponential growth rate estimates plotted versus initial volume. The tumor indicated by the square was not used to compute the regression line.

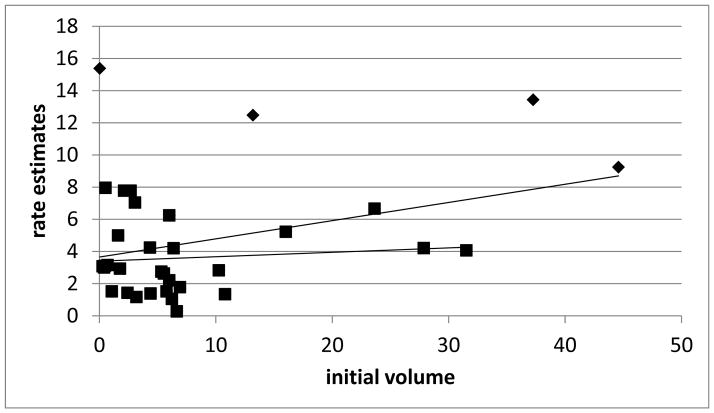
Exponential (squares) and Spratt (diamonds) rate estimates for the Saito data set, and the corresponding regression lines that have slopes 0.0488 and 0.1337. As to be expected the Spratt rate estimate is larger, and the discrepancy increases with the initial size of the tumor.
Nakajima data set. The diamonds are the four points we discarded. Also shown are the regression line fits for the entire data (slope 0.1131) and reduced data sets (slope 0.0274). The three diamonds with initial volume > 10 cm3 are responsible for the large increase in slope.

Exponential rate estimates for the Laasonen and Troupp [13] data, showing the large influence of the two points with initial volume > 7 cm3.

Rate estimates for the power laws 0.5 (circle), 2/3 (diamond), and 0.8 (triangle) for the Laasonen and Troup data plotted versus initial tumor size V1, as well as the three least squares lines, which have slopes 0.0855, −6 × 10⁻⁶, and −0.0711. Note that in most cases (but not all) the rate estimate decreases as the power increases.

Rate estimates for the power laws 0.5 (diamond), 2/3 (square), and 0.8 (triangle) for the Nakamura data plotted versus initial tumor size V1, as well as the three regression lines, which which have slopes 0.0028, −0.0010, and −0.0027. The circles are the 0.5 rate estimates for the five tumors we have excluded.

Variability in the logarithm of the rate estimates centered by subtracting the mean of the logarithms. From top to bottom we have the exponential rate estimates for Heuser, Saito, and Nakajima, followed by the 2/3 power law estimates for Laasonen and Tropp, and Nakamura.
Similar articles
-
Classical mathematical models for description and prediction of experimental tumor growth.PLoS Comput Biol. 2014 Aug 28;10(8):e1003800. doi: 10.1371/journal.pcbi.1003800. eCollection 2014 Aug. PLoS Comput Biol. 2014. PMID: 25167199 Free PMC article.
-
A comparison and catalog of intrinsic tumor growth models.Bull Math Biol. 2014 Aug;76(8):2010-24. doi: 10.1007/s11538-014-9986-y. Epub 2014 Aug 1. Bull Math Biol. 2014. PMID: 25081547
-
Harnessing Flex Point Symmetry to Estimate Logistic Tumor Population Growth.Bull Math Biol. 2024 Oct 9;86(11):135. doi: 10.1007/s11538-024-01361-6. Bull Math Biol. 2024. PMID: 39384633
-
[Kinetics of breast neoplasms].Minerva Med. 1994 Jan-Feb;85(1-2):7-16. Minerva Med. 1994. PMID: 8152580 Review. Italian.
-
Applications of quantitative microscopy in tumor pathology.Lab Invest. 1985 Jul;53(1):5-21. Lab Invest. 1985. PMID: 3892158 Review. No abstract available.
Cited by
-
Machine learning-based prediction of breast cancer growth rate in vivo.Br J Cancer. 2019 Sep;121(6):497-504. doi: 10.1038/s41416-019-0539-x. Epub 2019 Aug 9. Br J Cancer. 2019. PMID: 31395950 Free PMC article. Clinical Trial.
-
Assessing lead time bias due to mammography screening on estimates of loss in life expectancy.Breast Cancer Res. 2022 Feb 23;24(1):15. doi: 10.1186/s13058-022-01505-3. Breast Cancer Res. 2022. PMID: 35197123 Free PMC article.
-
Therapeutically-induced stable disease in oncology early clinical trials.PLoS One. 2020 May 29;15(5):e0233882. doi: 10.1371/journal.pone.0233882. eCollection 2020. PLoS One. 2020. PMID: 32470048 Free PMC article.
-
Preclinical meritorious anticancer effects of Metformin against breast cancer: An In vivo trial.J Taibah Univ Med Sci. 2021 Mar 17;16(4):504-512. doi: 10.1016/j.jtumed.2021.02.006. eCollection 2021 Aug. J Taibah Univ Med Sci. 2021. PMID: 34408607 Free PMC article.
-
Role of 3D volume growth rate for drug activity evaluation in meningioma clinical trials: the example of the CEVOREM study.Neuro Oncol. 2021 Jul 1;23(7):1139-1147. doi: 10.1093/neuonc/noab019. Neuro Oncol. 2021. PMID: 33556177 Free PMC article. Clinical Trial.
References
-
- Castorina P, Diesboeck TS, Gabriele P, Guiot C. Growth laws in cancer: Implications for radiotherapy. Radiation Research. 2007;168:349–356. - PubMed
-
- Chingola R, Foroni RI. Estimating the growth kinetics of experimental tumors from as few as two determinations of tumor size: Implications for clinical oncology. IEEE Transactions on Biomedical Engineering. 2005;52:808–815. - PubMed
-
- Collins VP, et al. Observations on growth rates of human tumors. Am J Roentgeol Radium Ther Nucl Med. 1956;76:988–1000. - PubMed
-
- Comen E, Morris PG, Norton L. Translating mathematical modeling of tumor growth patterns into novel therapeutic approaches to breast cancer. J Mammay Gland Biol Noeplasia. 2012;17:241–249. - PubMed
Publication types
MeSH terms
Grants and funding
LinkOut - more resources
Full Text Sources
Other Literature Sources
