. 2016 Jan 15:125:1063-1078.
doi: 10.1016/j.neuroimage.2015.10.019. Epub 2015 Oct 20.

An integrated approach to correction for off-resonance effects and subject movement in diffusion MR imaging

Affiliations

An integrated approach to correction for off-resonance effects and subject movement in diffusion MR imaging

Jesper L R Andersson et al. Neuroimage. .

Abstract

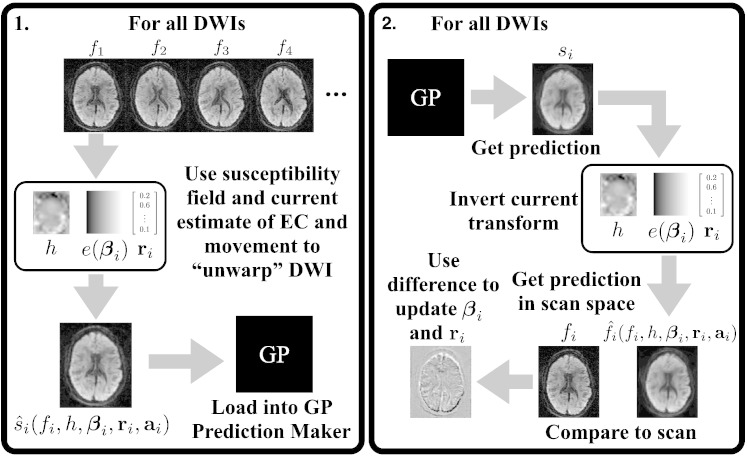
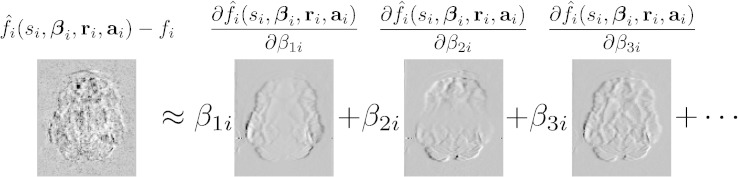
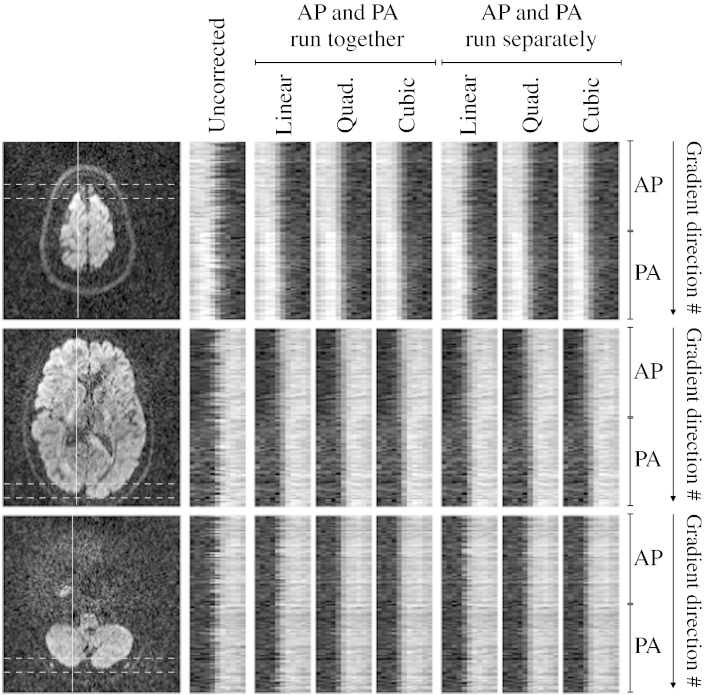
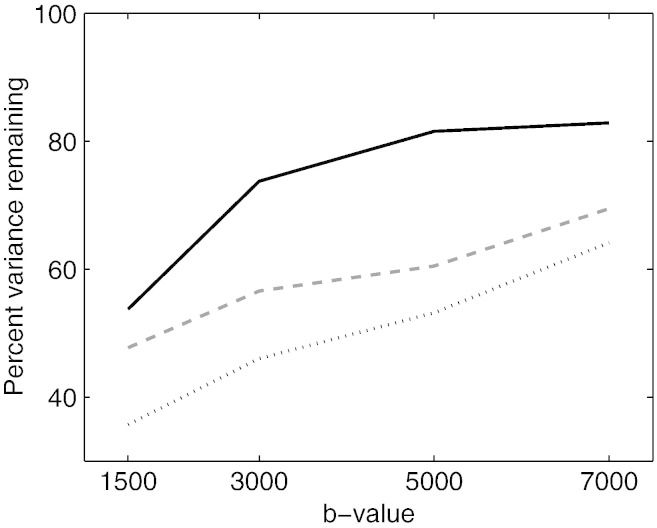
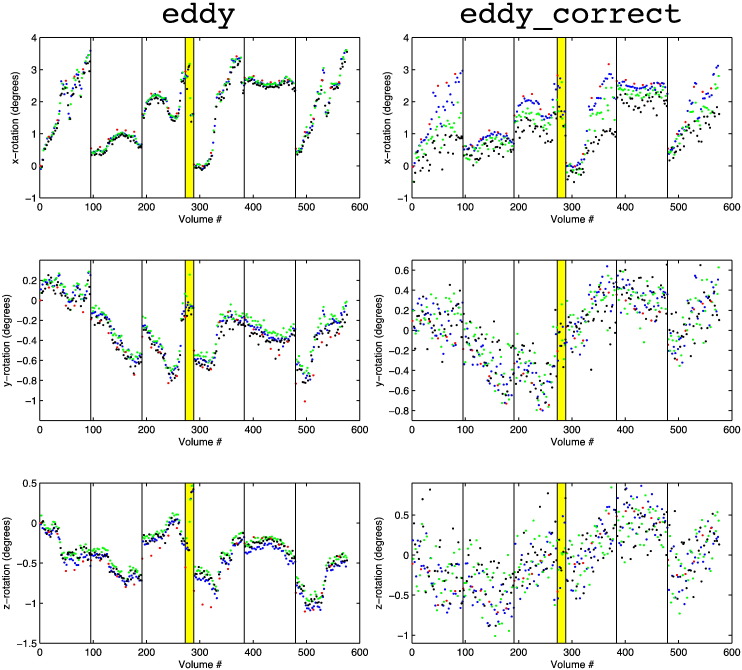
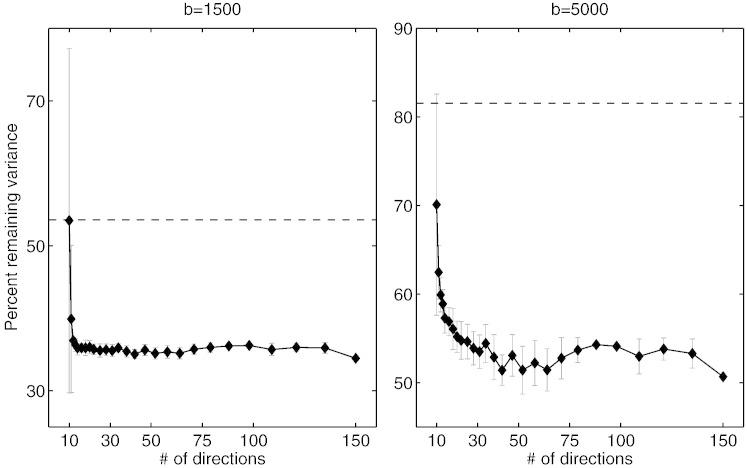
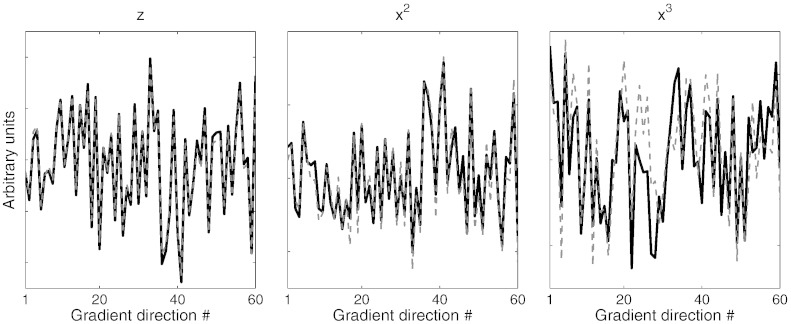
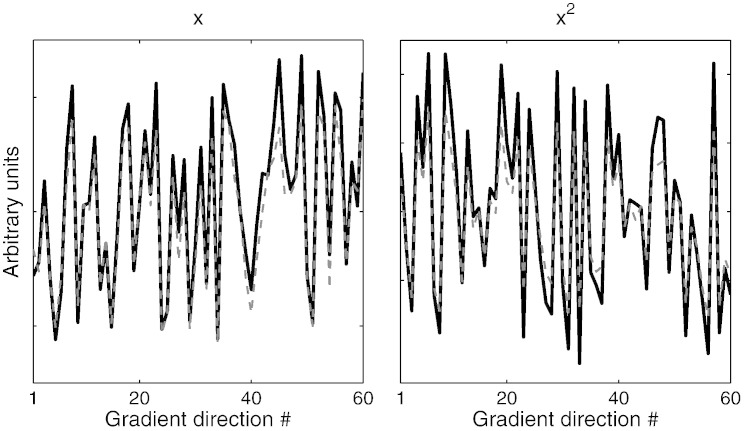
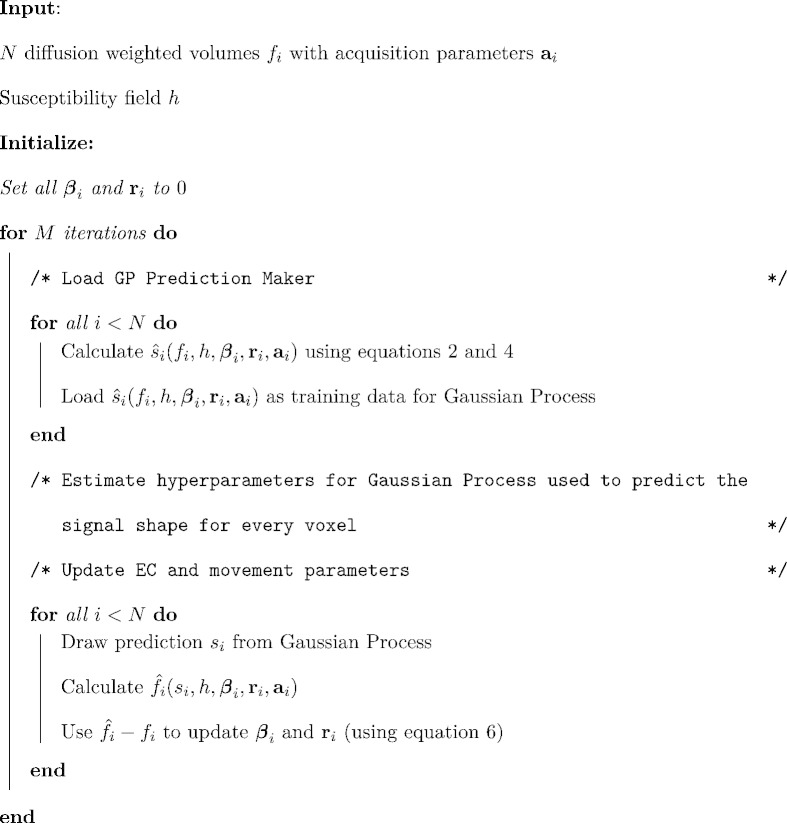
In this paper we describe a method for retrospective estimation and correction of eddy current (EC)-induced distortions and subject movement in diffusion imaging. In addition a susceptibility-induced field can be supplied and will be incorporated into the calculations in a way that accurately reflects that the two fields (susceptibility- and EC-induced) behave differently in the presence of subject movement. The method is based on registering the individual volumes to a model free prediction of what each volume should look like, thereby enabling its use on high b-value data where the contrast is vastly different in different volumes. In addition we show that the linear EC-model commonly used is insufficient for the data used in the present paper (high spatial and angular resolution data acquired with Stejskal-Tanner gradients on a 3T Siemens Verio, a 3T Siemens Connectome Skyra or a 7T Siemens Magnetome scanner) and that a higher order model performs significantly better. The method is already in extensive practical use and is used by four major projects (the WU-UMinn HCP, the MGH HCP, the UK Biobank and the Whitehall studies) to correct for distortions and subject movement.

Keywords: Diffusion; Eddy current; Movement; Registration; Susceptibility.


Figures

Fig. 1
Fig. 1
This figure explains the correction algorithm. Each iteration consists of two parts: 1) The prediction step and 2) The estimation step. It is run for a fixed number of iterations M and experience has shown that M = 5 iterations is sufficient.
Fig. 2
Fig. 2
The observed difference between the prediction (f^isiβiriai) and the observation (fi) is modeled as a linear combination of the partial derivatives of the prediction w.r.t. to the parameters (βi) defining the EC-field and the rigid body parameters (ri). For space reasons the figure only shows the first three parameters of βi. The update is calculated by solving the equation shown in the figure for [β1iβ2ir61] in a least-squares sense after which it is added to the previous estimate of [βiri].
Fig. 3
Fig. 3
Plot showing how the error variance (as assessed by sum-of-squared differenced of paired images with opposing PE directions) relative to that of no Q-space smoothing depends on the level of Q-space smoothing. The Q-space smoothing is achieved by multiplying the GP-error-variance by a factor greater than 1, and is shown for the range 1 to 10. It can be seen that it has a relatively minor effect on “normal” b-values of 1500, but that it has a substantial effect on data acquired with higher b-values (5000 and 7000). The plot indicates that by choosing a value of 10 close to optimal results are obtained for all b-values. Data set C was used for this figure.
Fig. 4
Fig. 4
The top row shows the effect of Q-space smoothing, as effected through the error variance hyperparameter of the GP, on the predicted signal. The red markers represent signal observed for different diffusion directions (as distance from the center) and the gray surface represents the predictions made by the GP. The lower row shows the weights given to neighboring points when predicting the signal for the point indicated by the blue marker. The values along the color bars pertain to the (hypothetical) case where there is a “measurement” inside each of the (1681) square patches on the sphere and would scale with the inverse of the number of actual measurements. The relative values when comparing different variance scaling are still valid as are the extent of the kernels on the sphere.
Fig. 5
Fig. 5
The left column of images show three different slices for the FMRIB 1.5 mm data (B), and for each there is a vertical line that shows where the 1-D profiles were obtained. Perpendicular to that line are two horizontal lines that show the extent of the profiles (how many voxels it was obtained for). The next column shows that profile for each of the 120 diffusion weighted images (divided onto 60 + 60 images with phase-encoding A → P and P → A) without any correction for eddy currents (but corrected for susceptibility using topup). The next three columns show the corrected results when all the data (A → P and P → A) was used to run eddy with, from left to right, linear, quadratic and cubic models for the eddy current-induced field. The final three columns show the results when eddy was run separately for the A → P and the P → A data.
Fig. 6
Fig. 6
Plots showing error variance relative to only correcting for susceptibility. The curves are solid black line: eddy_correct, dashed gray line: eddy with linear EC model and dotted black line: eddy with quadratic EC model. Data set C was used for this figure.
Fig. 7
Fig. 7
This figure shows the rotation parameters estimated for the b = 0 volumes (red) and for the b = 1000, b = 2000 and b = 3000 shells in blue, green and black respectively. The left column shows the estimates from eddy and the right from eddy_correct. The rows, from top to bottom, show rotation around the x-, y- and z-axes respectively. The vertical lines indicate the starts of the six different “sessions” in which the data was acquired. The yellow band indicates a period at the end of the third session during which the subject performed some sudden movements. Note that the ranges of the y-axes are not identical for the left and the right column, but that the scale is which allows for a direct visual comparison of the two. Data set D was used for this figure.
Fig. 8
Fig. 8
Figure showing the effect of number of directions on the accuracy of the correction. Each point represents ten different subsamples of the size indicated on the x-axis (from a total of 150) and the error bars represent the standard deviation across those ten realizations. The accuracy of eddy_correct when applied to the full 150 direction data set is indicated by the dashed line for comparison. It appears that the correction works well down to 15 and 30 directions for the b = 1500 and the b = 5000 data respectively. Data set C was used for this figure.
Fig. 9
Fig. 9
The parameter estimates for the z, x2 and x3 components of the fields estimated using only the A → P (solid black line) or only the P → A (dashed gray line) FMRIB 1.5 mm data (B). Note that the parameters have been estimated from different data (i.e., no single measurement has been used for both estimates), and yet there is a strong similarity between the estimates with correlations of 0.997, 0.971 and 0.796 respectively for the components seen here.
Fig. 10
Fig. 10
The EC-parameters estimated with a quadratic model for the 1.5 mm (B) was fitted to a second order polynomial of the diffusion gradients (the model given by Eqs. (B3), (B5)). The parameter estimates for the polynomial were used to predict what the EC-parameters should be for the 2 mm data (A). The solid black lines are the estimated EC-parameters for the x- (left) and x2-components (right) estimated directly from the 2 mm data and the dashed gray lines are the predictions made from the 1.5 mm data.
None

Similar articles

Cited by

References

    1. Alexander A.L., Tsuruda J.S., Parker D.L. Elimination of eddy current artifacts in diffusion weighted echo-planar images: the use of bipolar gradients. Magn. Reson. Med. 1997;38(2):1016–1021. - PubMed
    1. Alexander A.L., Wu Y.-C., Venkat P.C. Hybrid diffusion imaging (HYDI) Magn. Reson. Med. 2006;38(2):1016–1021. - PubMed
    1. Andersson J.L.R. How to obtain high-accuracy image registration: application to movement correction of dynamic positron emission tomography data. Eur. J. Nucl. Med. 1998;25:575–586. - PubMed
    1. Andersson J.L.R., Skare S. A model-based method for retrospective correction of geometric distortions in diffusion-weighted EPI. NeuroImage. 2002;16:177–199. - PubMed
    1. Andersson J.L.R., Skare S. Chapter 17: Image distortion and its correction in diffusion MRI. In: Jones D.K., editor. Diffusion MRI: Theory, Methods, and Applications. Oxford University Press; Oxford, United Kingdom: 2011. pp. 285–302.

Publication types