. 2015 Oct 20:5:14928.
doi: 10.1038/srep14928.

Selector function of MHC I molecules is determined by protein plasticity

Affiliations

Selector function of MHC I molecules is determined by protein plasticity

Alistair Bailey et al. Sci Rep. .

Abstract

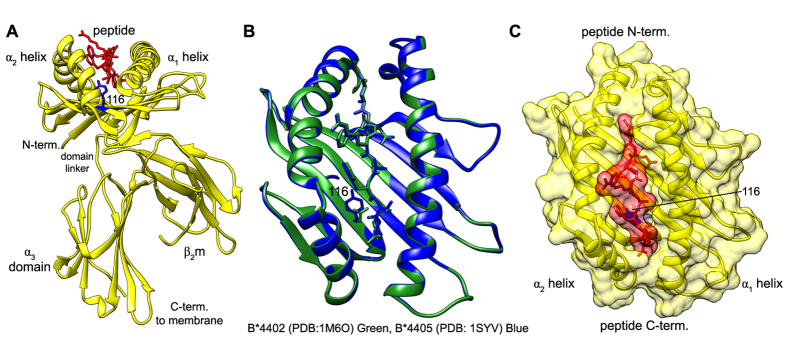
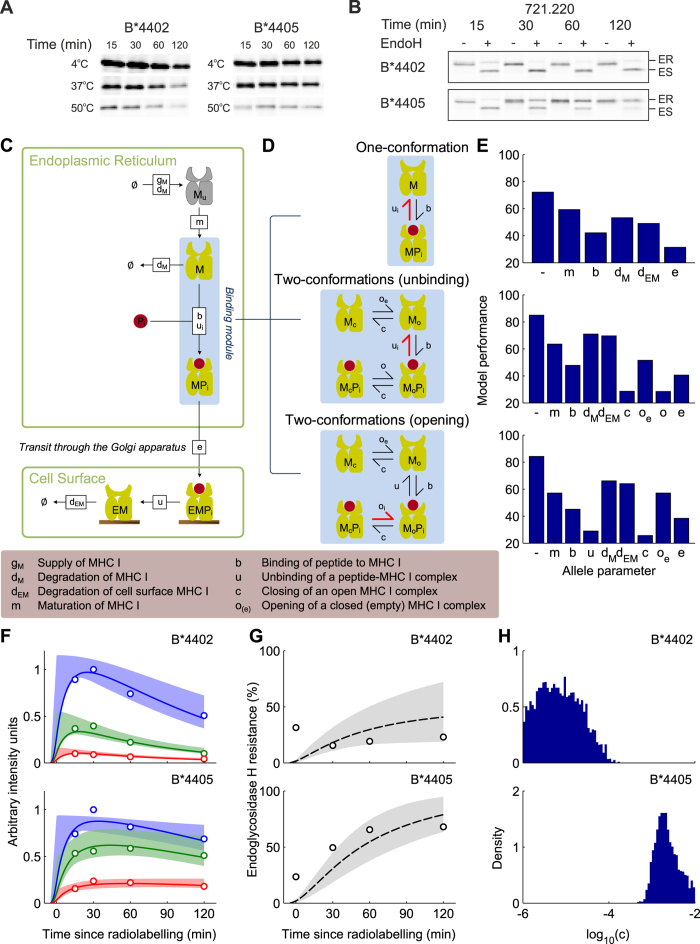
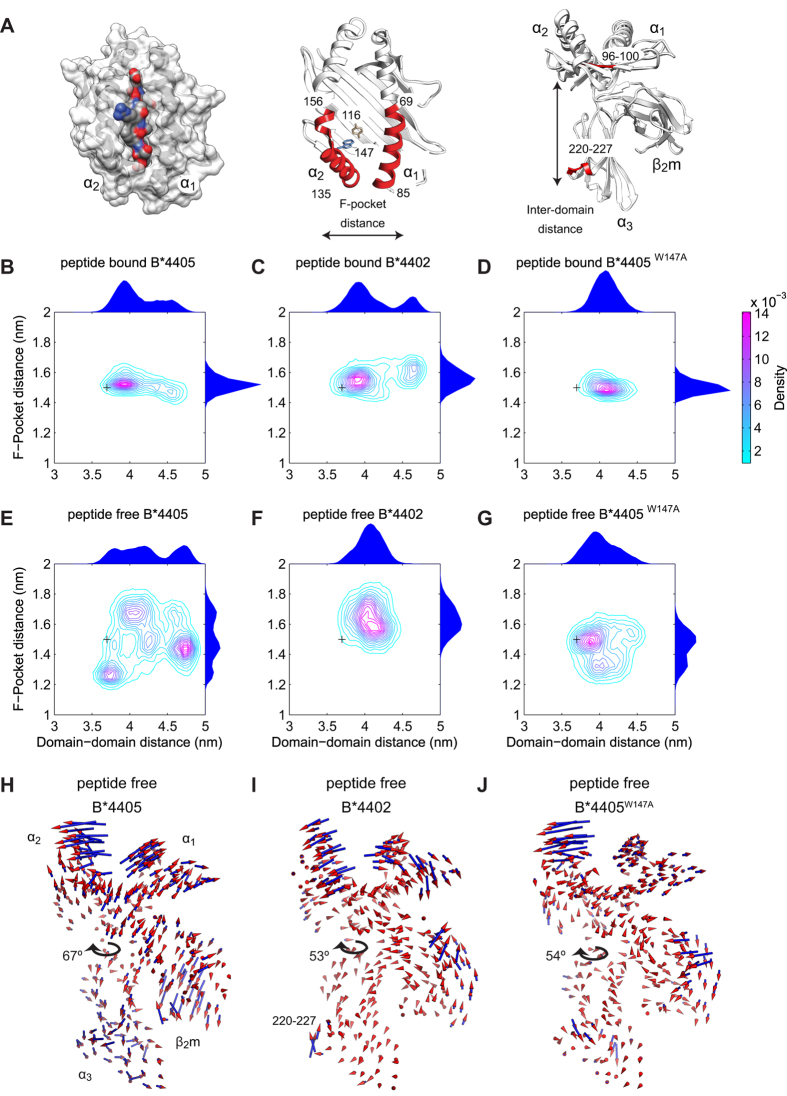
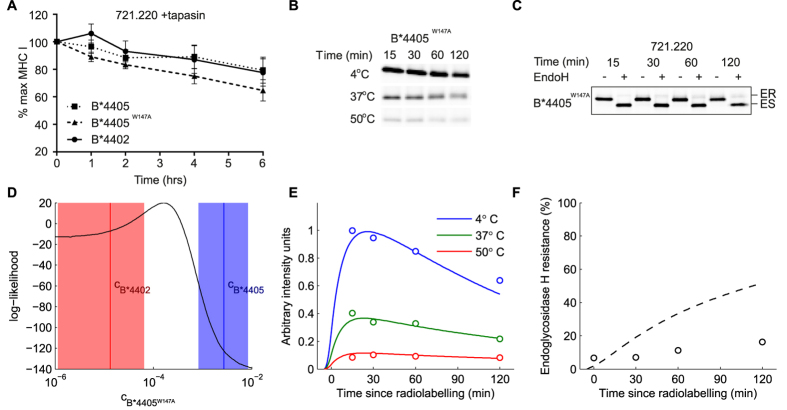
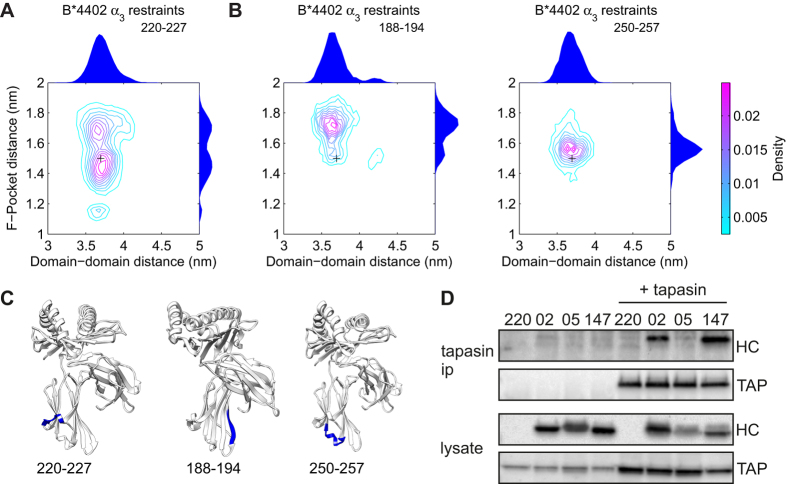
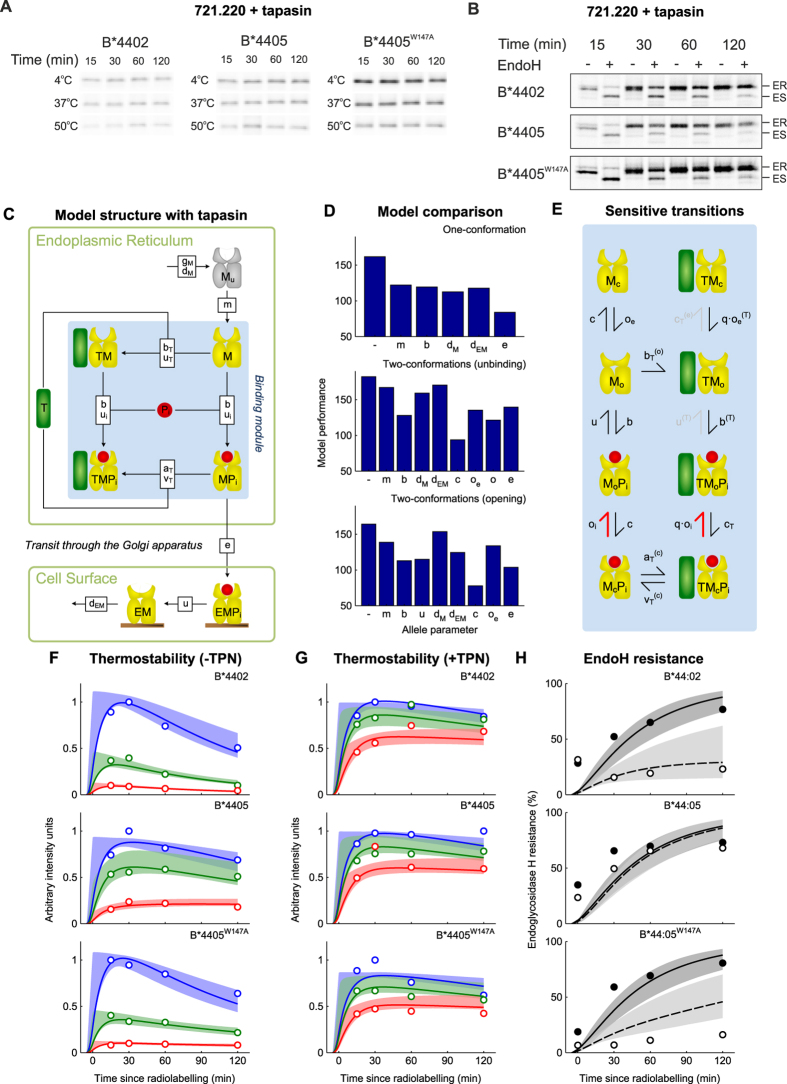
The selection of peptides for presentation at the surface of most nucleated cells by major histocompatibility complex class I molecules (MHC I) is crucial to the immune response in vertebrates. However, the mechanisms of the rapid selection of high affinity peptides by MHC I from amongst thousands of mostly low affinity peptides are not well understood. We developed computational systems models encoding distinct mechanistic hypotheses for two molecules, HLA-B*44:02 (B*4402) and HLA-B*44:05 (B*4405), which differ by a single residue yet lie at opposite ends of the spectrum in their intrinsic ability to select high affinity peptides. We used in vivo biochemical data to infer that a conformational intermediate of MHC I is significant for peptide selection. We used molecular dynamics simulations to show that peptide selector function correlates with protein plasticity, and confirmed this experimentally by altering the plasticity of MHC I with a single point mutation, which altered in vivo selector function in a predictable way. Finally, we investigated the mechanisms by which the co-factor tapasin influences MHC I plasticity. We propose that tapasin modulates MHC I plasticity by dynamically coupling the peptide binding region and α3 domain of MHC I allosterically, resulting in enhanced peptide selector function.


Figures

Figure 1
Figure 1
Structure of the MHC I molecule (A) Ribbon representation of the MHC I molecule HLA-B*44:05 and its three components: a polymorphic heavy chain (yellow), non-covalently bound invariant β2m (yellow) and peptide (red). The polymorphic residue 116 between B*4402 and B*4405 is shown in blue (B) Comparison of B*4402 (PDB: 1M6O, green) and B*4405 (PDB: 1SYV, blue) structures. RMSD between them of 0.3 Å. (C) Combined ribbon and surface representation of the MHC I molecule peptide binding groove.
Figure 2
Figure 2. Computational systems models of the mechanisms of MHC I peptide selection, fit to in vivo peptide selection data for B*4402 and B*4405 in the absence of tapasin.
(A) Time-dependent peptide selection measured with pulse-chase and thermostability in tapasin-deficient cells, as described in materials and methods. Tapasin deficient cultured 220 cells (721.220) were metabolically radiolabelled with 35S-met for 5 min, then chased for the indicated times before being lysed and heated to the temperatures shown (data quantified in F). (B) Cell surface transit measured as percentage endoglycosidase-H (EndoH) resistance. MHC I was immunoprecipitated with W6/32 and treated at the different time points with (+) or without (−) EndoH, which distinguishes between sensitive, pre-cis-Golgi (ES) and resistant (ER) post-cis-Golgi MHC I (data quantified in G). Immunoprecipitations were performed in such a way as to record only MHC I bound to high affinity peptides (10). (C) A general computational systems model of the mechanisms of peptide selection in the absence of tapasin. Shapes represent molecular species and labelled boxes represent reactions and their rate parameters. (D) Different binding mechanisms are illustrated for one-conformation and two-conformation models, where peptide-dependent reactions are indicated by thick red symbols. (E) Comparison of model performance for different parameters taking allele-specific values (allele parameters). The most likely model (lowest BIC score) was the two-conformation model with MHC I opening as the peptide-dependent step and MHC I closing rate c as the allele-dependent parameter. (F,G) Comparison of the most likely model (solid lines) against experimental measurements (circles), with 95% confidence intervals (shaded regions). (F) Quantification of pulse chase experiments shown in panel A (circles), together with model simulations (lines). Red indicates the proportion of MHC I molecules that remained after heating to 50 °C (high affinity peptide-MHC complexes), green indicates heating to 37 °C (medium and high affinity complexes) and blue indicates heating to 4 °C (all complexes). (G) Quantification of cell surface transit experiments shown in panel B (circles), together with model simulations (lines). (H) Marginal posterior density of the allele-specific closing rate c, reflecting the probability of the parameter values, conditional on the measured data and underlying model.
Figure 3
Figure 3. Quantification of protein plasticity for MHC I alleles B*4402, B*4405 and B*4405W147A from molecular dynamics simulations.
(A) Left: Surface representation of peptide bound MHC I. Middle: Ribbon representations of peptide free MHC I. The polymorphism between B*4402 and B*4405 at position 116 in the peptide binding groove (brown) and mutation B*4405W147A (blue). F-pocket distances were measured between the center of mass of helix residues 135–156 and 69–85 (red). Right: Inter-domain distances were measured between peptide binding groove residues 96–100 (red) and α3 residues 220–227 (red). (B–G) Contour plots of the joint probability densities for the conformations of MHC I populated in each simulated condition, as defined by distances in (A). Black crosses indicate the initial structure conformation. Distributions for each individual distance are plotted on the outside of the adjacent axis. (H–J) The motion most correlated with the distance fluctuations across the F-pocket as defined in (A). Cones indicate the direction and amplitude of motion. The range of inter-domain twisting for each molecule is indicated by arrows (as depicted in Figure S5). See also Figures S1–S5.
Figure 4
Figure 4. Peptide selection of B*4405W147A measured in vivo and compared with simulations of computational systems model.
(A) Mutant B*4405W147A has similar peptide binding ability to that of B*4402 and B*4405. This is demonstrated by performing a BFA decay assay with 220. tapasin cell lines expressing each allele. Stability of peptide loaded MHC I over time is measured with the conformation specific antibody W6/32. (B,C) Pulse-chase thermostability and EndoH assays in the absence of tapasin were carried out for B*4405W147A as in Fig. 2A,B, and as described in materials and methods. (D) Combined likelihood score against data for all three alleles in absence of tapasin, for different values of the allele parameter c. An optimum for B*4405W147A is present between the mean posterior values for the other two alleles, as labelled. The areas indicate the 95% confidence intervals for those two parameters. (Middle, Right) simulation values for the maximum likelihood value of c. (E,F) Simulation (lines) of the two-conformation (opening) model with allele parameter c set to the value in panel (D) that best fits the experimental data (i.e. that optimizes the likelihood function). Plotted together with experimental measurements of B*4405W147A (circles). (E) Experiments relate time-dependent peptide selection measured with pulse-chase and thermostability in tapasin-deficient cells (quantification of panel B). Red symbols/lines indicate heating to 50 °C (corresponding to high affinity peptide-MHC complexes), green indicates 37 °C (medium and high affinity complexes) and blue indicates 4 °C (all complexes). (F) Cell surface transit measured as percentage EndoH resistance (quantification of panel (C)).
Figure 5
Figure 5. Quantification of B*4402 plasticity with restrained residues at the tapasin binding site, and measurement of tapasin binding for B*4402, B*4405 and B*4405W147A.
(A) Contour plots of the joint probability densities for the conformations populated by peptide free B*4402 with restrained α3 domain residues 220–227, the location indicated in panel (C). Black crosses indicate the initial structure conformation. Distributions for each individual distance are plotted on the outside of the adjacent axis. Restraint of these residues increases B*4402 plasticity by modulating the peptide binding groove conformation. (B) Contour plots of the joint probability densities for the control simulations, the locations are indicated in panel C. Black crosses indicate the initial structure conformation. Distributions for each individual distance are plotted on the outside of the adjacent axis. Restraint of control residues has little effect on B*4402 plasticity. (C) Sites of the restraints on MHC I corresponding with simulations in panels A and B. (D) B*4405W147A exhibits sustained binding to tapasin, like B*4402, whereas B*4405 does not. Cells were lysed in digitonin to preserve the peptide loading complex, which was then immunoprecipitated with anti-tapasin antibody. Associated transporter associated with antigen processing (TAP) and MHC I (HC) were visualized by Western blot using specific antibodies. See also Figures S1-S5.
Figure 6
Figure 6. Computational systems models of the mechanisms of MHC I peptide selection, fit to in vivo peptide selection data for B*4402, B*4405 and B*4405W147A in the presence and absence of tapasin.
(A) Repeating the thermostability assay shown in Fig. 2A in the presence of tapasin indicates that B*4402 and B*4405W147A now acquire thermostability equal to that of B*4405 (quantified in G). (B) Repeating the pulse chase assay shown in Fig. 2B in the presence of tapasin shows that all alleles select high affinity peptides in the presence of tapasin and traffic to the cell surface (quantified in H). (C) Graphical depiction of the general computational systems model of the mechanisms of peptide selection in the presence of tapasin, as in Fig. 2D. (D) Comparison of model performance for one-conformation and two-conformation models, as in Fig. 2E. The most likely model (with the lowest BIC score) was once again identified as the two-conformation model with MHC I opening as the peptide-dependent step and MHC I closing rate c as the allele-dependent parameter. (E) Flux analysis of the two-conformation model with peptide-dependent opening (including tapasin) reveals an anti-clockwise cycle of tapasin mediated peptide editing (the peptide-specific reactions are shown as thick red symbols, and grey lines indicate unfavorable reactions). (FH) Comparison of model behavior including a function for tapasin, analogous to Fig. 2F,G. Experimental measurements (circles) quantified from Figs 2A,B and 4A,B and panels (A,B) in this figure. In H solid black are + tapasin and dashed/open are – tapasin.

Similar articles

Cited by

References

    1. Townsend A. et al. Defective presentation to class I-restricted cytotoxic T lymphocytes in vaccinia-infected cells is overcome by enhanced degradation of antigen. J Exp Med 168, 1211–1224 (1988). - PMC - PubMed
    1. Bjorkman P. J. et al. The foreign antigen binding site and T cell recognition regions of class I histocompatibility antigens. Nature 329, 512–518 (1987). - PubMed
    1. Bjorkman P. J. et al. Structure of the human class I histocompatibility antigen, HLA-A2. Nature 329, 506–512, doi: 10.1038/329506a0 (1987). - DOI - PubMed
    1. Van Hateren A. et al. The cell biology of major histocompatibility complex class I assembly: towards a molecular understanding. Tissue Antigens 76, 259–275, doi: 10.1111/j.1399-0039.2010.01550.x (2010). - DOI - PubMed
    1. Sercarz E. E. et al. Dominance and crypticity of T cell antigenic determinants. Annu Rev Immunol 11, 729–766, doi: 10.1146/annurev.iy.11.040193.003501 (1993). - DOI - PubMed

Publication types

MeSH terms