. 2015 Oct 20:5:15373.
doi: 10.1038/srep15373.

Interactive Volumetry Of Liver Ablation Zones

Affiliations

Interactive Volumetry Of Liver Ablation Zones

Jan Egger et al. Sci Rep. .

Abstract

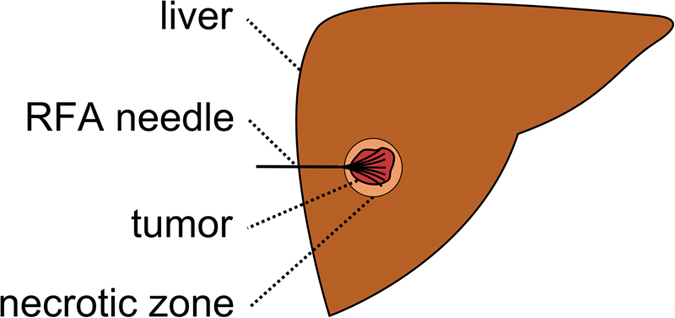
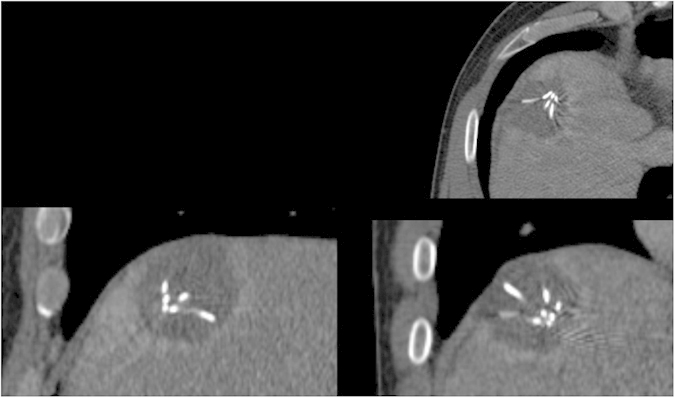
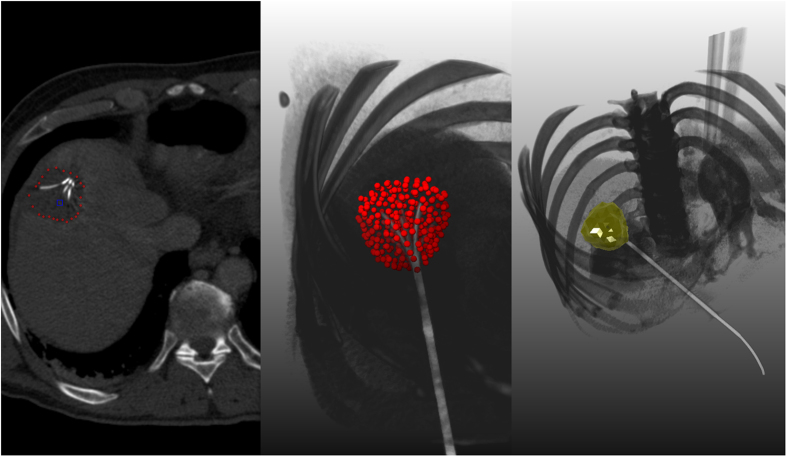
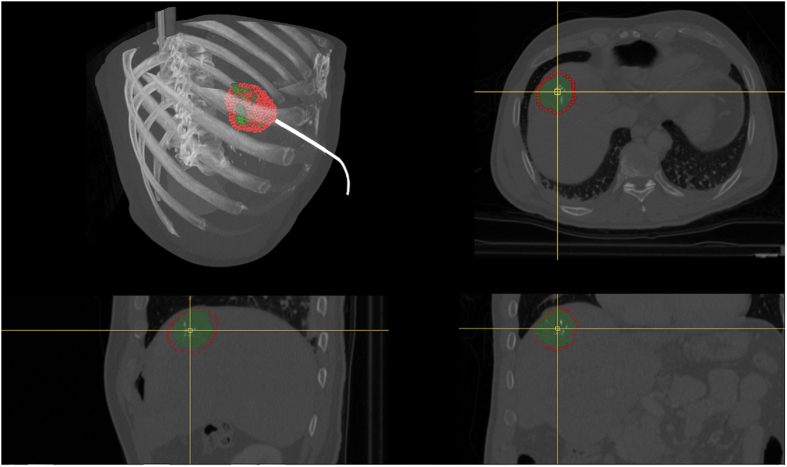
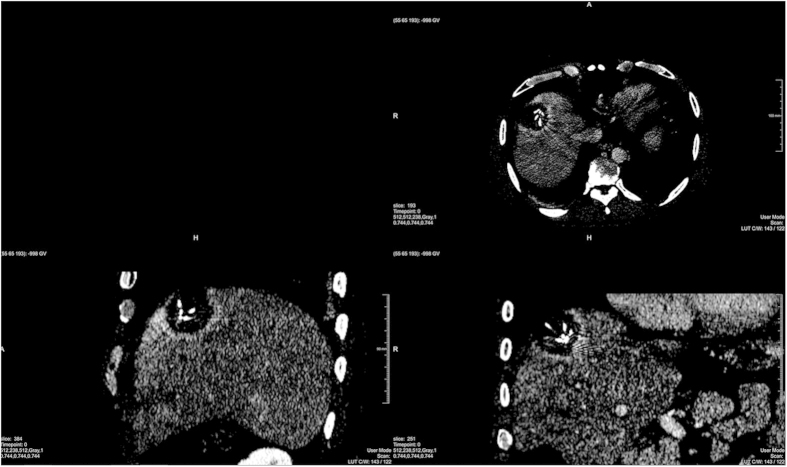
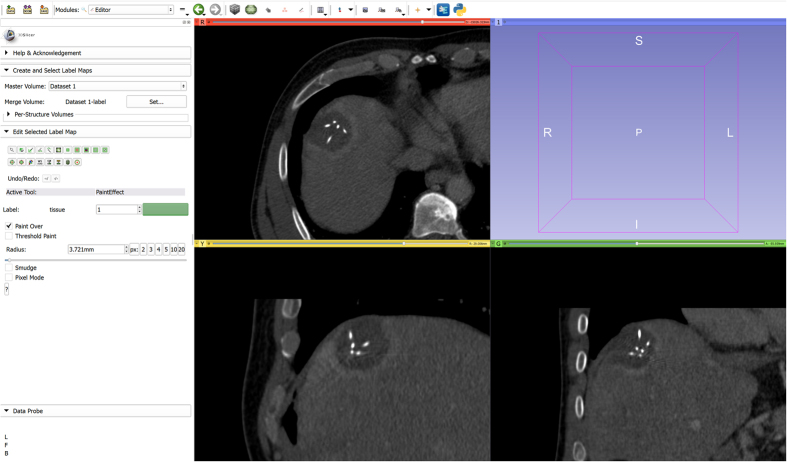
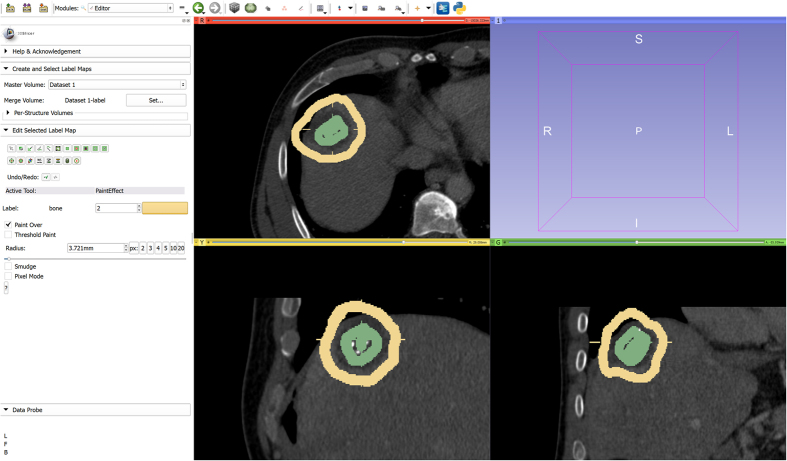
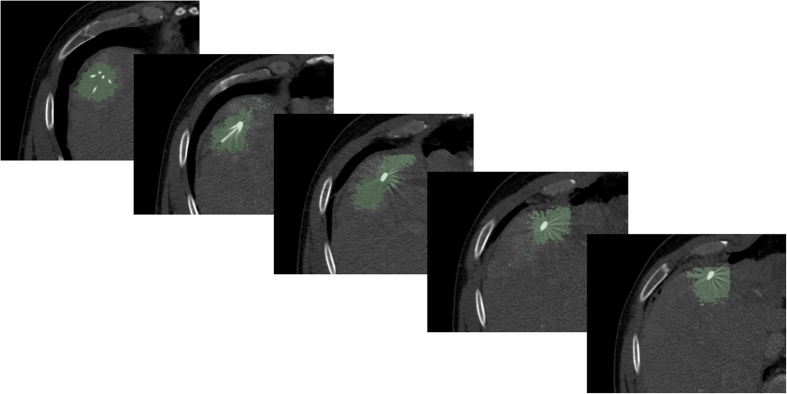
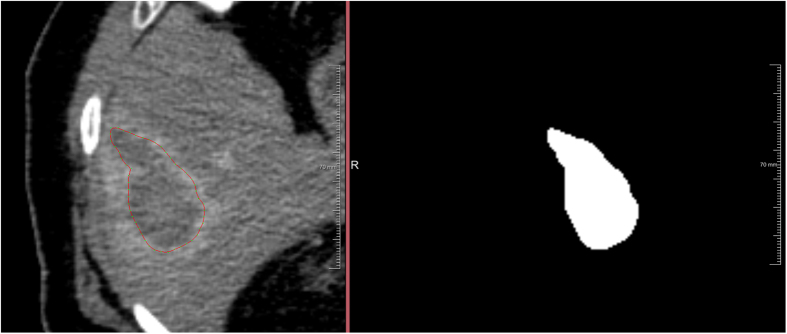
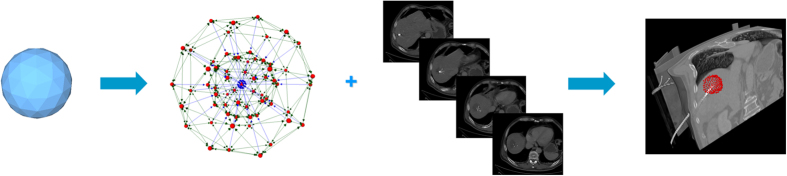
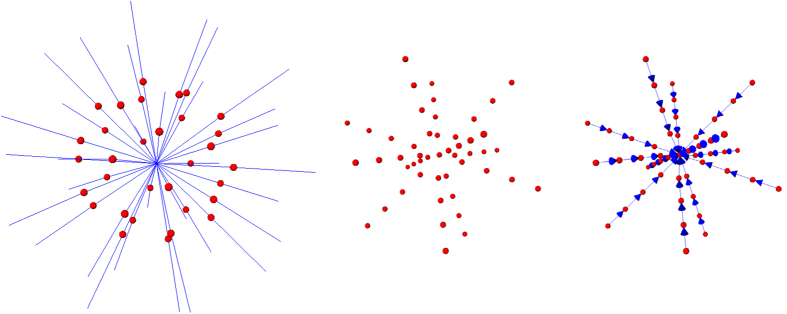
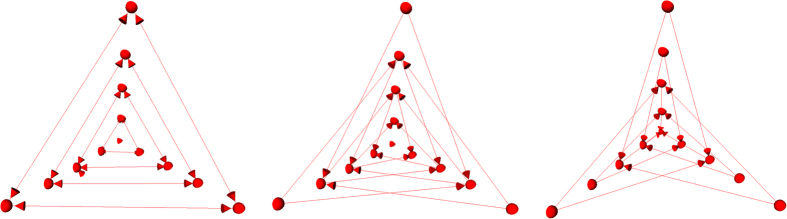
Percutaneous radiofrequency ablation (RFA) is a minimally invasive technique that destroys cancer cells by heat. The heat results from focusing energy in the radiofrequency spectrum through a needle. Amongst others, this can enable the treatment of patients who are not eligible for an open surgery. However, the possibility of recurrent liver cancer due to incomplete ablation of the tumor makes post-interventional monitoring via regular follow-up scans mandatory. These scans have to be carefully inspected for any conspicuousness. Within this study, the RF ablation zones from twelve post-interventional CT acquisitions have been segmented semi-automatically to support the visual inspection. An interactive, graph-based contouring approach, which prefers spherically shaped regions, has been applied. For the quantitative and qualitative analysis of the algorithm's results, manual slice-by-slice segmentations produced by clinical experts have been used as the gold standard (which have also been compared among each other). As evaluation metric for the statistical validation, the Dice Similarity Coefficient (DSC) has been calculated. The results show that the proposed tool provides lesion segmentation with sufficient accuracy much faster than manual segmentation. The visual feedback and interactivity make the proposed tool well suitable for the clinical workflow.


Figures

Figure 1
Figure 1. Schematic view of the liver (brown) with a fully expanded and umbrella-shaped radiofrequency ablation (RFA) needle (black).
The needle tips are located in a liver tumor (red) surrounded by the so called necrotic zone (light brown).
Figure 2
Figure 2. Postinterventional computed tomography (CT) scan of a radiofrequency (RF) ablation with the ablation needle still in place: the upper right window shows an axial plane, the lower left window a sagittal plane and the lower right window a coronal plane.
The RFA needle is easily recognizable, because its umbrella-shaped characteristics show up very bright within the ablation zone inside the liver.
Figure 3
Figure 3. This image shows overall three screenshots of an interactive segmentation result for a postinterventional CT acquisition: a screenshot of an axial plane on the left side and two 3D screenshots on the next two images to the right.
The red dots display the segmentation result in the two images on the left, besides the axial plane contains the user-defined seed point (blue) where the interactive segmentation has been stopped. Finally, the rightmost screenshot includes a closed surface (green) of the interactive segmentation result of the ablation zone, which has been generated from the red dots shown in the middle screenshot. From the closed surface on the other hand, a solid mask can be generated, which is used to determine the Dice Similarity Coefficient (DSC) if compared with a pure manual slice-by-slice expert volumetry. Note: for the native scan please see Fig. 2.
Figure 4
Figure 4. This screenshots present a direct comparison between a pure manual segmentation (green) and a semi-automatic/interactive segmentation (red).
Therefore, the three-dimensional masks of both segmentations (manual/interactive) have been merged and placed within the original dataset at the location of the ablation zone (upper left window). Easily recognizable is the bright stick pointing to the masks, which is the shaft of the RFA needle. The remaining three windows show the planes where the user-defined seed point (yellow cross) has been placed for interactive segmentation result, with the axial plane in the upper right windows, the sagittal plane in the lower left window and the coronal plane in the lower right window. Note: for the native scan please see Fig. 2.
Figure 5
Figure 5. Extreme windowing setting for the acquisition and planes from Fig. 4, making a bright border around the ablation zone recognizable.
Note: for the native scan with an appropriate windowing please see Fig. 2.
Figure 6
Figure 6. Postinterventional CT scan of an RF ablation with the ablation needle still in place loaded into 3D Slicer.
On the left side is the Editor module which also contains the GrowCut algorithm.
Figure 7
Figure 7. GrowCut initialization for the segmentation of the RF ablation zone: the ablated zone is marked in green and the background is marked in yellow on three 2D slices, respectively.
Figure 8
Figure 8. GrowCut segmentation result (green) for the initialization from
Fig. 7. The GrowCut segmentation leaks along the RFA needle, because it cannot handle the large gray value differences between the ablation zone (dark) and the needle (bright). Note: the sharp edges of the segmentation result in the rightmost image occur because the GrowCut implementation in 3D Slicer automatically restricts the segmentation area with a bounding box that depends on the user initialization.
Figure 9
Figure 9. The left side shows a manually outlined ablation zone (red) on a single 2D slice and the right side presents the corresponding voxelized mask (white).
All voxelized 2D slices are merged to one 3D mask representing the whole ablation zone. This manual segmentation is used to calculate the Dice Similarity Coefficient (DSC) with the segmentation result from the algorithm.
Figure 10
Figure 10. Overall workflow of the RF ablation zone segmentation: a sphere (left) is used to construct a graph (second image from the left).
The graph is constructed (not visible to the user) at the user-defined seed point position within the image (third image from the left). Finally, the segmentation result (red) corresponding to the seed point is shown to the user (rightmost image).
Figure 11
Figure 11. More detailed graph construction for intra-edges of the segmentation approach.
Left image: in a first step rays (blue) a send through the surface points (red) of a polyhedron. Middle image: the graph’s nodes are sampled along the rays from the previous image. Right image: the intra-edges (blue arrows) are constructed between the sampled nodes (red).
Figure 12
Figure 12. Principle of the inter-edge constructions (red arrows) between nodes (red dots) that have been sampled along three different rays.
The leftmost image shows the inter-edges for a Δr value of zero. Thus the inter-edges are all on the same “node level”. The image in the middle shows the inter-edges for a Δr value of one, resulting in edges that connect nodes from different “node levels”, however, with a maximum level difference of one. Finally, the rightmost image shows the inter-edges for a Δr value of two, connecting nodes with a “node level” distance of two. Similarly, this practice also applies for larger values of Δr, e.g. three or four and so on.
Figure 13
Figure 13. This figure shall illustrate the course of action of the mincut for different Δr values.
On the left side, the inter-edges for a Δr value of zero have been constructed. Thus the mincut will separate all nodes on the same “node level” to avoid costs for cutting inter-edges. Note that the location of the cut (green) depends here on other factors, like the underlying gray values. Similar to the second image of Fig. 12, the inter-edges for a Δr value have been constructed for the following three rightmost images. As you can see, the mincut has two options for cutting inter-edges (red scissors) producing the same costs: (1.) on the same “node level” (second image from the right) and (2.) cutting on different “node levels” with a node distance on one (third image from the right). However, cutting on different “node levels” with a node distance on two (or greater) will produce higher cost and therefore will automatically be avoided by the mincut algorithm as seen in the rightmost figure. The same principle applies also for larger values of Δr.
Figure 14
Figure 14. This image shows several sampled nodes for a graph that has been bound by edges and weights to the source (red) and the sink (blue).
Besides, the eight intra-edges between the sampled nodes have been generated. As seen, the minimal s-t-cut cuts the third intra-edge and produces a total cost of ninety.
Figure 15
Figure 15. This mincut example adapted from Fig. 14 discloses the benefit of the intra-edges (which have not been generated here): the s-t-cut (green) will avoid cutting the inter-edges to produce an overall “cutting” cost of zero.
Hence, this would no longer ensure that all nodes below a segmented surface in the graph are included to form a closed set.

Similar articles

Cited by

References

    1. Graf D. et al. Multimodal treatment of hepatocellular carcinoma. Eur. J. Intern. Med. 25, 430–437 (2014). - PubMed
    1. Lu D. S. et al. Percutaneous radiofrequency ablation of hepatocellular carcinoma as a bridge to liver transplantation. Hepatology 41, 1130–1137 (2005). - PubMed
    1. Buscarini E. et al. Radiofrequency thermal ablation of liver tumors. Eur. Radiol. 15, 884–894 (2005). - PubMed
    1. Rhim H. & Lim H. K. Radiofrequency ablation of hepatocellular carcinoma: pros and cons. Gut Liver 4, 113–8 (2010). - PMC - PubMed
    1. Wong S. L. et al. American Society of Clinical Oncology 2009 clinical evidence review on radiofrequency ablation of hepatic metastases from colorectal cancer. J. Clin. Oncol. 28, 493–508 (2010). - PubMed

Publication types