. 2016 May;26(5):601-22.
doi: 10.1002/hipo.22545. Epub 2015 Nov 5.

Learning by subtraction: Hippocampal activity and effects of ethanol during the acquisition and performance of response sequences

Affiliations

Learning by subtraction: Hippocampal activity and effects of ethanol during the acquisition and performance of response sequences

Myles J Ketchum et al. Hippocampus. 2016 May.

Abstract

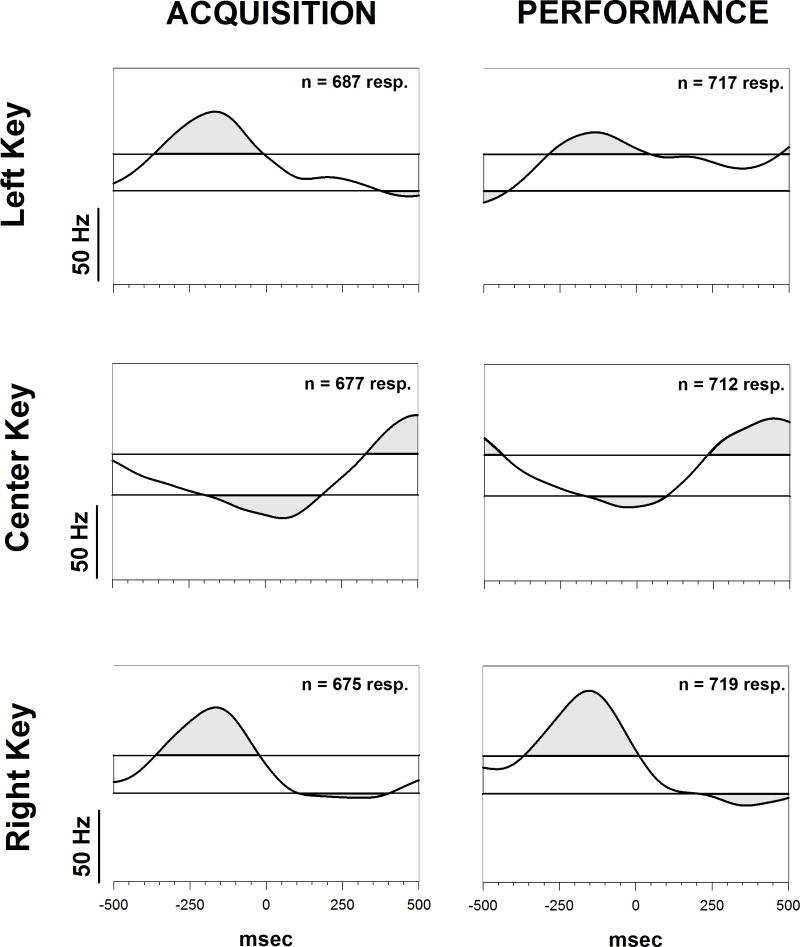
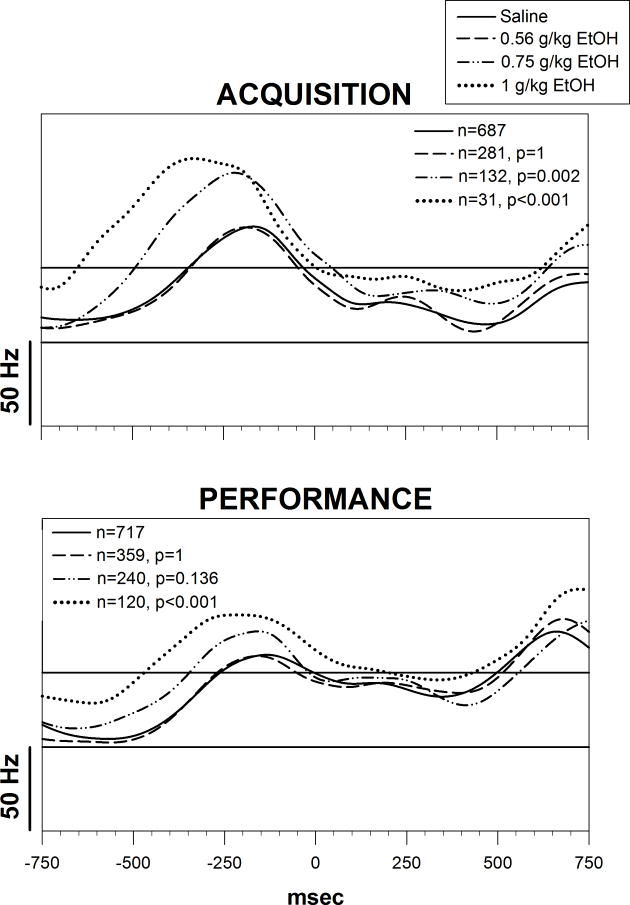
Learning is believed to be reflected in the activity of the hippocampus. However, neural correlates of learning have been difficult to characterize because hippocampal activity is integrated with ongoing behavior. To address this issue, male rats (n = 5) implanted with electrodes (n = 14) in the CA1 subfield responded during two tasks within a single test session. In one task, subjects acquired a new 3-response sequence (acquisition), whereas in the other task, subjects completed a well-rehearsed 3-response sequence (performance). Both tasks though could be completed using an identical response topography and used the same sensory stimuli and schedule of reinforcement. More important, comparing neural patterns during sequence acquisition to those during sequence performance allows for a subtractive approach whereby activity associated with learning could potentially be dissociated from the activity associated with ongoing behavior. At sites where CA1 activity was closely associated with behavior, the patterns of activity were differentially modulated by key position and the serial position of a response within the schedule of reinforcement. Temporal shifts between peak activity and responding on particular keys also occurred during sequence acquisition, but not during sequence performance. Ethanol disrupted CA1 activity while producing rate-decreasing effects in both tasks and error-increasing effects that were more selective for sequence acquisition than sequence performance. Ethanol also produced alterations in the magnitude of modulations and temporal pattern of CA1 activity, although these effects were not selective for sequence acquisition. Similar to ethanol, hippocampal micro-stimulation decreased response rate in both tasks and selectively increased the percentage of errors during sequence acquisition, and provided a more direct demonstration of hippocampal involvement during sequence acquisition. Together, these results strongly support the notion that ethanol disrupts sequence acquisition by disrupting hippocampal activity and that the hippocampus is necessary for the conditioned associations required for sequence acquisition.

Keywords: CA1; micro-stimulation; multi-unit activity; rat; repeated acquisition.


Conflict of interest statement

Conflicts of Interest

The authors declare no conflicts of interest.

Figures

Figure 1
Figure 1
Example of electrode placement location, trace of raw neural activity, and isolated neural units. (A) Trace of raw neural activity (~90 msec) recorded from one stereoelectrode site depicting several neural units (1 and 2). (B) Overlapping plots of several isolated waveforms from two neural units identified from the same recording site depicted in Panel A. (C) Three-dimensional plot comparing waveform characteristics (amplitude, falling slope, rising slope) of the neural units depicted in Panel B, which reveals two distinct clusters (putatively isolating single neurons). (D) Cresyl Violet-stained section showing a representative electrode placement, targeted to the CA1 subfield of the hippocampus.
Figure 2
Figure 2
Example of Gaussian filtered CA1 activity from one recording site (1285, site 1) where a relationship between subject behavior and activity was transparent. (A) Remarkable cadence of activity as the subject worked errorlessly across a 10-minute time span during the first performance component. (B) A 90-second epoch of activity from Panel A highlights the close association of activity and behavior; concomitant correct responses (circles) and reinforcements (triangles) are depicted above the trace of activity. (C) Activity associated with the first response (0 sec) for each bout of responding, averaged from multiple response bouts. (D) Activity associated with reinforcement (0 sec) and the pause that preceded the next bout of responding, averaged from multiple reinforcements. Shaded regions indicate significant increases or decreases in activity (less than or greater than 3 standard deviations from shuffled mean; p < 0.002, 2-tailed).
Figure 3
Figure 3
Gaussian filtered CA1 activity associated with correct responses at each key position (left, center, right) from one recording site (1285, site 1) during the first acquisition and performance components. Activity represented is an average of the 1-second epochs (+/− 500 msec) surrounding correct responses (0 msec) from five test sessions following saline administration. Shaded regions indicate significant increases or decreases in activity (less than or greater than 3 standard deviations from shuffled mean; p < 0.002, 2-tailed).
Figure 4
Figure 4
Gaussian filtered CA1 activity that was associated with the first response in each of the three sequence completions required for reinforcement (i.e., the first, fourth, and seventh responses) at one recording site (1285, site 1). Each graph depicts responses on the right key (0 msec) when the first correct response in the acquisition and performance sequence was a right-key response (i.e., R-L-C and R-C-L, respectively). Activity represented is an average of the 1-second epochs (+/− 500 msec) from two test sessions following saline administration. The pattern of activity surrounding a response was not significantly different between acquisition and performance components. Activity associated with the first response on the right key was significantly larger than the fourth (p < 0.001 in acquisition, p < 0.001 in performance)and seventh responses (p = 0.007 in acquisition, p < 0.001 in performance), whereas activity associated with the fourth and seventh was not significantly different (p = 0.96 in acquisition, p = 1 in performance). Shaded regions indicate significant increases or decreases in activity (less than or greater than 3 standard deviations from shuffled mean; p < 0.002, 2-tailed).
Figure 5
Figure 5
One-second epochs (+/− 500 msec) of Gaussian filtered CA1 activity surrounding correct left-key responses (0 msec) emitted during the third sequence required for reinforcement at one recording site (1285, site 1). The upper and lower panels show the accumulating activity associated with the initial 15 responses (top panels) and last 15 responses (bottom panels) of the first acquisition and performance components. The first response of each 15 responses is on the bottom, whereas the last is on the top. The vertical bar to the left is calibrated to the 15th response, and the vertical line overlying activity indicates the cumulative peak.
Figure 6
Figure 6
Effects of increasing doses of ethanol on the mean response rate (upper panels) and percentage of errors (lower panels) for subjects (n=5) responding during each of the acquisition (left panels) and performance (right panels) components. Shaded regions represent the effects of saline (control) administration (+/− 1 SEM). Symbols with vertical lines represent group means (+/− 1 SEM) for response rate in responses/min or percentage of errors. Crosses and brackets indicate main effects of dose (1 and 1.33 g/kg) on response rate in the both acquisition (p=0.04 and p<0.001, respectively) and performance (p=0.041 and p=0.025, respectively) components. There was also a main effect of dose (1.33 g/kg) on percent errors in acquisition (p=0.022). The asterisk and brackets indicate that all of the doses of ethanol uniformly increased percent errors during the first acquisition component (p<0.001). Numerical values in parentheses and adjacent to a symbol indicate the number of subjects represented by that point (e.g., some subjects did not reach a third acquisition component due to the rate-decreasing effects of ethanol).
Figure 7
Figure 7
Within-session pattern of errors for five subjects following saline (shaded region, +/− 1 SEM) or ethanol administration in the acquisition (top panel) and performance (bottom panel) components. Symbols with vertical lines represent group means (+/− 1 SEM) at different doses of ethanol (0.56–1.33 g/kg), and data are plotted as the cumulative number of errors per bin of 60 consecutive responses. Symbols without vertical bars represent instances in which the variability is encompassed by the point.
Figure 8
Figure 8
Mean blood ethanol concentrations for three subjects following ethanol administration. B.E.C. samples were obtained either 15 minutes after the start of the session or 5 minutes after the session ended. Samples for the early time point were collected 30 minutes following acute ethanol administration, which was 15 minutes after the initiation of the behavioral session. Symbols with vertical lines represent group means (+/− 1 SEM) for the different doses of ethanol (0.56–1.33 g/kg). Symbols without vertical bars represent instances in which the variability is encompassed by the point.
Figure 9
Figure 9
Within-session pattern of responding for one subject (1285) following the administration of saline (top record) or two intermediate doses of ethanol (0.75 and 1 g/kg, middle and bottom records respectively). Each cumulative record shows the pattern of responding during the acquisition (A) and performance (P) components of the two-component operant procedure. As illustrated by the top insert to the left of the cumulative record, the response pen (top line) stepped upward with each correct response and was deflected downward following each completion of the three-response sequence. The slope of the stepping pen (top line) reflects the rate of correct responding. Errors are indicated by the event pen (bottom line), which was deflected for 5 seconds during each timeout period. The end of a component (40 reinforcers or 20 minutes) reset the response pen, and all sessions terminated after 200 reinforcers or 80 minutes, whichever occurred first. Acquisition and performance components alternated across sessions. Below each cumulative record are traces of Gaussian filtered CA1 activity from three recording sites during those sessions. The insert to the left of the cumulative record depicts a vertical bar calibrated to 20 Hz that can be applied to each trace of activity.
Figure 10
Figure 10
Representative traces of 90 seconds of Gaussian filtered CA1 activity from one recording site (1339, site 1) obtained during exposure to a novel environment (i.e., a plastic container with wood-chip bedding, top trace) or following saline (middle trace) or ethanol administration (1.33 g/kg, bottom trace) in the operant chamber. Recordings in the novel environment (i.e., non-contextual) occurred several hours after operant test sessions and subjects were free to explore the environment for several minutes. Traces obtained following saline or ethanol administration were taken at equal time points during the first acquisition component. Concomitant correct responses (white circles), errors (black squares), and reinforcement (black triangles) are displayed above the traces.
Figure 11
Figure 11
Dose-dependent effects of ethanol on CA1 activity from one recording site (1285, site 1) during the initial acquisition and performance components of a session. Each line depicts an average of Gaussian filtered activity reconstructed from 1.5 seconds (+/− 750 msec) surrounding correct left-key responses (0 msec) following the administration of saline or increasing concentrations of ethanol (0.56 – 1 g/kg). Modulations falling outside the confidence intervals (horizontal lines) indicate significant increases or decreases in activity (less than or greater than 3 standard deviations from shuffled mean; p < 0.002, 2-tailed). Comparisons of the area outside the confidence intervals (constructed from saline sessions) between saline and each dose of ethanol are indicated by the p-values.
Figure 12
Figure 12
Within-session pattern of responding for one subject (1339) during baseline conditions (top record) and during hippocampal micro-stimulation (15 uA) when the session started with either an acquisition (middle record) or a performance (bottom record) component. Each cumulative record shows the pattern of responding during acquisition (A) and performance (P) components of the two-component operant procedure. For additional details regarding the cumulative records of responding, see Figure 9. Micro-stimulations (rate: 100 Hz; pulse: 0.2 msec), which are indicated by the arrows, were delivered in 10 second trains every 5 minutes during the initial acquisition and performance components.
Figure 13
Figure 13
Effects of increasing micro-stimulation current intensity (1–30 uA) on the overall response rate and percentage of errors in two subjects (1339 and 1365) responding during the acquisition (unfilled symbols) and performance (filled symbols) components. Although micro-stimulation was only delivered during the first two components, the data for the entire session are plotted. Symbols with vertical lines represent the mean and range for response rate in responses/min (upper panels) or percentage of errors (lower panels) during control conditions and following hippocampal (circles) or ventral orbital cortex (squares) micro-stimulation. Control ranges were created from six or more baseline sessions, and most micro-stimulation intensities were administered at least twice. Asterisks indicate an effect of micro-stimulation (mean outside control range). Symbols without vertical bars represent either single determinations for that particular intensity or instances in which the variability is encompassed by the point.
Figure 14
Figure 14
Effects of increasing micro-stimulation current intensity (1–30 uA) on the within-session pattern of errors for two subjects (1339 and 1365) responding in the acquisition (top panel) and performance (bottom panel) components. Shaded regions represent the range of the baseline pattern of errors. Symbols with vertical lines represent the mean and range for different micro-stimulation intensities, and data are plotted as the cumulative number of errors per bin of 60 consecutive responses. Control ranges were created from six or more baseline sessions, and most micro-stimulation intensities were administered at least twice. Symbols without vertical bars represent either single determinations for that particular intensity or instances in which the variability is encompassed by the point.

Similar articles

Cited by

References

    1. Arai A, Lynch G. Factors regulating the magnitude of long-term potentiation induced by theta pattern stimulation. Brain Research. 1992;598:173–184. - PubMed
    1. Berger TW, Berry SD, Thompson RF. Role of the hippocampus in classical conditioning of aversive and appetitive behaviors. In: Isaacson RL, Pribram KI-I, editors. The Hippocampus. New York: Plenum Press; 1986. pp. 203–239.
    1. Boren JJ. Repeated acquisition of new behavioral chains. American Psychologist. 1963;17:421. (Abstract)
    1. Boren JJ, Devine DD. The repeated acquisition of behavioral chains. Journal of the Experimental Analysis of Behavior. 1968;11:651–660. - PMC - PubMed
    1. Bostock E, Muller RU, Kubie JL. Experience dependent modifications of hippocampal place cell firing. Hippocampus. 1991;2:193–205. - PubMed

Publication types