. 2015 Dec 20;24(25):7390-405.
doi: 10.1093/hmg/ddv439. Epub 2015 Oct 19.

Amyotrophic lateral sclerosis and denervation alter sphingolipids and up-regulate glucosylceramide synthase

Affiliations

Amyotrophic lateral sclerosis and denervation alter sphingolipids and up-regulate glucosylceramide synthase

Alexandre Henriques et al. Hum Mol Genet. .

Abstract

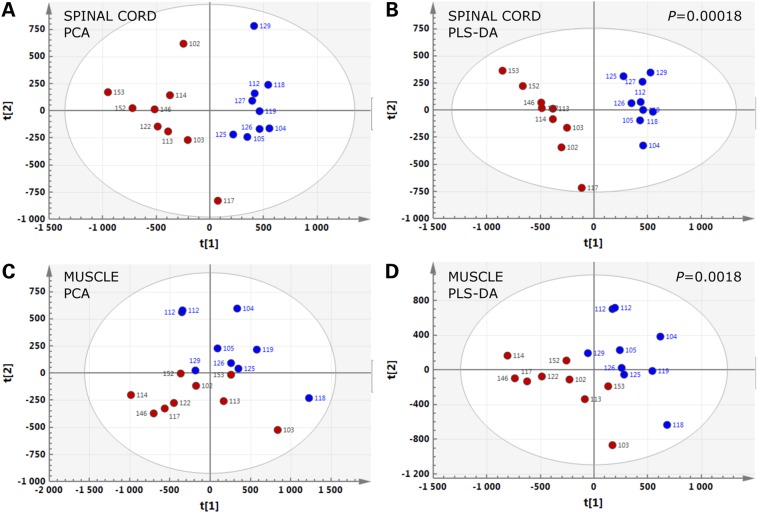
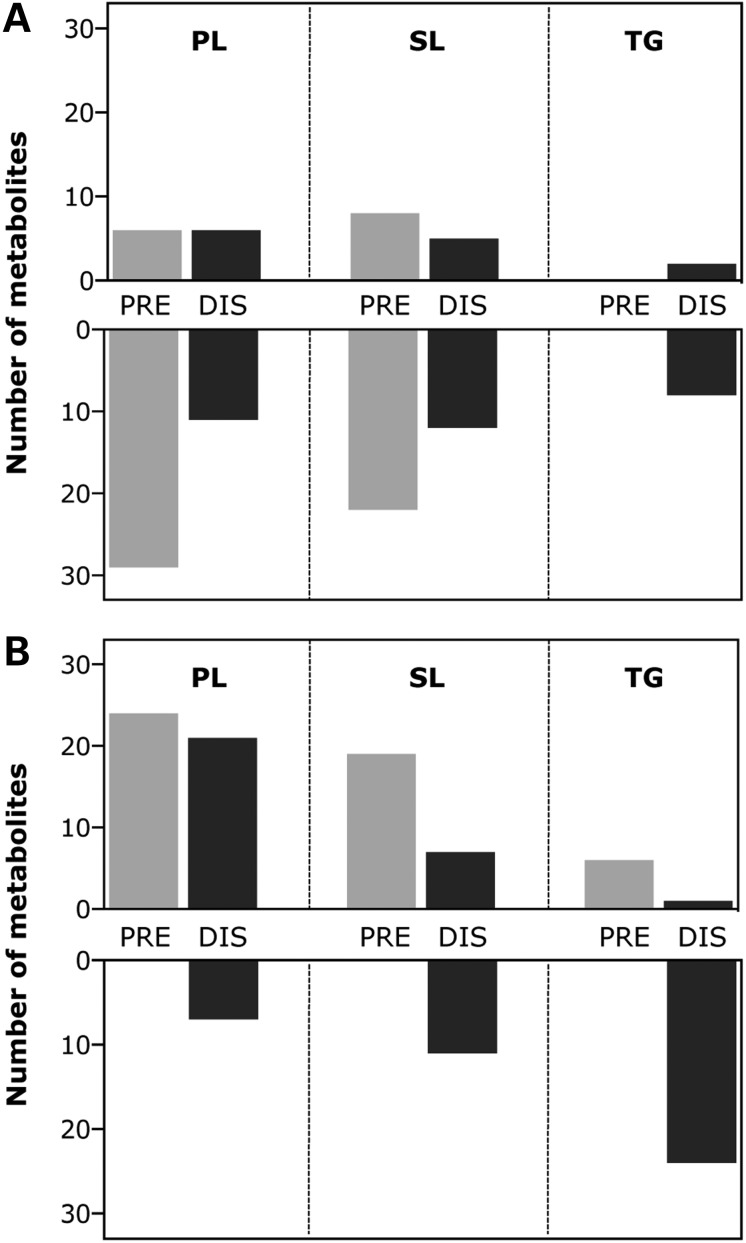
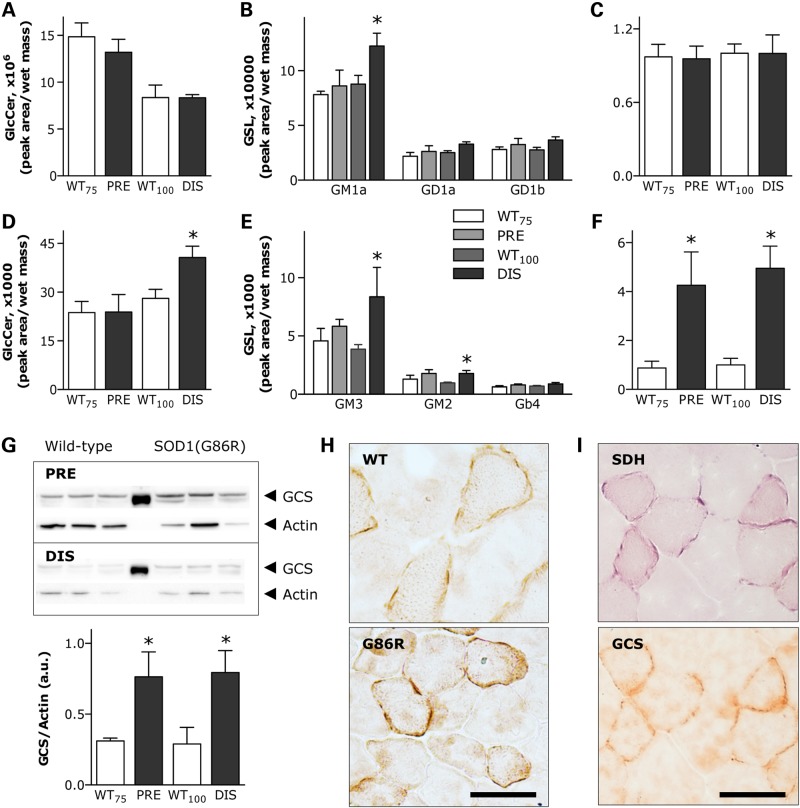
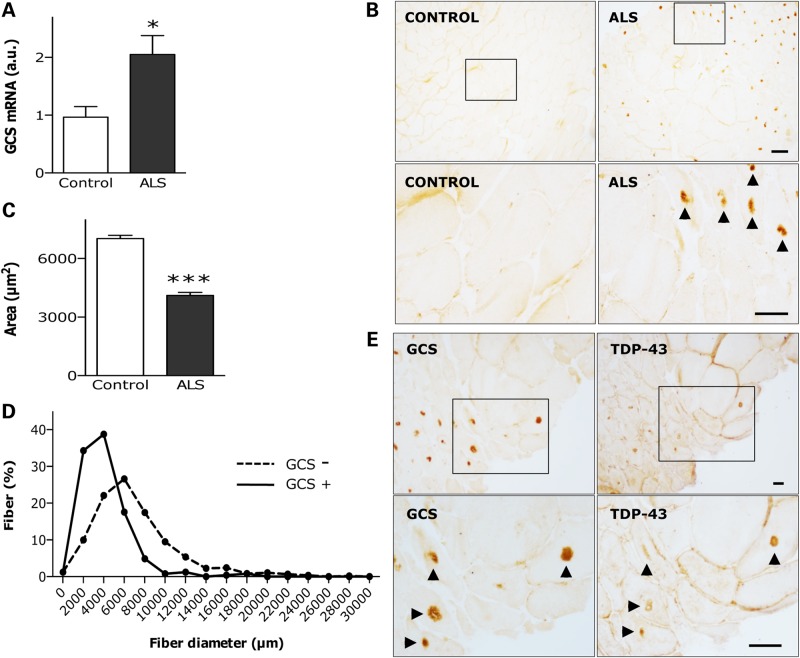
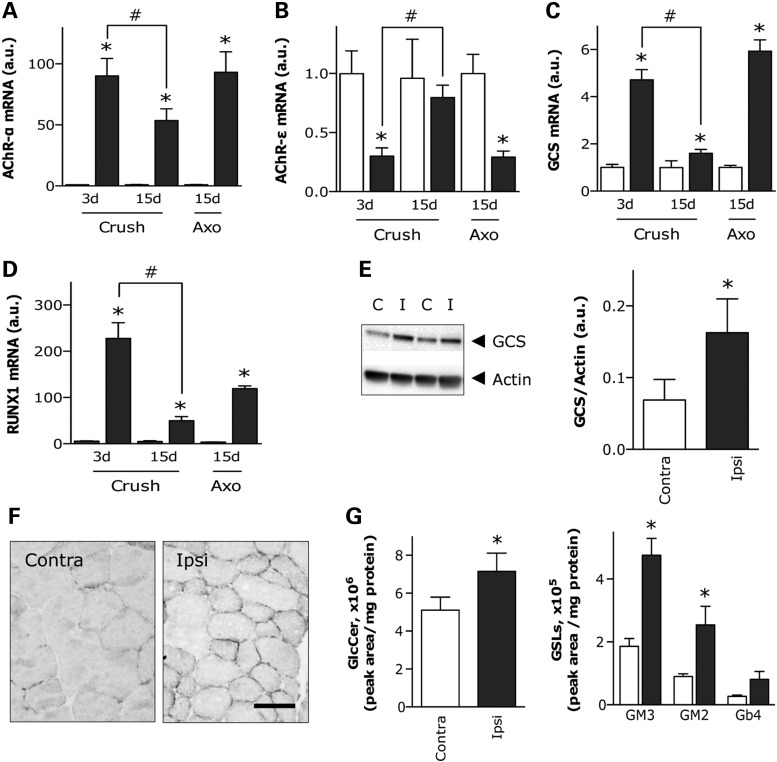
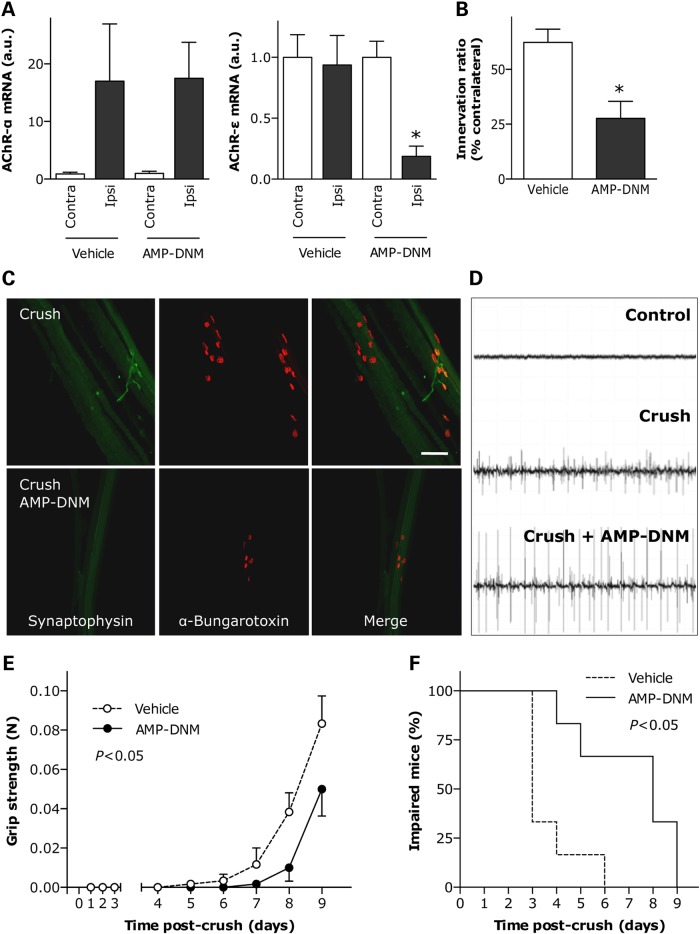
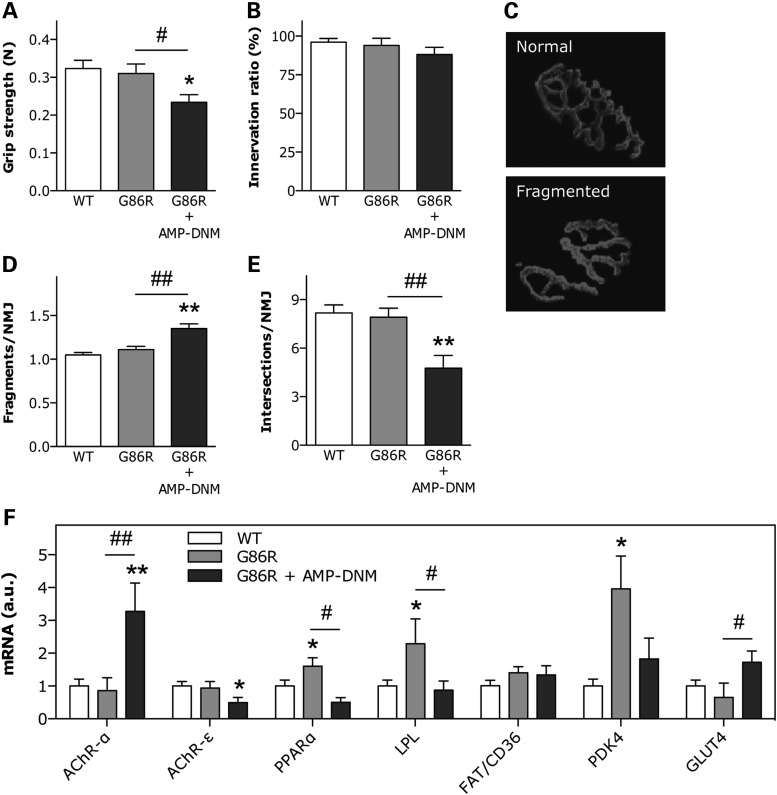
Amyotrophic lateral sclerosis (ALS) is a fatal adult-onset disease characterized by upper and lower motor neuron degeneration, muscle wasting and paralysis. Growing evidence suggests a link between changes in lipid metabolism and ALS. Here, we used UPLC/TOF-MS to survey the lipidome in SOD1(G86R) mice, a model of ALS. Significant changes in lipid expression were evident in spinal cord and skeletal muscle before overt neuropathology. In silico analysis also revealed appreciable changes in sphingolipids including ceramides and glucosylceramides (GlcCer). HPLC analysis showed increased amounts of GlcCer and downstream glycosphingolipids (GSLs) in SOD1(G86R) muscle compared with wild-type littermates. Glucosylceramide synthase (GCS), the enzyme responsible for GlcCer biosynthesis, was up-regulated in muscle of SOD1(G86R) mice and ALS patients, and in muscle of wild-type mice after surgically induced denervation. Conversely, inhibition of GCS in wild-type mice, following transient peripheral nerve injury, reversed the overexpression of genes in muscle involved in oxidative metabolism and delayed motor recovery. GCS inhibition in SOD1(G86R) mice also affected the expression of metabolic genes and induced a loss of muscle strength and morphological deterioration of the motor endplates. These findings suggest that GSLs may play a critical role in ALS muscle pathology and could lead to the identification of new therapeutic targets.


Figures

Figure 1.
Figure 1.
Lipidomic signatures in spinal cord and muscle of SOD1(G86R) mice. PCA (A and C) and PLS-DA (B and D) score plots showing the spatial distribution of SOD1(G86R) mice at the pre-symptomatic stage (blue circles, n = 9) and WT littermates (red circles, n = 9), according to the lipidomic profiles of spinal cord (A and B) and muscle (C and D).
Figure 2.
Figure 2.
Major changes in three lipid families in spinal cord and muscle of SOD1(G86R) mice. Distribution of differentially regulated phospholipid (PL), sphingolipid (SL) and triglyceride (TG) species in spinal cord (A) and muscle (B) of pre-symptomatic (PRE, light-colored bars, n = 9) and symptomatic (DIS, dark-colored bars, n = 9) SOD1(G86R) mice compared with WT littermates. Up- or down-regulated metabolites in each tissue are indicated in upper and lower panels, respectively.
Figure 3.
Figure 3.
GlcCer/GSL metabolism in spinal cord and muscle of SOD1(G86R) mice. HPLC quantification of GlcCer and several GSLs in spinal cord (A and B) and muscle (D and E) of pre-symptomatic (PRE) and symptomatic (DIS) SOD1(G86R) mice compared with corresponding WT littermates. Only detected main peaks of gangliosides are shown in each tissue. *P < 0.05 versus corresponding WT, n = 6. Relative GCS mRNA levels in spinal cord (C) and muscle (F) of mice as in A. *P < 0.05 versus corresponding WT, n = 6–9. (G) GCS protein levels, as determined by western blot (upper panel), in muscle of mice as in A. Lower panel shows quantification of immunoblots using actin protein levels as internal reference. *P < 0.05 versus corresponding WT, n = 3. (H) Representative photomicrographs showing GCS immunostaining on cross-sections of WT and SOD1(G86R) muscle. Scale bar, 50 µm. (I) Representative photomicrographs showing mitochondrial SDH enzymatic activity and GCS immunostaining within the same myofibers on adjacent cross-sections. Scale bar, 50 µm.
Figure 4.
Figure 4.
UGCG expression in human ALS muscle. (A) Relative GCS mRNA levels in deltoid muscle of 8 ALS patients and 12 control subjects. *P < 0.05. (B) Representative photomicrographs showing GCS immunostaining on cross-sections of vastus lateralis muscle of control (left panels) and ALS (right panels) individuals. Lower panels are magnifications of upper insets. Immunoreactive inclusions are indicated by arrow heads. Scale bar, 50 µm. Cross-sectional area of fibers (C), and distribution of fiber diameters (D) in sections as in B. Measurements were performed on 579 and 245 fibers from 4 control subjects and 6 ALS patients, respectively. ***P < 0.001. (E) Representative photomicrographs showing immunoperoxidase staining of GCS (left panels) and TDP-43 (right panels) on adjacent cross-sections of vastus lateralis muscle in ALS patients. Lower panels are magnifications of upper insets. Immunoreactive inclusions are indicated by arrow heads. Scale bars, 100 µm in upper panels, and 200 µm in lower panels.
Figure 5.
Figure 5.
GCS expression in denervated muscle of WT mice. Relative mRNA levels of AChR-α (A), AChR-ε (B), GCS (C) and RUNX1 (D) in muscle of WT mice submitted to sciatic nerve crush or axotomy (Axo). Muscles were processed at the indicated days post-lesion. Ipsilateral muscles (red bars) were compared with contralateral muscles (white bars) in the same animal. *P < 0.05 versus corresponding contralateral muscle, #P < 0.05 versus preceding time point following nerve crush, n = 5–7. (E) GCS protein levels, as determined by western blot (a representative blot is shown in the left panel), in muscle of WT mice submitted to nerve crush as in A. Right panel shows quantification of immunoblots using actin protein levels as internal reference. *P < 0.05, n = 8. (F) Representative photomicrographs showing GCS immunostaining on cross-sections of contralateral and ipsilateral muscle as in A. Scale bar, 50 µm. (G) HPLC quantification of GlcCer (left panel) and several GSLs (right panel) in muscle of WT mice submitted to sciatic nerve crush as in A. Only detected main peaks of gangliosides are shown. *P < 0.05 versus corresponding contralateral muscle, n = 7–8.
Figure 6.
Figure 6.
Effect of inhibition of GCS enzymatic activity on denervated muscle of WT mice. (A) HPLC quantification of GlcCer in muscle of WT mice treated with AMP-DNM. *P < 0.05, n = 10. (B) Cross-sectional area of fibers in muscle submitted to sciatic nerve crush in the absence (Vehicle) or presence of AMP-DNM. Ipsilateral and contralateral muscles were processed 10 days after lesion. *P < 0.05 versus corresponding contralateral muscle, n = 5. (C) Relative mRNA levels of PGC1α, PPARα, LPL, FAT/CD36 and PDK4 in muscle of mice as in B. *P < 0.05 versus corresponding contralateral muscle, #P < 0.05 versus vehicle, n = 3–8.
Figure 7.
Figure 7.
Effect of inhibition of GCS enzymatic activity on motor function recovery after nerve lesion in WT mice. (A) Relative mRNA levels of AChR-α (left panel) and AChR-ε (right panel) in muscle of WT mice submitted to sciatic nerve crush in the absence (Vehicle) or presence of AMP-DNM. Ipsilateral and contralateral muscles were processed 10 days after lesion. *P < 0.05 versus corresponding contralateral muscle, n = 4. (B and C) Proportion of properly innervated neuromuscular junctions after 10 days of sciatic nerve crush, as determined by co-labeling with anti-synaptophysin antibody (green) and rhodamine-conjugated α-bungarotoxin (red). A total of 100–150 neuromuscular junctions per animal were analyzed. Examples of labeled neuromuscular junctions are shown in C. Scale bar, 500 µm. *P < 0.05 versus vehicle, n = 5–6. (D) Representative electromyographic recordings in muscle of WT mice submitted to sciatic nerve crush in the absence (Crush, middle panel) or presence (Crush+AMP-DNM, lower panel) of GCS inhibitor. Upper panel shows non-denervated muscle. (E) Restoration of hind limb muscle grip strength in vehicle- or AMP-DNM-treated WT mice at the indicated times following sciatic nerve crush. *P < 0.05, n = 5–6. (F) Kaplan–Meier curves showing the proportion of WT mice unable to exhibit toe spreading as a function of time following sciatic nerve crush in the absence (vehicle) or presence of AMP-DNM. P < 0.05, n = 6.
Figure 8.
Figure 8.
Effect of inhibition of GCS enzymatic activity on SOD1(G86R) mice. (A) Hind limb muscle grip strength in WT and SOD1(G86R) mice in the absence or presence of AMP-DNM for 10 days. *P < 0.05 versus WT, #P < 0.05 versus untreated SOD1(G86R), n = 5–6. (B) Proportion of properly innervated neuromuscular junctions after 10 days of AMP-DNM treatment, as determined by co-labeling with anti-synaptophysin antibody and rhodamine-conjugated α-bungarotoxin. A total of 100–150 neuromuscular junctions per animal were counted, n = 4–6. Examples of normal and fragmented postsynaptic apparatus are shown in C. Number of separate postsynaptic gutters (D) and gutter intersections (E) per neuromuscular junction in mice as in A. A total of 20–25 neuromuscular junctions per animal were analyzed. **P < 0.01 versus WT, ##P < 0.01 versus untreated SOD1(G86R), n = 4. (F) Relative mRNA levels of AChR-α, AChR-ε, PPARα, LPL, FAT/CD36 PDK4 and GLUT4 in muscle of mice as in A. *P < 0.05, **P < 0.01 versus WT, #P < 0.05, ##P < 0.01 versus untreated SOD1(G86R), n = 4–6.

References

    1. Kiernan M.C., Vucic S., Cheah B.C., Turner M.R., Eisen A., Hardiman O., Burrell J.R., Zoing M.C. (2011) Amyotrophic lateral sclerosis. Lancet, 377, 942–955. - PubMed
    1. Rosen D.R., Siddique T., Patterson D., Figlewicz D.A., Sapp P., Hentati A., Donaldson D., Goto J., O'Regan J.P., Deng H.X. et al. (1993) Mutations in Cu/Zn superoxide dismutase gene are associated with familial amyotrophic lateral sclerosis. Nature, 362, 59–62. - PubMed
    1. Renton A.E., Chiò A., Traynor B.J. (2014) State of play in amyotrophic lateral sclerosis genetics. Nat. Neurosci., 17, 17–23. - PMC - PubMed
    1. Gurney M.E., Pu H., Chiu A.Y., Dal Canto M.C., Polchow C.Y., Alexander D.D., Caliendo J., Hentati A., Kwon Y.W., Deng H.X. et al. (1994) Motor neuron degeneration in mice that express a human Cu, Zn superoxide dismutase mutation. Science, 264, 1772–5. - PubMed
    1. Ripps M.E., Huntley G.W., Hof P.R., Morrison J.H., Gordon J.W. (1995) Transgenic mice expressing an altered murine superoxide dismutase gene provide an animal model of amyotrophic lateral sclerosis. Proc. Natl Acad. Sci. USA, 92, 689–693. - PMC - PubMed

Publication types