. 2016 Jan;21(1):155-166.
doi: 10.1007/s12192-015-0648-2.

Differential expression of endoplasmic reticulum stress-response proteins in different renal tubule subtypes of OVE26 diabetic mice

Affiliations

Differential expression of endoplasmic reticulum stress-response proteins in different renal tubule subtypes of OVE26 diabetic mice

Michelle T Barati et al. Cell Stress Chaperones. 2016 Jan.

Abstract

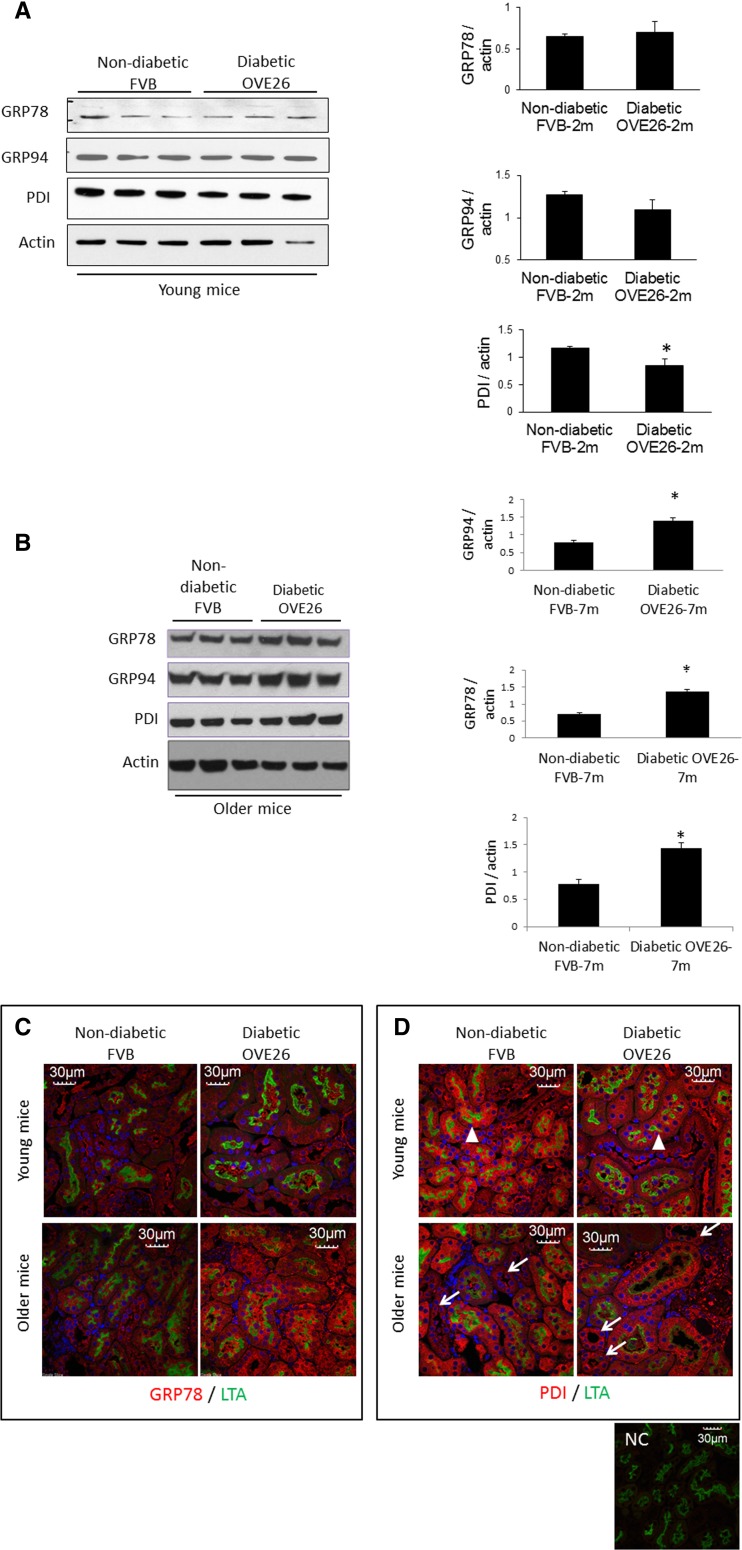
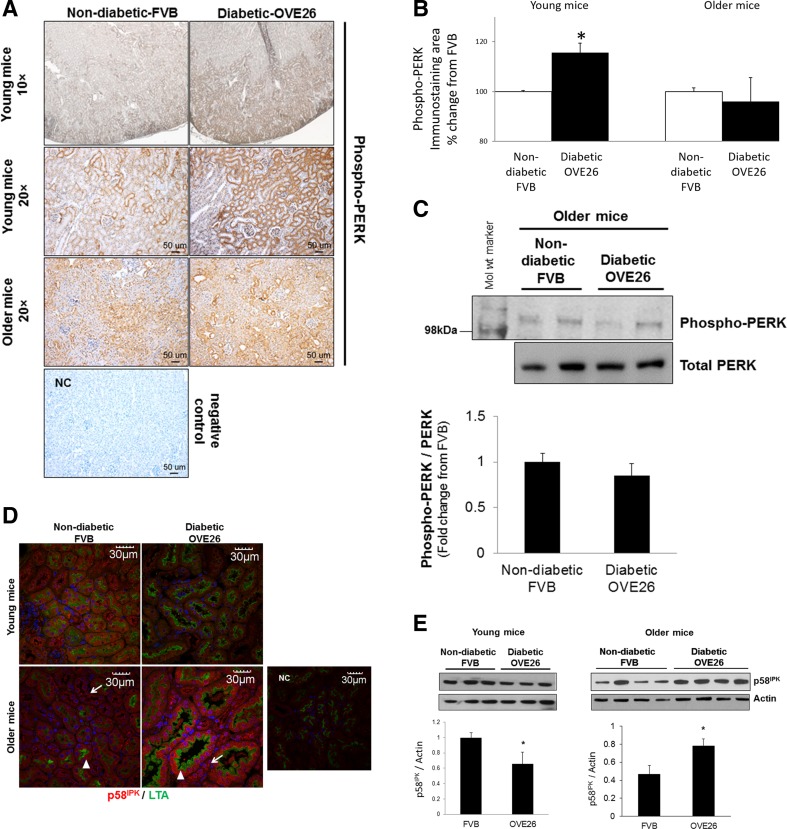
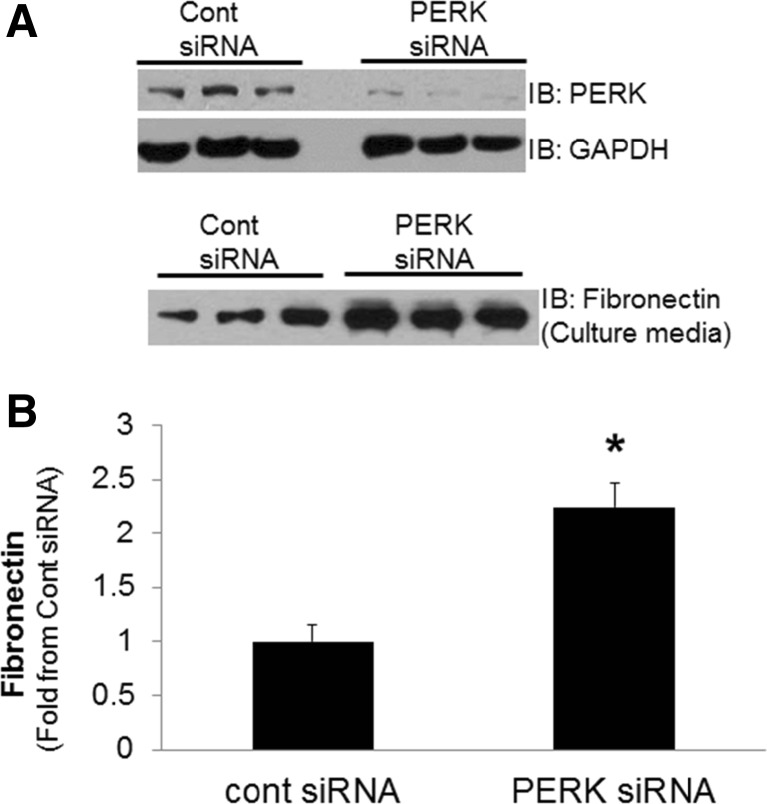
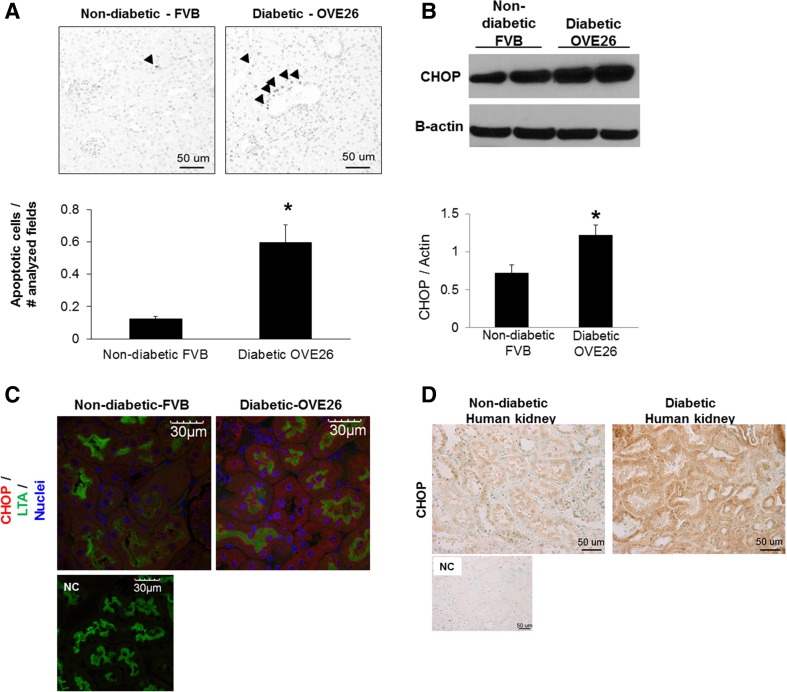
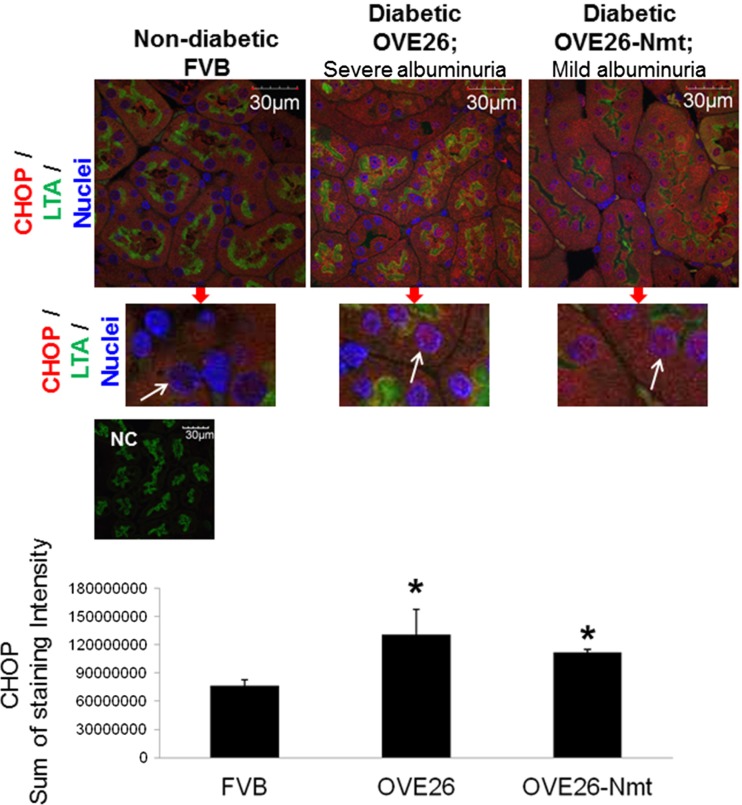
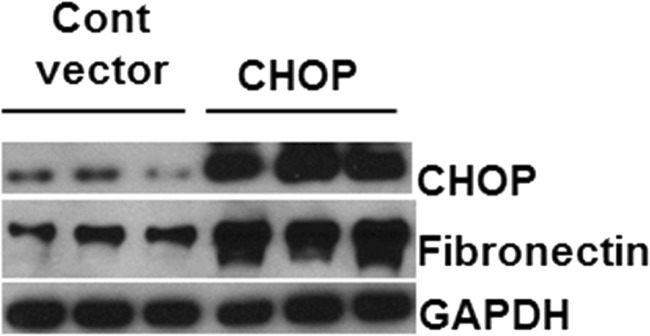
Regulation of the endoplasmic reticulum (ER) stress-response pathway during the course of diabetes specifically in renal tubules is unclear. Since tubule cell dysfunction is critical to progression of diabetic nephropathy, this study analyzed markers of ER stress response and ER chaperones at different stages of diabetes and in different renal tubule subtypes of OVE26 type-1 diabetic mice. ER stress-responseinduced chaperones GRP78, GRP94, and protein disulfide isomerase (PDI) were increased in isolated cortical tubules of older diabetic mice, while PDI was decreased in tubules of young diabetic mice. Immunofluorescence staining of kidneys from older mice showed GRP78 and PDI upregulation in all cortical tubule segments, with substantial induction of PDI in distal tubules. Protein kinase RNA-like endoplasmic reticulum kinase (PERK) phosphorylation was increased in cortical tubules of young diabetic mice, with no differences between older diabetic and control mice. Expression of ER stress-induced PERK inhibitor p58IPK was decreased and then increased in all tubule subtypes of young and older mice, respectively. Knockdown of PERK by small interfering RNA (siRNA) increased fibronectin secretion in cultured proximal tubule cells. Tubules of older diabetic mice had significantly more apoptotic cells, and ER stress-induced proapoptotic transcription factor C/EBP homologous protein (CHOP) was increased in proximal and distal tubules of diabetic mice and diabetic humans. CHOP induction in OVE26 mice was not altered by severity of proteinuria. Overexpression of CHOP in cultured proximal tubule cells increased expression of fibronectin. These findings demonstrate differential ER stress-response signaling in tubule subtypes of diabetic mice and implicate a role for PERK and CHOP in tubule cell matrix protein production.


Figures

Fig. 1
Fig. 1
Differential expression of ER-resident chaperones in tubules of diabetic mice. Expression of GRP78, GRP94, and PDI protein was analyzed in isolated cortical tubules from OVE26 diabetic and FVB non-diabetic mice. a, b Immunoblot of ER-resident chaperones in isolated tubules of young and older and 2- and 7-month-old mice, respectively. Bar graphs, densitometric quantitation of chaperone proteins normalized to actin (n = 6/group, 2- and 7-month old), average ± SE,*P < 0.05 OVE26 vs. FVB. c, d Immunofluorescence staining of kidney sections from young and older mice for GRP78 or PDI (red) and LTA staining (green). White arrows, non-LTA-stained tubules. White arrowheads, LTA-stained tubules to mark proximal tubules (images representative of six mice/group). NC negative control for staining
Fig. 2
Fig. 2
PERK phosphorylation and p58IPK expression in renal cortex and tubules of mice. a Immunohistochemistry of phospho-Thr 980 PERK in kidney sections from non-diabetic FVB and diabetic OVE26 mice. Top row, ×10 magnification, and all other images are ×20 magnification of cortex from young and older mice in each group. Images are representative of immunostained kidney sections in each group at each age. NC negative control for staining. b Immunostaining area analysis of phosphorylated PERK. *P < 0.05 compared with control group; n = 5. c Immunoblot of phospho-PERK Thr-980 in isolated tubules from older FVB and OVE26 mice. Far left lane, molecular weight marker. Data in bar graphs are densitometric quantitation of phospho-PERK normalized to PERK for each mouse and presented as fold change from FVB group, ±SEM, n = 5. d Immunofluorescence staining of kidney sections from young and older mice for p58IPK (red) and LTA staining (green). White arrows, non-LTA-stained tubules. White arrowheads, LTA-stained tubules to mark proximal tubules. Images representative of six mice/group. NC negative control for staining. e Immunoblot of p58IPK in isolated cortical tubules from young and older FVB non-diabetic and OVE26 diabetic mice. Bar graphs, densitometric quantitation of p58IPK normalized to actin. Data are average ± SE, *P < 0.05 (n = 5)
Fig. 3
Fig. 3
siRNA knockdown of PERK in proximal tubule cells. Human proximal tubule cells were transfected with control or PERK siRNA for 48 h. a Cell culture media subject to immunoblot analysis for expression of fibronectin and cell lysate for PERK and GAPDH to validate knockdown of PERK expression. b Densitometric quantitation of fibronectin immunoblots in (a) (n = 7–11/experimental condition), presented as fold change from control siRNA. Data are average ± SEM/condition, *P < 0.05 compared with control siRNA
Fig. 4
Fig. 4
Renal tubule apoptosis analyzed by TUNEL assay and expression of CHOP in tubules. Representative TUNEL staining from older (6-month-old) non-diabetic FVB and diabetic OVE26 mouse kidney sections. Arrowheads indicate tubule cells with positive TUNEL staining. Magnification, ×40. Bar graph, quantitative analysis of apoptotic tubule cells by counting cells in random visual fields in the cortex under a ×40 objective. Values normalized between samples by dividing number of positively stained tubule cells by number of visual fields observed/section. Data are expressed as average ± SE, n = 6. *P < 0.05 vs. non-diabetic. b Immunoblot of CHOP protein in isolated cortical tubules from 7-month-old mice (n = 6). Densitometric quantitation of CHOP normalized to actin. Data are average ± SE, *P < 0.05 vs. non-diabetic FVB. c Immunofluorescence staining of kidney sections from older 7-month-old diabetic and control mice for CHOP (red) and staining with LTA (green), to mark proximal tubules (representative image, of n = 6). NC negative control for staining (see “Methods”). Scale bar, 30 μm. d Immunohistochemistry of CHOP in biopsy samples of patients with diabetic nephropathy and renal specimens from non-diabetic control subjects. Images are representative of biopsies from eight and five different diabetic and control patients, respectively. NC negative control for staining (see “Methods”)
Fig. 5
Fig. 5
Severe proteinuria does not augment CHOP expression in tubules of diabetic mice. Immunofluorescence of kidney sections from 4-month-old non-diabetic FVB and diabetic OVE26 and OVE26-Nmt for CHOP (red) and LTA (green) to mark proximal tubules. Nuclei stained with DAPI (blue). Portions of images cropped and enlarged with arrows pointing to nuclei to show CHOP localization (red) in nuclei of tubules from diabetic mice. CHOP is excluded from tubule nuclei of FVB control mice. Bar graph, quantitation of CHOP immunofluorescence staining. Data are average/group ± SEM. Sum of total intensity values/image was averaged for each mouse and then/group. *P < 0.05 compared with FVB non-diabetic mice. Scale bar, 30 μm. NC negative control for staining
Fig. 6
Fig. 6
Overexpression of CHOP in proximal tubule cells. Human proximal tubule cells were transfected with control vector or vector containing human CHOP for 24 h. Cell lysate subject to immunoblot analysis for expression of CHOP to validate overexpression, fibronectin, and GAPDH

References

    1. Advani A, Gilbert RE, Thai K, Gow RM, Langham RG, Cox AJ, Connelly KA, Zhang Y, Herzenberg AM, Christensen PK, Pollock CA, Qi W, Tan SM, Parving HH, Kelly DJ. Expression, localization, and function of the thioredoxin system in diabetic nephropathy. J Am Soc Nephrol. 2009;20:730–741. doi: 10.1681/ASN.2008020142. - DOI - PMC - PubMed
    1. Asmellash S, Stevens JL, Ichimura T. Modulating the endoplasmic reticulum stress response with trans-4,5-dihydroxy-1,2-dithiane prevents chemically induced renal injury in vivo. Toxicol Sci. 2005;88:576–584. doi: 10.1093/toxsci/kfi303. - DOI - PubMed
    1. Barresi G, Tuccari G, Arena F. Peanut and Lotus tetragonolobus binding sites in human kidney from congenital nephrotic syndrome of Finnish type. Histochemistry. 1988;89:117–120. doi: 10.1007/BF00489914. - DOI - PubMed
    1. Brezniceanu ML, Liu F, Wei CC, Tran S, Sachetelli S, Zhang SL, Guo DF, Filep JG, Ingelfinger JR, Chan JS. Catalase overexpression attenuates angiotensinogen expression and apoptosis in diabetic mice. Kidney Int. 2007;71:912–923. doi: 10.1038/sj.ki.5002188. - DOI - PubMed
    1. Brezniceanu ML, Lau CJ, Godin N, Chénier I, Duclos A, Ethier J, Filep JG, Ingelfinger JR, Zhang SL, Chan JS. Reactive oxygen species promote caspase-12 expression and tubular apoptosis in diabetic nephropathy. J Am Soc Nephrol. 2010;21:943–954. doi: 10.1681/ASN.2009030242. - DOI - PMC - PubMed

Publication types

MeSH terms