. 2015 Dec:36:396-409.
doi: 10.1016/j.meegid.2015.10.010. Epub 2015 Oct 19.

Gene expression and TB pathogenesis in rhesus macaques: TR4, CD40, CD40L, FAS (CD95), and TNF are host genetic markers in peripheral blood mononuclear cells that are associated with severity of TB lesions

Affiliations

Gene expression and TB pathogenesis in rhesus macaques: TR4, CD40, CD40L, FAS (CD95), and TNF are host genetic markers in peripheral blood mononuclear cells that are associated with severity of TB lesions

Morteza Roodgar et al. Infect Genet Evol. 2015 Dec.

Abstract

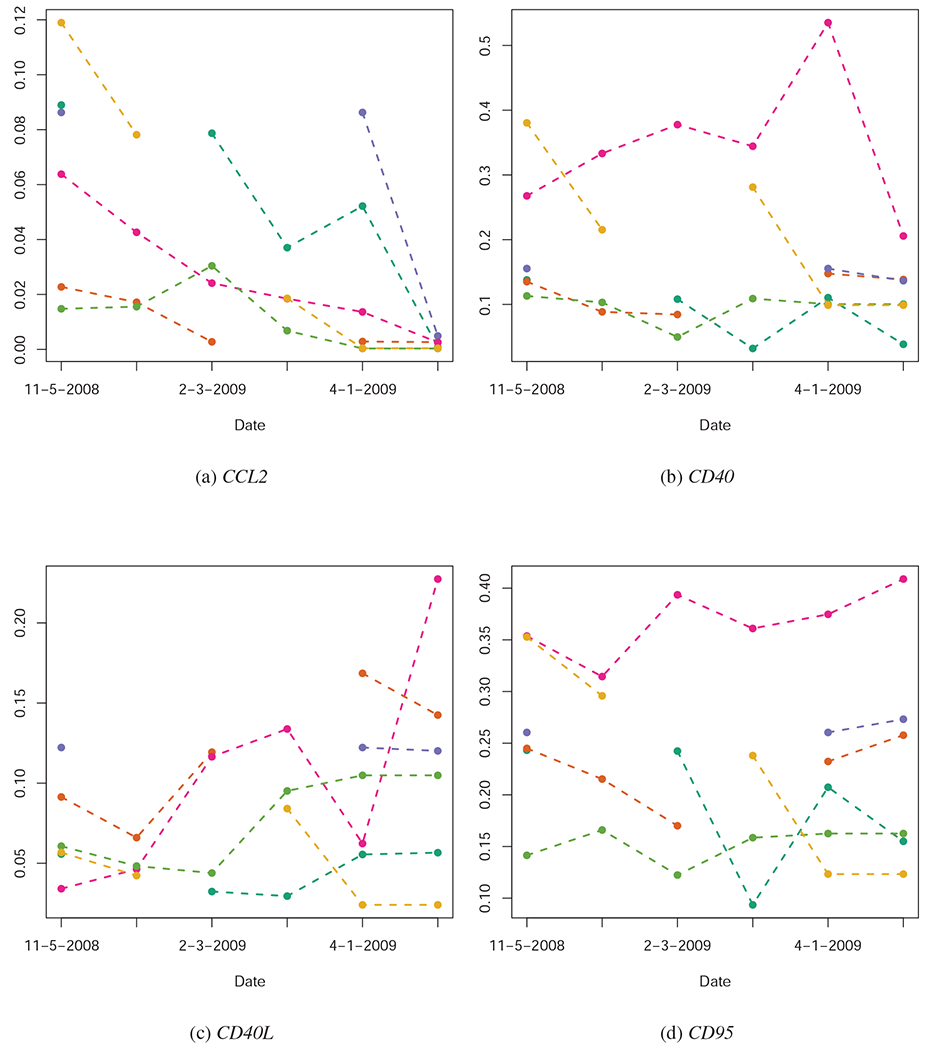
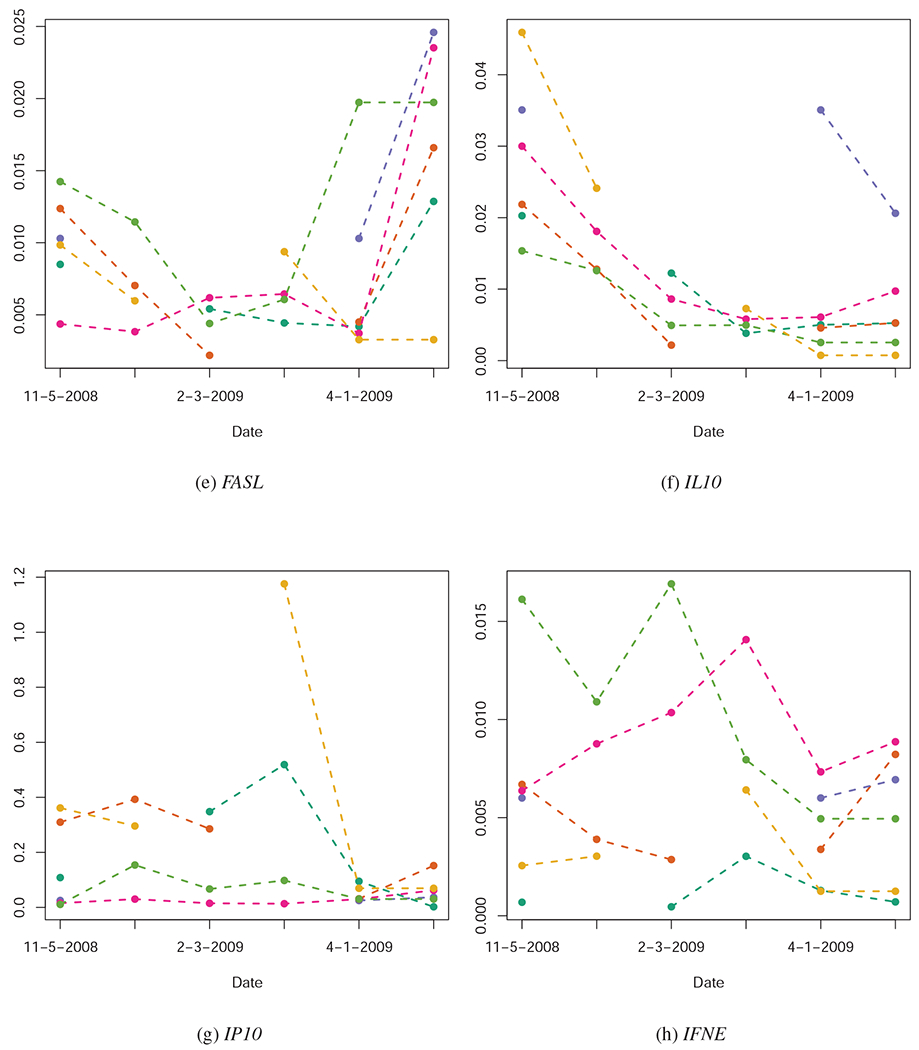
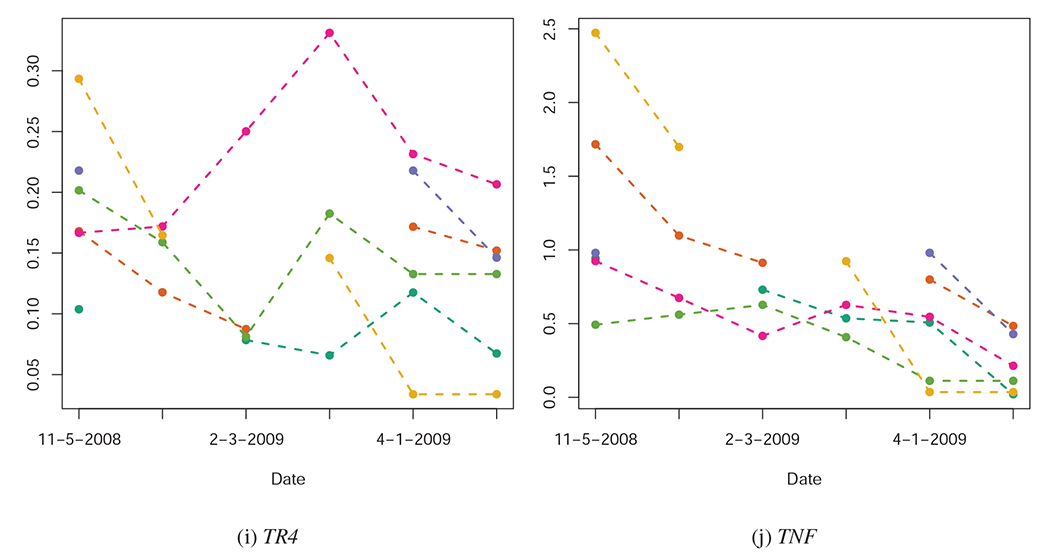
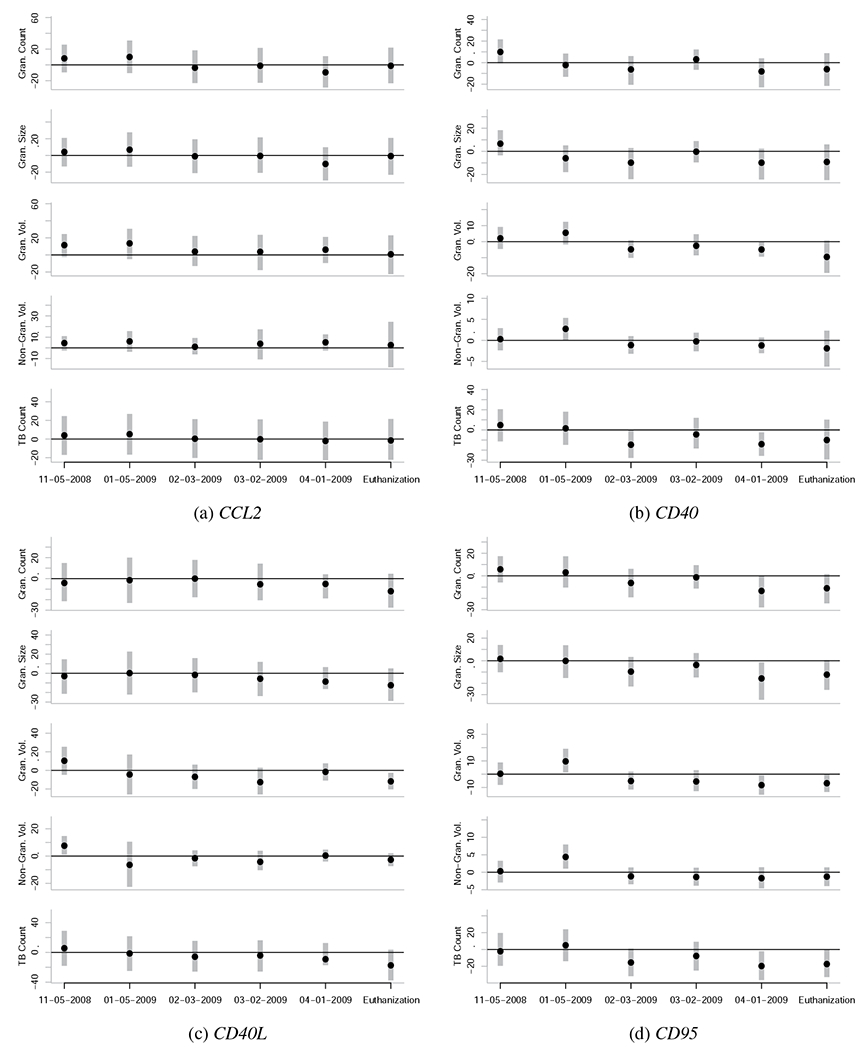
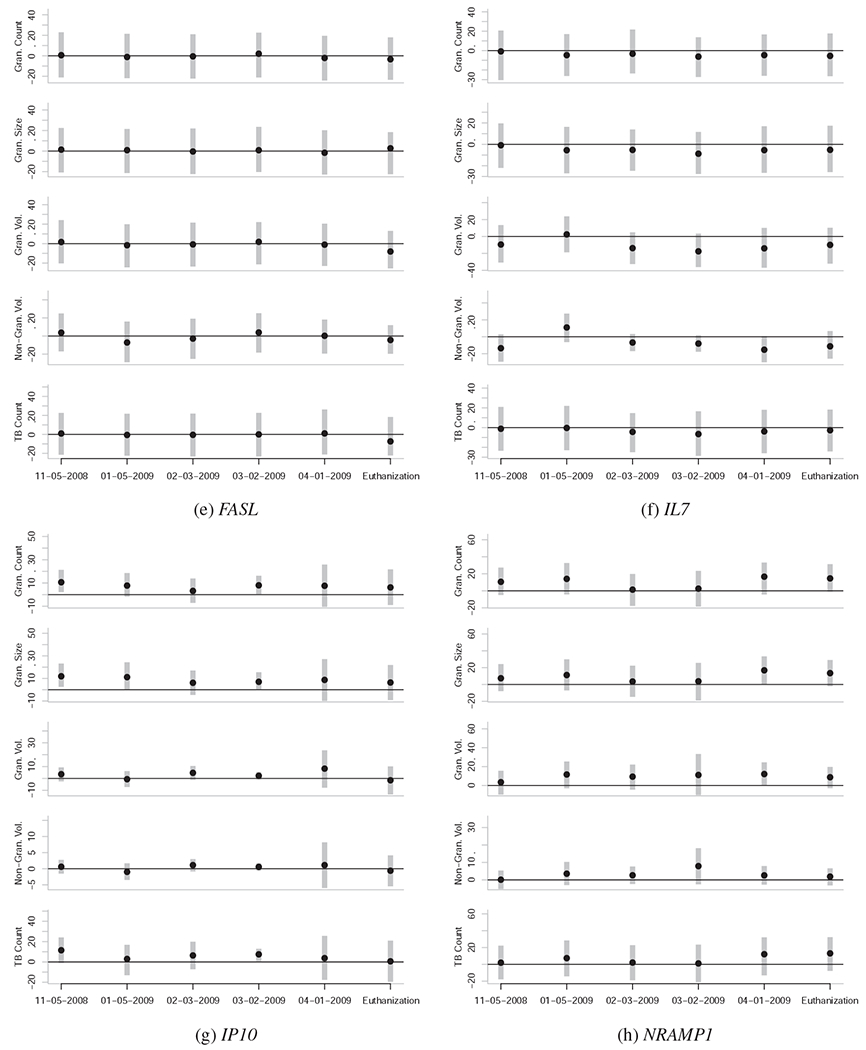
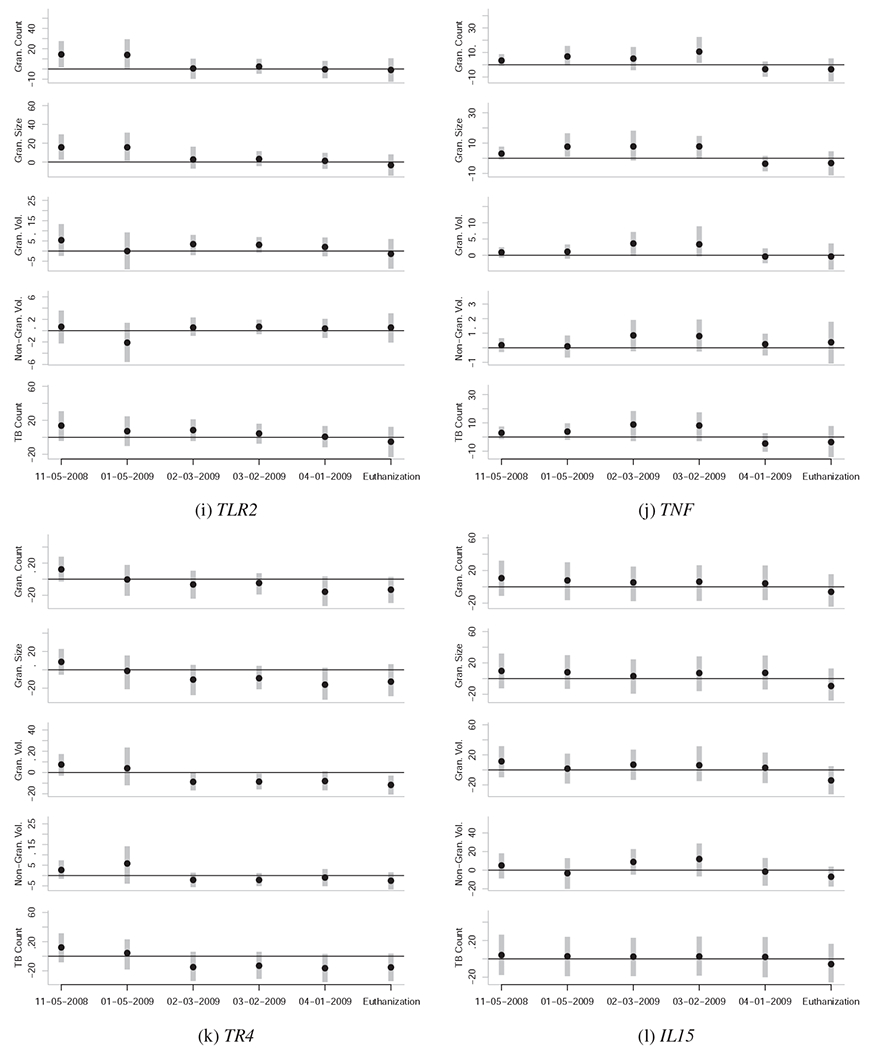
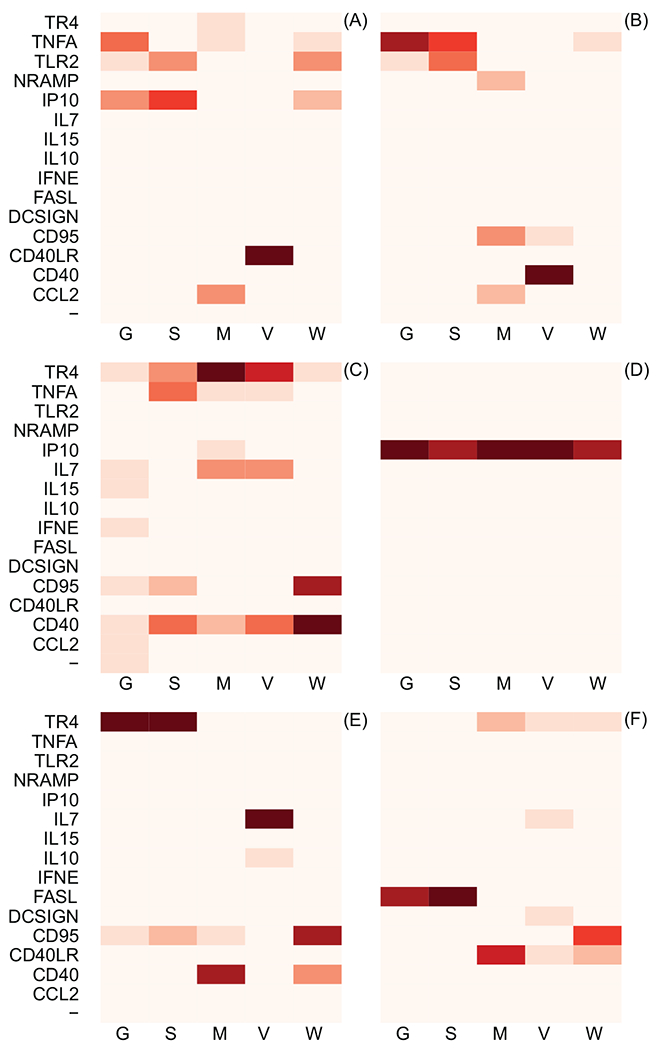
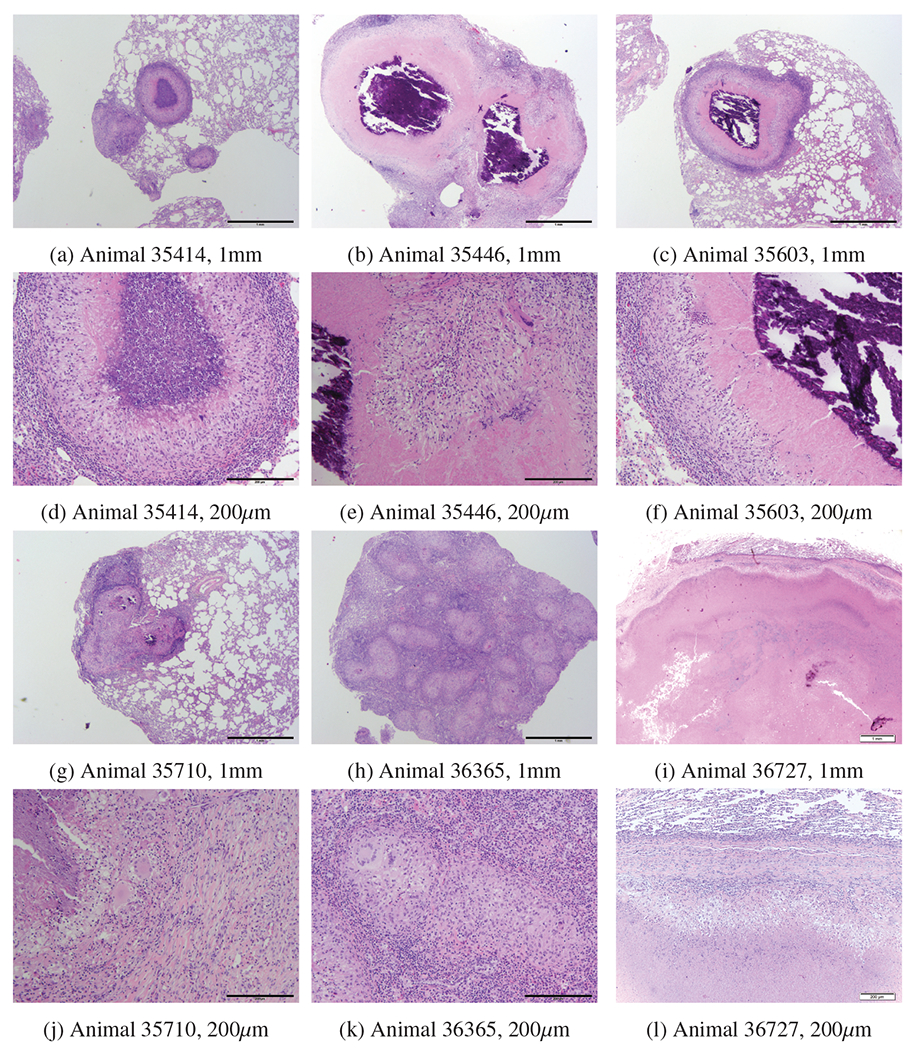
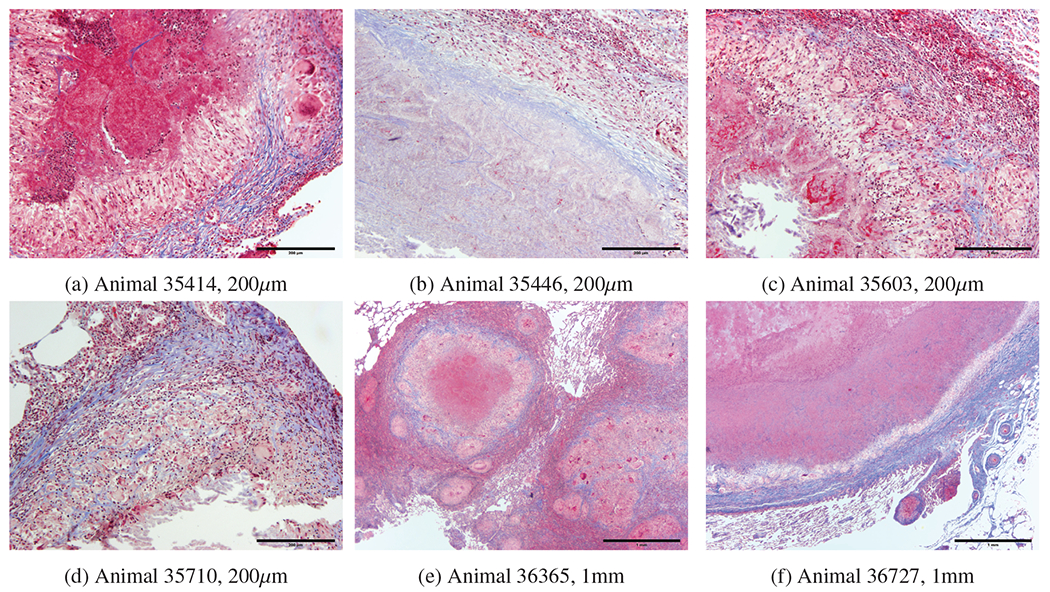
Tuberculosis (TB) pathologic lesions in rhesus macaques resemble those in humans. The expression levels of several host TB candidate genes in the peripheral blood mononuclear cells (PBMCs) of six rhesus macaques experimentally infected with Mycobacterium tuberculosis were quantified pre-infection and at several dates post-infection. Quantitative measures of TB histopathology in the lungs including: granuloma count, granuloma size, volume of granulomatous and non-granulomatous lesions, and direct bacterial load, were used as the outcomes of a multi-level Bayesian regression model in which expression levels of host genes at various dates were used as predictors. The results indicate that the expression levels of TR4, CD40, CD40L, FAS (CD95) and TNF in PBMC were associated with quantitative measures of the severity of TB histopathologic lesions in the lungs of the study animals. Moreover, no reliable association between the expression levels of IFNE in PBMCs and the severity of TB lesions in the lungs of the study animals was found. In conclusion, PBMC expression profiles derived from the above-listed host genes might be appropriate biomarkers for probabilistic diagnosis and/or prognosis of TB severity in rhesus macaques.

Keywords: Gene expression; Histopathologic lesions; Host genes; IFNE; Rhesus macaques; TR4; Tuberculosis (TB).


Figures

Figure 1:
Figure 1:
Quantified expression levels (Y-axis) of several of the genes investigated in this study, pre-infection (11-05-2008), at several dates post-infection (01-05-2009, 02-03-2009, 03-02-2009, 04-01-2009), and at time of euthanasia. Each animal’s gene expression over time is represented by a unique color. Quantification could not be completed for all animals at all dates, leading to some cases of missing data. Across these sub-figures, we note that some genes (e.g. TNF) show consistent temporal trends across animals; other genes, however, show no overall temporal pattern in expression, even though their expression levels may be indicative of the severity TB infection (See Figure 2).
Figure 1:
Figure 1:
Quantified expression levels (Y-axis) of several of the genes investigated in this study, pre-infection (11-05-2008), at several dates post-infection (01-05-2009, 02-03-2009, 03-02-2009, 04-01-2009), and at time of euthanasia. Each animal’s gene expression over time is represented by a unique color. Quantification could not be completed for all animals at all dates, leading to some cases of missing data. Across these sub-figures, we note that some genes (e.g. TNF) show consistent temporal trends across animals; other genes, however, show no overall temporal pattern in expression, even though their expression levels may be indicative of the severity TB infection (See Figure 2).
Figure 2:
Figure 2:
Caterpillar plots representing the associations between gene expression levels at various dates and quantitative measures of TB severity at euthanasia. Each subfigure is unique to a given gene, and each subplot within each subfigure is unique to a given quantitative measure of TB severity at euthanasia (vertical axis) for a given date of gene expression quantification (horizontal axis). The black points represent the posterior mean and the vertical grey bars indicate the central 95% posterior credibility intervals. The horizontal black lines represent the value of zero, or no effect. Null effects are typically close to zero, with confidence intervals that overlap zero. Reliable effects have confidence intervals that don’t overlap zero, or do so only slightly. To be confident that an effect is actually non-zero, it is also useful to see if the effect is observed across the majority of the five outcome variables, and if the effect is part of a temporal trend.
Figure 2:
Figure 2:
Caterpillar plots representing the associations between gene expression levels at various dates and quantitative measures of TB severity at euthanasia. Each subfigure is unique to a given gene, and each subplot within each subfigure is unique to a given quantitative measure of TB severity at euthanasia (vertical axis) for a given date of gene expression quantification (horizontal axis). The black points represent the posterior mean and the vertical grey bars indicate the central 95% posterior credibility intervals. The horizontal black lines represent the value of zero, or no effect. Null effects are typically close to zero, with confidence intervals that overlap zero. Reliable effects have confidence intervals that don’t overlap zero, or do so only slightly. To be confident that an effect is actually non-zero, it is also useful to see if the effect is observed across the majority of the five outcome variables, and if the effect is part of a temporal trend.
Figure 3:
Figure 3:
Results of formal model comparison using WAIC. Each block represents a date when gene expression levels were quantified: A) 11/05/2008, B) 01/05/2009, C) 02/03/2009, D) 03/02/2009, E) 04/01/2009, F) Time of euthanasia. Each vertical column illustrates the information theoretic support that the specified gene (on the vertical axis) is the gene whose expression levels best predict a proxy of TB severity (on the horizontal axis). The column labels: G, S, M, V, and W, correspond to granuloma count in sections of lung, max granuloma size, granulomatous lesion volume, non-granulomatous lesion volume, and TB cell count, respectively. Increasing intensity of the red color indicates increasing information theoretic support. The quantitative results of the information theoretic model comparison used to generate this figure are included as Supplementary Materials. The “-” symbol indicates the performance of the null model, which does not include gene expression levels as a predictor; it should be noted that the null model has almost no information theoretic support in any of the model comparisons, meaning that use of gene expression levels to predict TB severity almost universally improves predictive inference. Consistent support for a given gene across proxies for TB severity and time periods provides good evidence that there exists a relationship between TB pathogensis and gene expression levels.
Figure 4:
Figure 4:
Multifocally in the lung, there were individual and coalescing granulomas which ranged from approximately 200 to greater than 1000 um in diameter. Granulomas were characterized by central areas which varied from having closely apposed epithelioid macrophages to necrosis consisting of intense eosinophilia, karyorrhexis, and karyolysis with basophilic hyalinized foci of mineralization (35446, b) or without basophilic hyalinized foci of mineralization (35414, a). The central region of granulomas were surrounded by areas of necrosis in animals that exhibited severe and active TB (c) or fibrosis in animals that exhibitted less severe disease and more successfully controlled the infection (d). Mainly at the periphery of granulomas there was a primarily mononuclear inflammatory cell infiltrate composed of varying numbers of lymphocytes, plasma cells, histiocytes and rare multinucleated giant cells which were more sparsely distributed. An outer rim of fibrosis (encapsulation) delineated the granulomas from pulmonary parenchyma. Degree of severity was based on the percent of pulmonary parenchyma affected by this chronic inflammatory process, size and number of granuloma. 35710 was least affected; granulomas for this case were also smaller, see [63]. 36727 was most extensively affected with granulomas also in eyes and brain.
Figure 5:
Figure 5:
a) 35414 central area of caseous necrosis with margin of macrophages, multinucleated giant cells, and lymphocytes surrounded by fibrous connective tissue. b) 35446 central area of necrosis surrounded by fibrous connective tissue. c) 35603 central cavity containing mineralized material with margin of necrotic cells, surrounded by macrophages, distinct multinucleated giant cells and lymphocytes surrounded by patchy multifocal areas of fibrous connective tissue. d) 35710 central cavity containing mineralized material surrounded by macrophages, distinct multinucleated giant cells and lymphocytes surrounded by distinct area of fibrous connective tissue. e) 36365 central area of extensive necrosis surrounded by macrophages, lymphocyte, and distinct multinucleated giant cells surrounded by distinct fibrous connective tissue. f) 36727 central area of extensive necrosis with margine of macrophages, lymphocytes multinucleated giant cells surrounded by distinct fibrous connective tissue.

Similar articles

Cited by

References

    1. W. H. Organization, Global Tuberculosis Report 2013, World Health Organization, 2013.
    1. Walsh GP, Tan EV, Cruz ECD, Abalos RM, Villahermosa LG, Young LJ, Cellona RV, Narareno JB, Horwitz MA, The Philippine cynomolgus monkey (Macaca fasicularis) provides a new nonhuman primate model of tuberculosis that resembles human disease, Nature medicine 2 (4) (1996) 430–436. - PubMed
    1. Capuano SV, Croix DA, Pawar S, Zinovik A, Myers A, Lin PL, Bissel S, Fuhrman C, Klein E, Flynn JL, Experimental Mycobacterium tuberculosis infection of cynomolgus macaques closely resembles the various manifestations of human M. tuberculosis infection, Infection and immunity 71 (10) (2003) 5831–5844. - PMC - PubMed
    1. Barclay W, Anacker R, Brehmer W, Leif W, Ribi E, Aerosol-induced tuberculosis in subhuman primates and the course of the disease after intravenous BCG vaccination, Infection and immunity 2 (5) (1970) 574–582. - PMC - PubMed
    1. Flynn J, Capuano S, Croix D, Pawar S, Myers A, Zinovik A, Klein E, Non-human primates: a model for tuberculosis research, Tuberculosis 83 (1) (2003) 116–118. - PubMed

Publication types

MeSH terms