

p114RhoGEF governs cell motility and lumen formation during tubulogenesis through a ROCK-myosin-II pathway
- PMID: 26483385
- PMCID: PMC4712812
- DOI: 10.1242/jcs.172361
p114RhoGEF governs cell motility and lumen formation during tubulogenesis through a ROCK-myosin-II pathway
Abstract
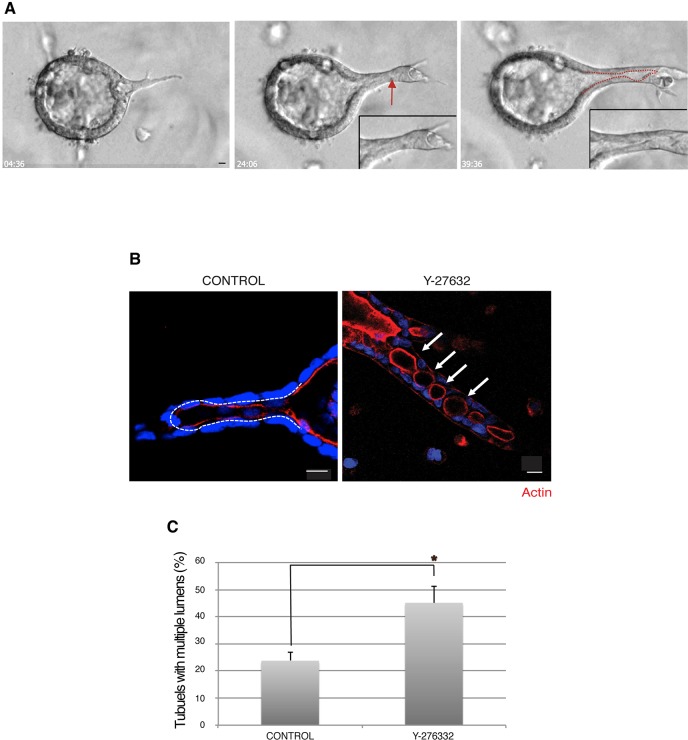
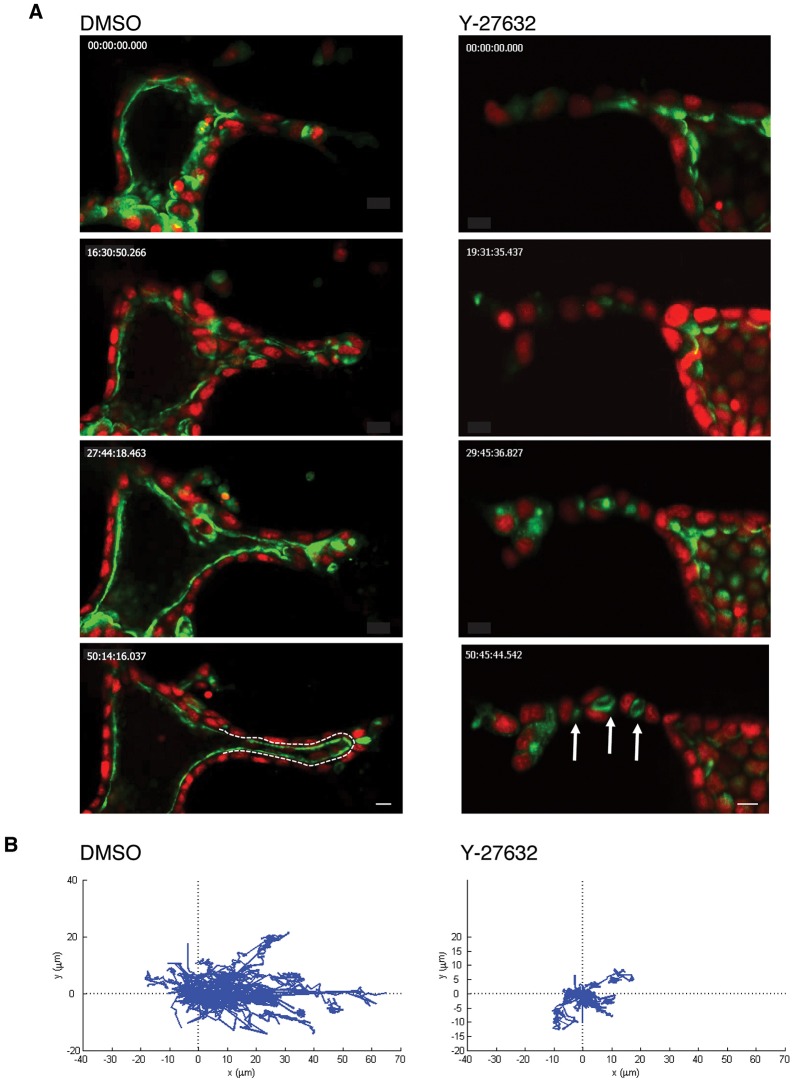
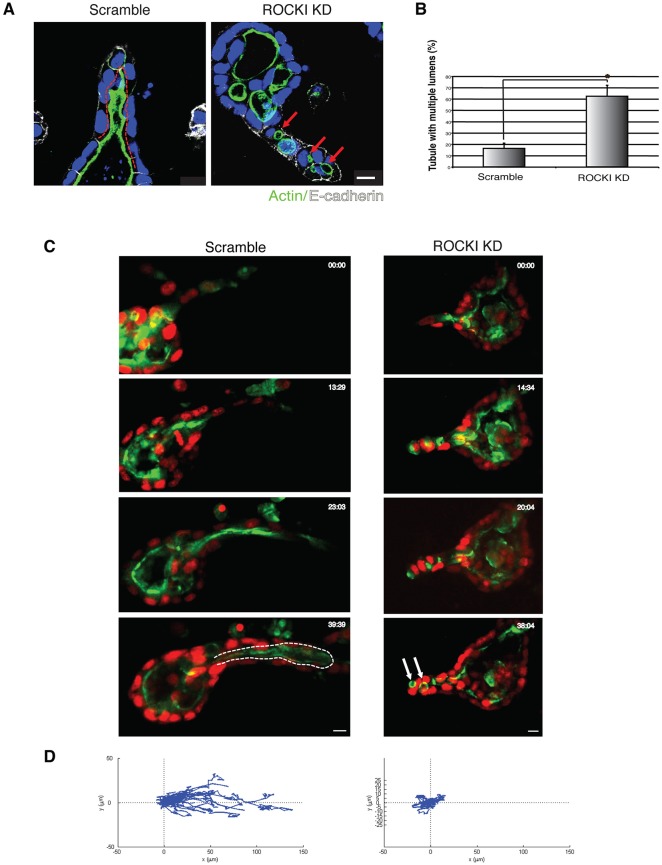
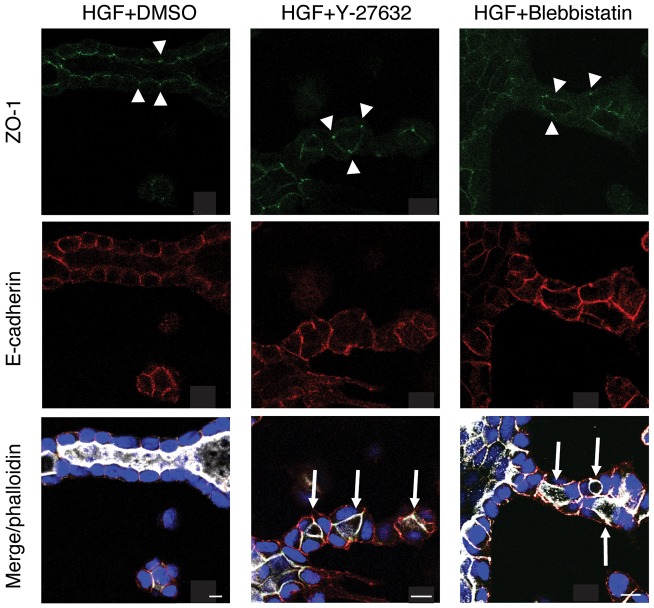
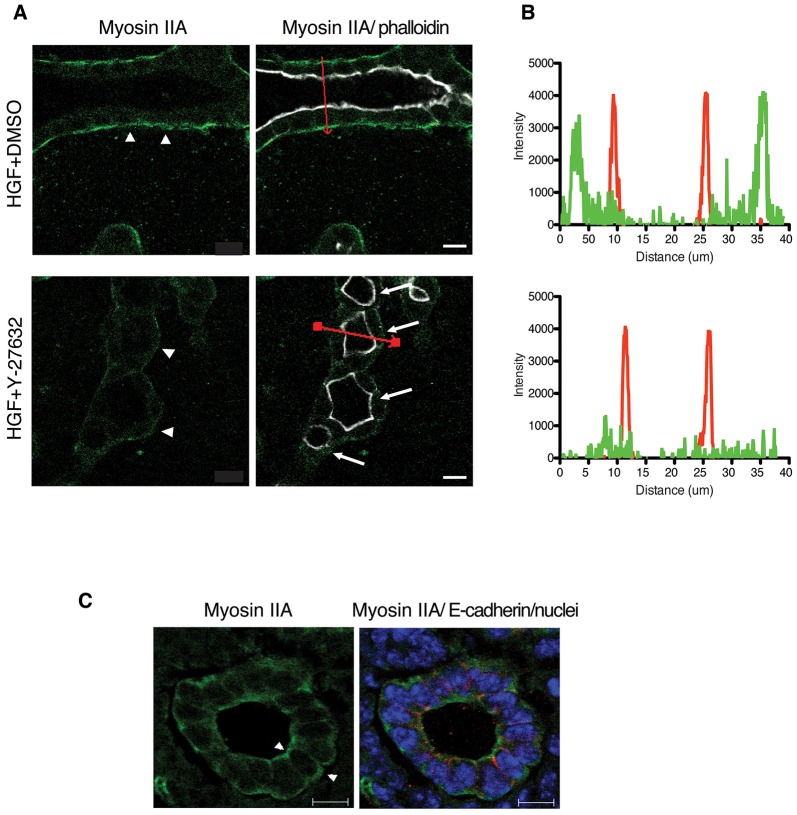
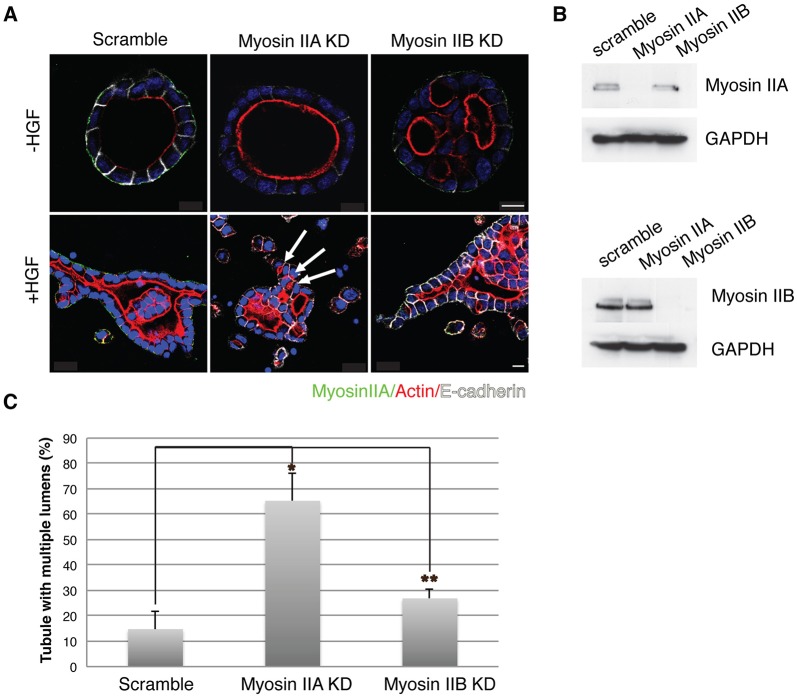
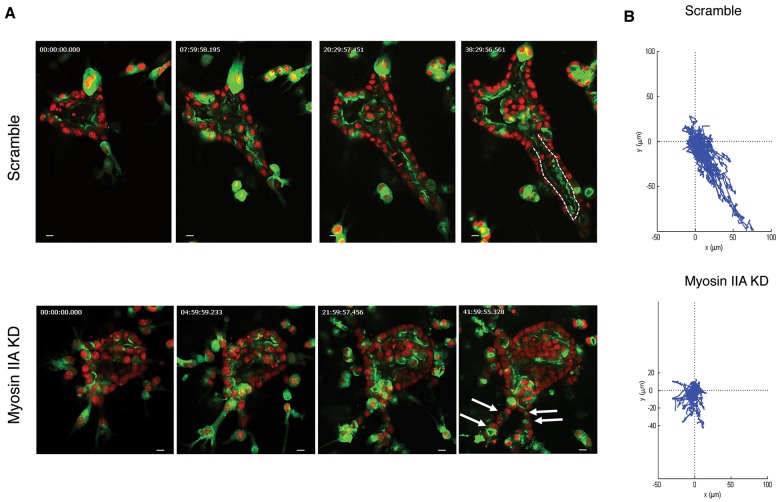
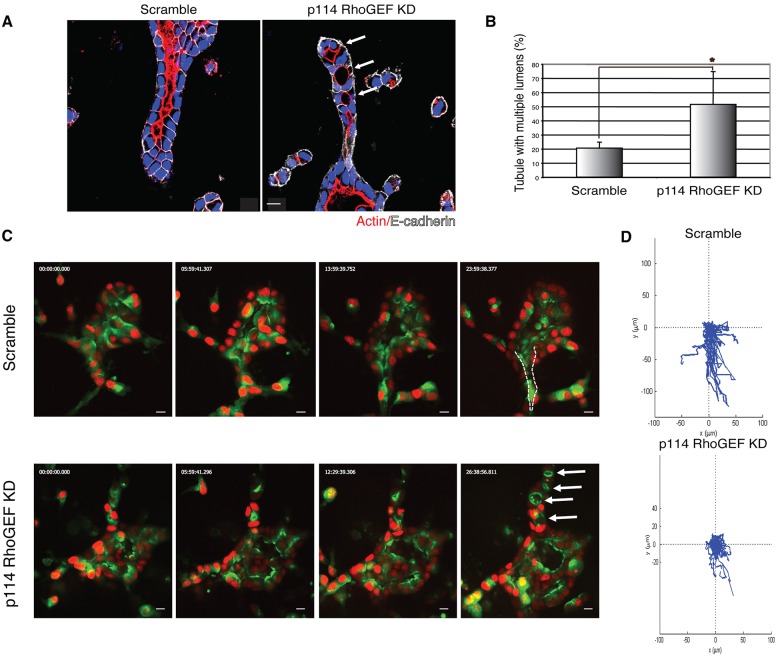
Tubulogenesis is fundamental to the development of many epithelial organs. Although lumen formation in cysts has received considerable attention, less is known about lumenogenesis in tubes. Here, we utilized tubulogenesis induced by hepatocyte growth factor (HGF) in MDCK cells, which form tubes enclosing a single lumen. We report the mechanism that controls tubular lumenogenesis and limits each tube to a single lumen. Knockdown of p114RhoGEF (also known as ARHGEF18), a guanine nucleotide exchange factor for RhoA, did not perturb the early stages of tubulogenesis induced by HGF. However, this knockdown impaired later stages of tubulogenesis, resulting in multiple lumens in a tube. Inhibition of Rho kinase (ROCK) or myosin IIA, which are downstream of RhoA, led to formation of multiple lumens. We studied lumen formation by live-cell imaging, which revealed that inhibition of this pathway blocked cell movement, suggesting that cell movement is necessary for consolidating multiple lumens into a single lumen. Lumen formation in tubules is mechanistically quite different from lumenogenesis in cysts. Thus, we demonstrate a new pathway that regulates directed cell migration and formation of a single lumen during epithelial tube morphogenesis.
Keywords: Epithelia; Hepatocyte growth factor; Madin–Darby canine kidney cells; Migration; Tube.
© 2015. Published by The Company of Biologists Ltd.
Conflict of interest statement
The authors declare no competing or financial interests.
Figures
Similar articles
-
FilGAP regulates distinct stages of epithelial tubulogenesis.Biochem Biophys Res Commun. 2019 Jun 30;514(3):742-749. doi: 10.1016/j.bbrc.2019.04.187. Epub 2019 May 9. Biochem Biophys Res Commun. 2019. PMID: 31078260
-
Neural Wiskott-Aldrich syndrome protein is involved in hepatocyte growth factor-induced migration, invasion, and tubulogenesis of epithelial cells.Cancer Res. 2002 May 1;62(9):2503-9. Cancer Res. 2002. PMID: 11980641
-
Hepatocyte growth factor upregulates alpha2beta1 integrin in Madin-Darby canine kidney cells: implications in tubulogenesis.J Biomed Sci. 2002 May-Jun;9(3):261-72. doi: 10.1007/BF02256073. J Biomed Sci. 2002. PMID: 12065901
-
Tubulogenesis.Development. 2013 Jul;140(14):2851-5. doi: 10.1242/dev.070680. Development. 2013. PMID: 23821032 Free PMC article. Review.
-
Cells into tubes: Molecular and physical principles underlying lumen formation in tubular organs.Curr Top Dev Biol. 2021;143:37-74. doi: 10.1016/bs.ctdb.2020.09.002. Epub 2020 Oct 20. Curr Top Dev Biol. 2021. PMID: 33820625 Review.
Cited by
-
A Gα12-specific Binding Domain in AKAP-Lbc and p114RhoGEF.J Mol Signal. 2016 Sep 9;11:3. doi: 10.5334/1750-2187-11-3. J Mol Signal. 2016. PMID: 31051012 Free PMC article.
-
Expression of novel "LOCGEF" isoforms of ARHGEF18 in eosinophils.J Leukoc Biol. 2018 Jul;104(1):135-145. doi: 10.1002/JLB.2MA1017-418RR. Epub 2018 Mar 30. J Leukoc Biol. 2018. PMID: 29601110 Free PMC article.
-
MET Oncogene Controls Invasive Growth by Coupling with NMDA Receptor.Cancers (Basel). 2022 Sep 11;14(18):4408. doi: 10.3390/cancers14184408. Cancers (Basel). 2022. PMID: 36139568 Free PMC article.
-
P-cadherin-dependent adhesions are required for single lumen formation and HGF-mediated cell protrusions during epithelial morphogenesis.iScience. 2025 Jan 20;28(2):111844. doi: 10.1016/j.isci.2025.111844. eCollection 2025 Feb 21. iScience. 2025. PMID: 39981519 Free PMC article.
-
cAMP guided his way: a life for G protein-mediated signal transduction and molecular pharmacology-tribute to Karl H. Jakobs.Naunyn Schmiedebergs Arch Pharmacol. 2019 Aug;392(8):887-911. doi: 10.1007/s00210-019-01650-1. Epub 2019 May 17. Naunyn Schmiedebergs Arch Pharmacol. 2019. PMID: 31101932 Review.
References
-
- Bañón-Rodríguez I., Gálvez-Santisteban M., Vergarajauregui S., Bosch M., Borreguero-Pascual A. and Martín-Belmonte F. (2014). EGFR controls IQGAP basolateral membrane localization and mitotic spindle orientation during epithelial morphogenesis. EMBO J. 33, 129-145. 10.1002/embj.201385946 - DOI - PMC - PubMed
Publication types
MeSH terms
Substances
Grants and funding
LinkOut - more resources
Full Text Sources
Other Literature Sources
