. 2015 Dec 1;128(23):4366-79.
doi: 10.1242/jcs.173518. Epub 2015 Oct 19.

Carcinoma cells induce lumen filling and EMT in epithelial cells through soluble E-cadherin-mediated activation of EGFR

Affiliations

Carcinoma cells induce lumen filling and EMT in epithelial cells through soluble E-cadherin-mediated activation of EGFR

Pratima U Patil et al. J Cell Sci. .

Abstract

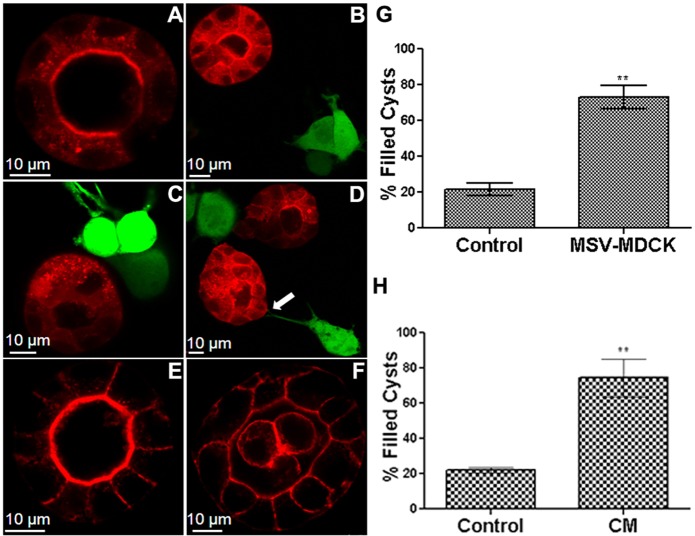
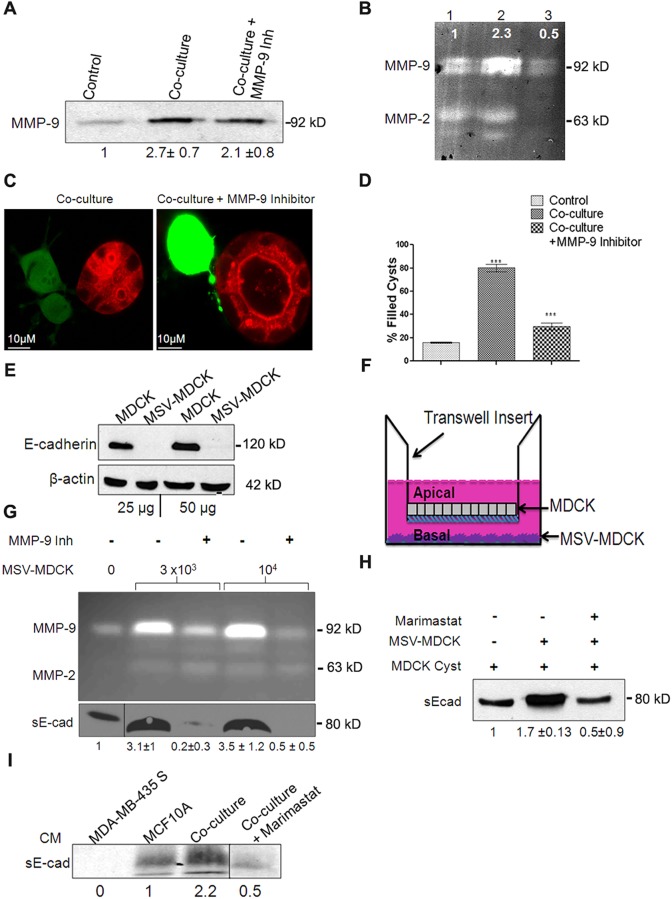
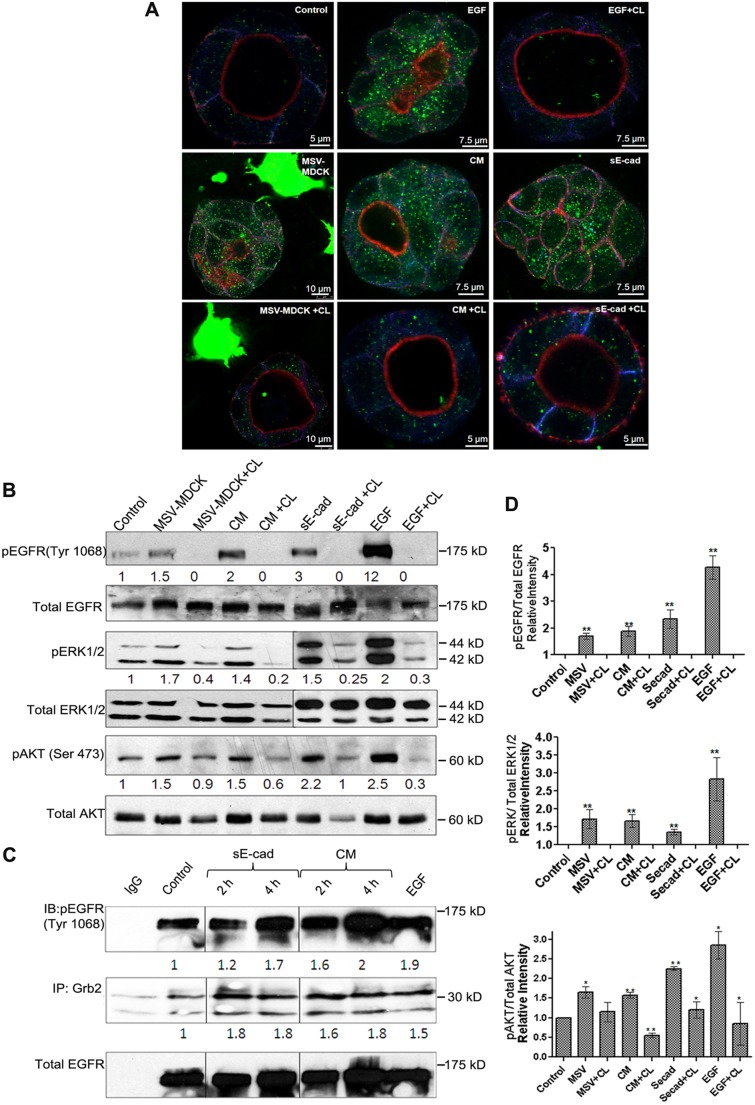
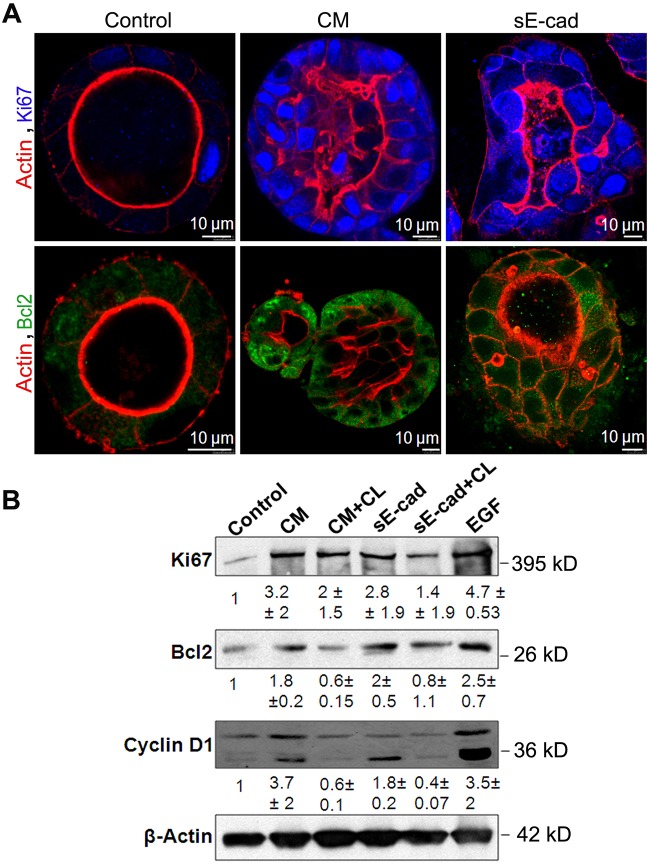
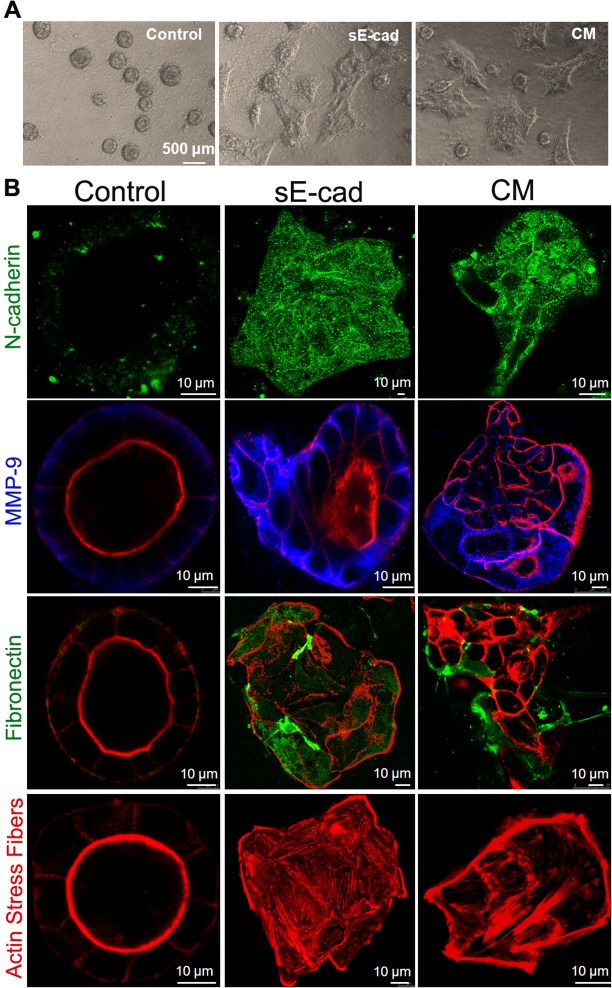
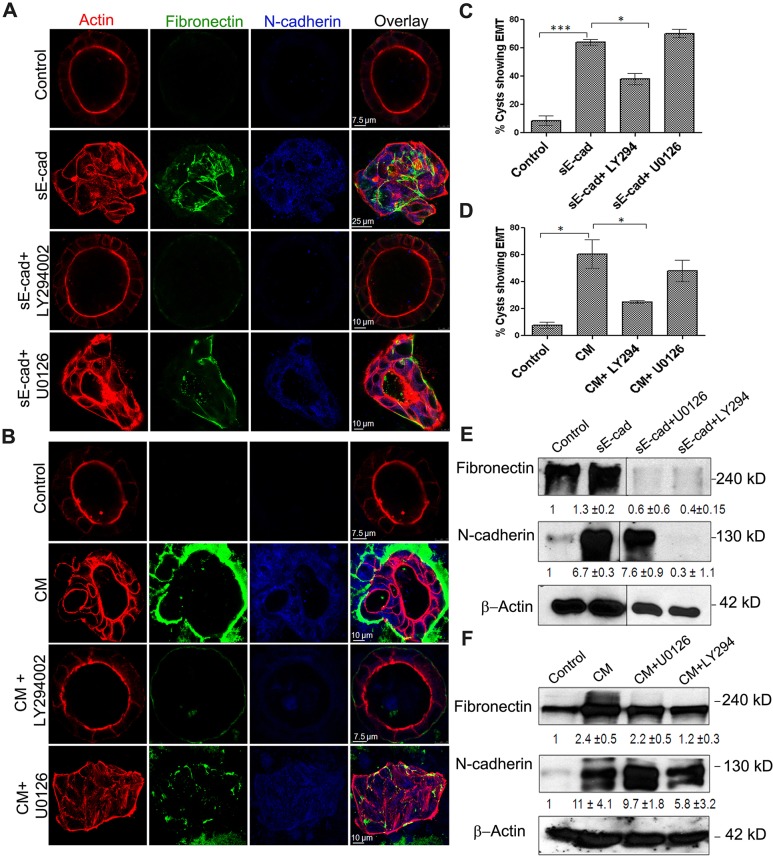
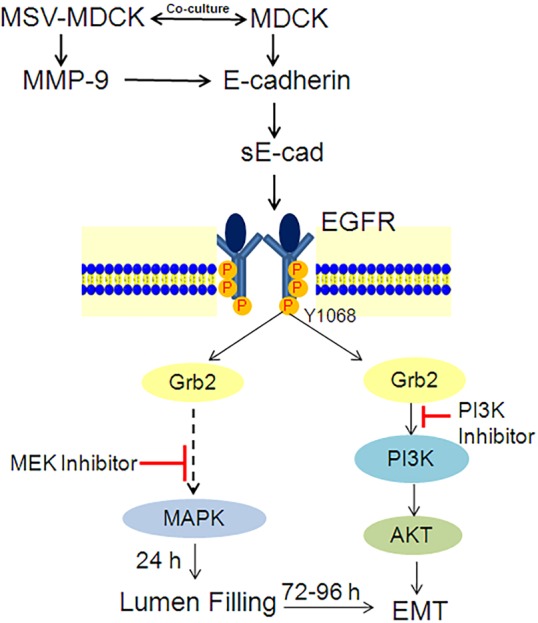
In epithelial cancers, carcinoma cells coexist with normal cells. Although it is known that the tumor microenvironment (TME) plays a pivotal role in cancer progression, it is not completely understood how the tumor influences adjacent normal epithelial cells. In this study, a three-dimensional co-culture system comprising non-transformed epithelial cells (MDCK) and transformed carcinoma cells (MSV-MDCK) was used to demonstrate that carcinoma cells sequentially induce preneoplastic lumen filling and epithelial-mesenchymal transition (EMT) in epithelial cysts. MMP-9 secreted by carcinoma cells cleaves cellular E-cadherin (encoded by CDH1) from epithelial cells to generate soluble E-cadherin (sE-cad), a pro-oncogenic protein. We show that sE-cad induces EGFR activation, resulting in lumen filling in MDCK cysts. Long-term sE-cad treatment induced EMT. sE-cad caused lumen filling by induction of the ERK signaling pathway and triggered EMT through the sustained activation of the AKT pathway. Although it is known that sE-cad induces MMP-9 release and consequent EGFR activation in tumor cells, our results, for the first time, demonstrate that carcinoma cells can induce sE-cad shedding in adjacent epithelial cells, which leads to EGFR activation and the eventual transdifferentiation of the normal epithelial cells.

Keywords: EGFR; MMP-9; Soluble E-cadherin; Transdifferentiation.


Conflict of interest statement

Competing interests

The authors declare no competing or financial interests.

Figures

Fig. 1.
Fig. 1.
Co-culture of carcinoma cells with MDCK cysts disrupt luminal architecture. MDCK–RFP cysts (red) were formed by culturing the cells for 72 h in Matrigel™ (A). MSV-MDCK–GFP cells (green) were then added in co-cultures and imaged after 4 h (B), 8 h (C) and 24 h (D). The arrow in D points to a filopodium from an MSV-MDCK cell contacting a cyst. Control cysts were cultured alone for an additional 24 h (E). MDCK–RFP cysts were treated with conditioned medium (CM) from MSV-MDCK cells for 24 h (F). Lumen-filled cysts in three independent experiments were counted and compared to controls after 24 h in the co-culture (G) or after exposure to the conditioned medium from tumor cells for 24 h (H). Results are mean±s.e.m. **P<0.005 (Student's t-test).
Fig. 2.
Fig. 2.
Conditioned medium from co-culture contains active MMP-9, which is crucial for lumen filling and mediates sE-cad shedding in MDCK cysts. (A) Representative immunoblot from three independent experiments showing MMP-9 levels in the supernatant from MDCK 3D cultures. Quantification data are shown underneath the blot and are expressed as mean±s.e.m. from three independent experiments. (B) Representative zymogram from three independent experiments showing MMP-9 activity. Lane 1, MDCK control; lane 2, co-culture; lane 3, co-culture+10 µM MMP-9 inhibitor. The intensity of MMP-9 bands normalized to control is shown. (C) Confocal images showing co-culture in presence and absence of 10 µM MMP-9 inhibitor after 24 h treatment. Note the absence of lumen filling with MMP-9 inhibition (right panel). (D) Quantification of lumen filling in MDCK cysts in the presence and absence of MMP-9 inhibitor from an average of three independent experiments. Results are mean±s.e.m. ***P<0.0001 (Student's t-test). (E) Representative immunoblot from two independent experiments showing E-cadherin levels in MDCK and MSV-MDCK cells. β-actin is used as a loading control. (F) Diagrammatic representation of the Transwell co-culture system. (G) Top panel, zymogram showing MMP-9 activity in the conditioned medium from the bottom chamber of the Transwell. A dose-dependent increase in MMP-9 levels with increasing number of MSV-MDCK cells in the bottom chamber was observed. 10 µM of MMP-9 inhibitor was used to block MMP-9 activity in the bottom chamber. Bottom panel, immunoblot showing sE-cad levels in the conditioned medium (CM) in the bottom chamber of the Transwell. (H) Immunoblot showing increased sE-cad levels in the co-culture conditioned medium. Note that in the presence of MMP-9 inhibitor, sE-cad levels were reduced. (I) Immunoblot showing sE-cad levels in the bottom chamber of a Transwell assay consisting of MCF10A and MDA-MB435S cell lines. Quantification data are shown as mean±s.e.m. from three experiments underneath the blots for A,G,H and I.
Fig. 3.
Fig. 3.
sE-cad is necessary for induction of lumen filling in MDCK cysts. (A) Representative confocal images showing lumen filling and disrupted epithelial architecture induced by 10 μg/ml purified sE-cad over 24 h. (B) Quantification of lumen filling from three independent experiments. Results are mean±s.e.m. ***P<0.0001 (Student's t-test). (C) Immunoblot showing sE-cad levels in the conditioned medium before and after immunodepletion of sE-cad. Quantification data represent mean±s.e.m. from three independent experiments. Note that the immunodepleted sE-cad is bound to Protein G beads. (D) Representative confocal images of control cysts, conditioned medium (CM)-treated cysts and cysts treated with sE-cad-depleted conditioned medium. Cysts were stained for actin (red) and TOPRO-3 (nuclear marker, blue). (E) Quantification of lumen-filled cysts in presence of conditioned medium and sE-cad-depleted conditioned medium. Results are mean±s.e.m. for B,E and the blot shown in C. ***P<0.001 (Student's t-test).
Fig. 4.
Fig. 4.
MSV-MDCK cells induce lumen filling in MDCK cells by sE-cad-mediated activation of EGFR and downstream AKT and ERK1/2 pathways in MDCK cysts. (A) Representative immunofluorescence images showing increased pEGFR expression in MDCK cysts treated with MSV-MDCK cells, conditioned medium (CM), sE-cad, EGF with or without CL-387,785 (CL). Immunofluorescence shows actin (red), E-cadherin (blue) and pEGFR (green). (B) Representative immunoblot from three independent experiments showing pEGFR, total EGFR, phosphoryalted AKT (pAKT), phosphorylated ERK1/2 (pERK1/2) and total AKT and ERK1/2 levels in MDCK 3D cyst lysates co-cultured with MSV-MDCK cells, conditioned medium, sE-cad and EGF for 4 h. 1 µM CL-387,785, an EGFR kinase inhibitor was used to block EGFR activation for 4 h where indicated. EGF treatment was for 15 min. (C) Co-immunoprecipitation of pEGFR (Tyr1068) with Grb2 in MDCK 3D cysts treated with conditioned medium or sE-cad at 2 h and 4 h. (D) Graphs represent quantification data as mean±s.e.m. from three independent experiments. *P<0.05, **P<0.005 (Student's t-test).
Fig. 5.
Fig. 5.
Lumen filling is a consequence of reduced apoptosis and increased proliferation. (A) Immunofluorescence images showing increased Ki67 and Bcl2 expression in MDCK cysts treated with conditioned medium (CM) and sE-cad for 48 h. Images were obtained from staining cysts with anti-Bcl2 antibody (green), phalloidin–Alexa-Fluor-546 (actin, red) and Ki67 (blue). (B) Representative immunoblot showing Ki67, Bcl2 and cyclin D1 expression in MDCK cysts treated with sE-cad and conditioned medium. 1 µM CL-387,785 (CL) EGFR inhibitor was used where indicated. Quantification data represent mean±s.d. from two independent experiments.
Fig. 6.
Fig. 6.
sE-cad and conditioned medium induces an EMT-like phenotype in MDCK cysts. (A) Phase-contrast images of control MDCK cysts and cysts treated with conditioned medium (CM) and sE-cad for 96 h. (B) Immunofluorescence staining with different EMT markers. Representative merged confocal images showing actin (red), fibronectin (green), N-cadherin (green) and MMP-9 (blue).
Fig. 7.
Fig. 7.
AKT is involved in the induction EMT in MDCK cysts. (A,B) Immunofluorescence showing EMT expression in cysts treated with sE-cad (A) and conditioned medium (CM; B) in presence of inhibitors at 96 h. U0126 and LY294002 were used at 1 µM each. Representative confocal images obtained from staining cysts with anti-fibronectin antibody (green), anti-N-cadherin antibody (blue), phalloidin–Alexa-Fluor-546 (for actin, red) are shown. (C,D) Quantification of cysts displaying an EMT phenotype after 96 h with sE-cad treatment (C) or conditioned medium treatment (D) in presence of inhibitors. *P<0.05, ***P<0.001 (Student's t-test). (E,F) Representative immunoblots from two independent experiments showing fibronectin and N-cadherin levels in sE-cad-treated cysts (E) and conditioned-medium-treated cysts (F) in the presence of inhibitors. U0126 and LY294002 were used at 1 µM each. β-actin was used as a loading control. Quantification data represent mean±s.d. from two independent experiments.
Fig. 8.
Fig. 8.
Proposed model for sequential lumen filling and EMT induced by carcinoma cells in MDCK cysts. See text for details.

Similar articles

Cited by

References

    1. Aksamitiene E., Kholodenko B. N., Kolch W., Hoek J. B. and Kiyatkin A. (2010). PI3K/Akt-sensitive MEK-independent compensatory circuit of ERK activation in ER-positive PI3K-mutant T47D breast cancer cells. Cell Signal. 22, 1369-1378. 10.1016/j.cellsig.2010.05.006 - DOI - PMC - PubMed
    1. Barwe S. P., Anilkumar G., Moon S. Y., Zheng Y., Whitelegge J. P., Rajasekaran S. A. and Rajasekaran A. K. (2005). Novel role for Na,K-ATPase in phosphatidylinositol 3-kinase signaling and suppression of cell motility. Mol. Biol. Cell 16, 1082-1094. 10.1091/mbc.E04-05-0427 - DOI - PMC - PubMed
    1. Barwe S. P., Skay A., McSpadden R., Huynh T. P., Langhans S. A., Inge L. J. and Rajasekaran A. K. (2013). Na,K-ATPase beta-subunit cis homo-oligomerization is necessary for epithelial lumen formation in mammalian cells. J. Cell Sci. 125, 5711-5720. 10.1242/jcs.108795 - DOI - PMC - PubMed
    1. Behrens J., Mareel M. M., Van Roy F. M. and Birchmeier W. (1989). Dissecting tumor cell invasion: epithelial cells acquire invasive properties after the loss of uvomorulin-mediated cell-cell adhesion. J. Cell Biol. 108, 2435-2447. 10.1083/jcb.108.6.2435 - DOI - PMC - PubMed
    1. Brouxhon S., Kyrkanides S., O'Banion M. K., Johnson R., Pearce D. A., Centola G. M., Miller J.-n. N., McGrath K. H., Erdle B., Scott G. et al. (2007). Sequential down-regulation of E-cadherin with squamous cell carcinoma progression: loss of E-cadherin via a prostaglandin E2-EP2 dependent posttranslational mechanism. Cancer Res. 67, 7654-7664. 10.1158/0008-5472.CAN-06-4415 - DOI - PubMed

Publication types

MeSH terms