. 2015 Dec 1;128(23):4442-52.
doi: 10.1242/jcs.180026. Epub 2015 Oct 19.

CaV3.2 T-type channels mediate Ca²⁺ entry during oocyte maturation and following fertilization

Affiliations

CaV3.2 T-type channels mediate Ca²⁺ entry during oocyte maturation and following fertilization

Miranda L Bernhardt et al. J Cell Sci. .

Abstract

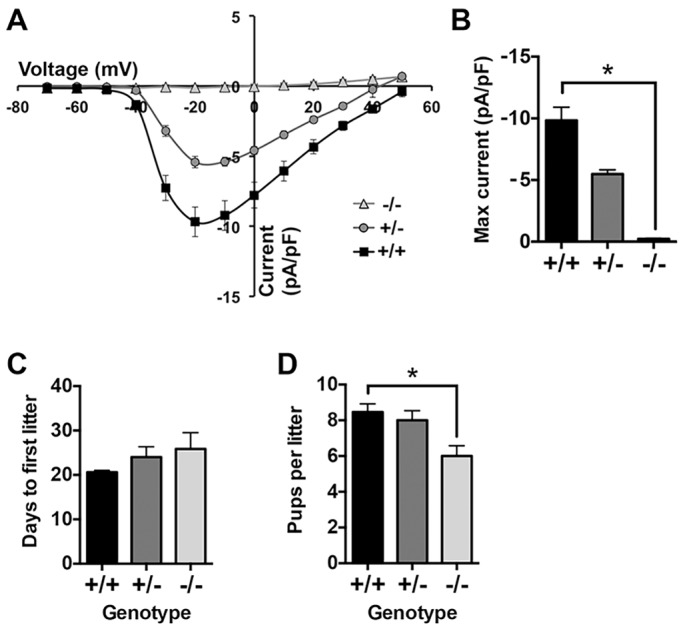
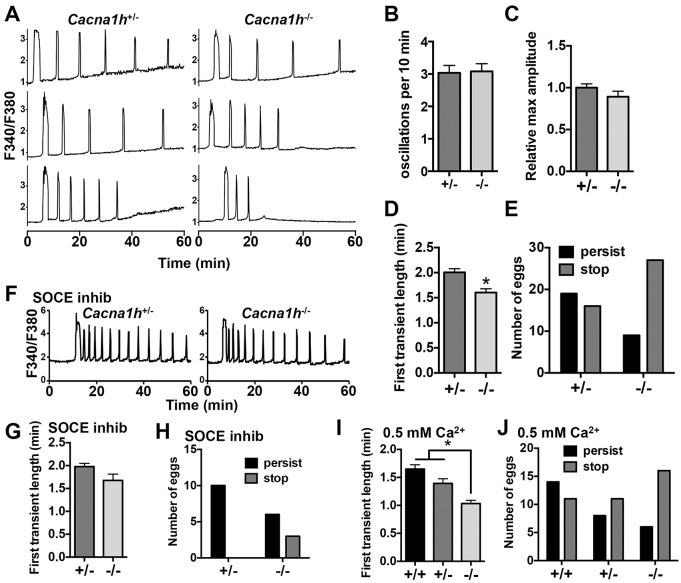
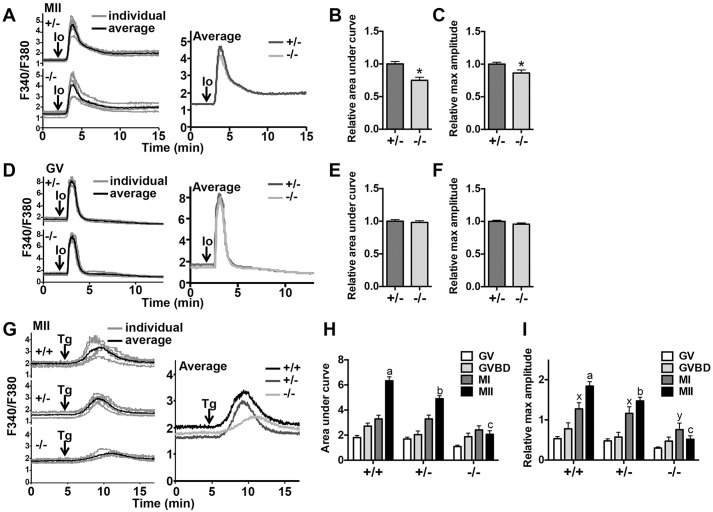
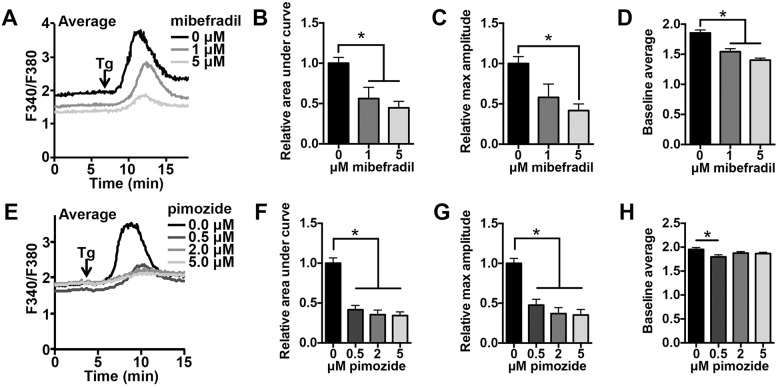
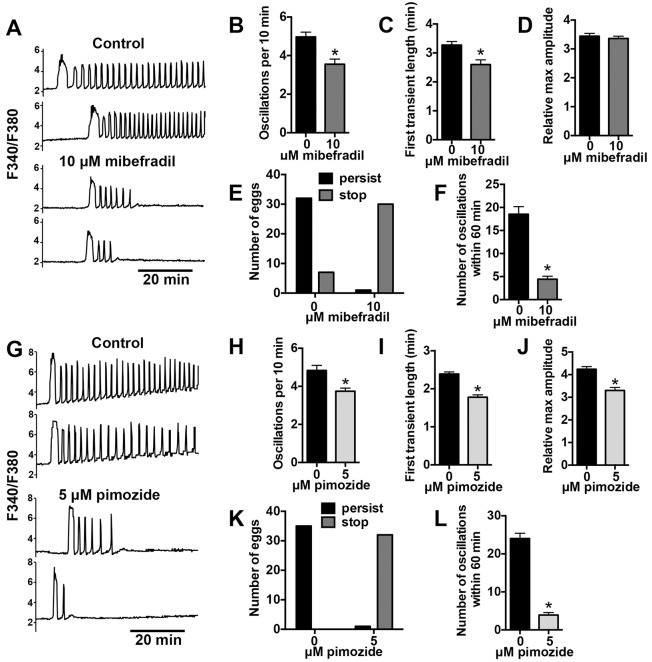
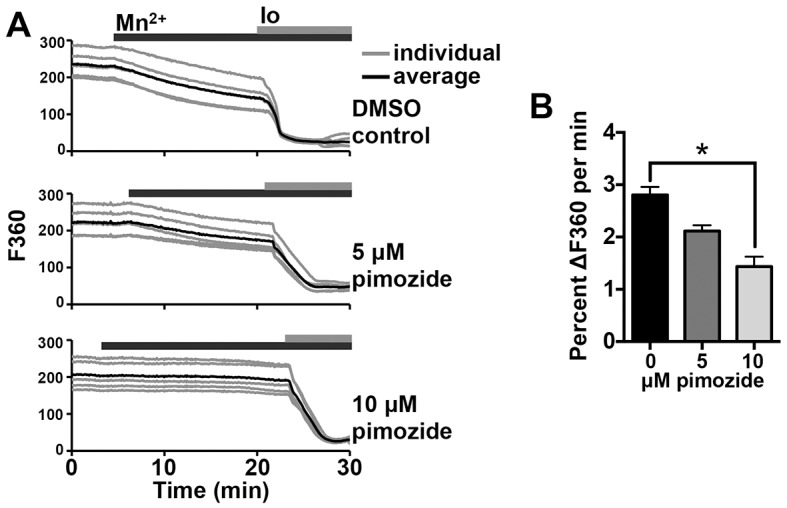
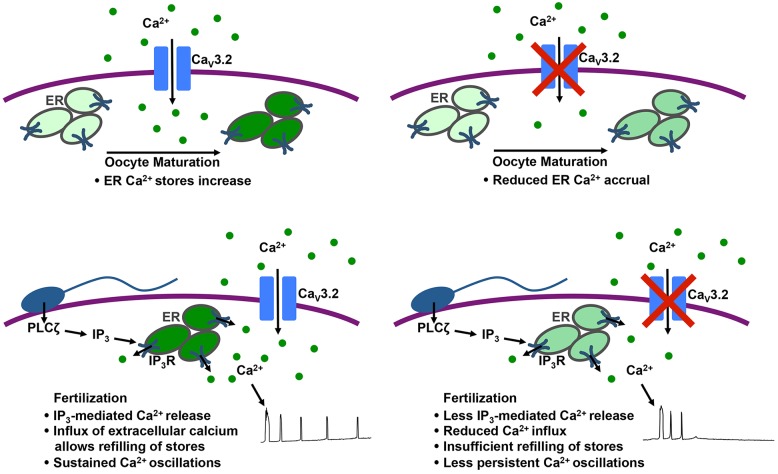
Initiation of mouse embryonic development depends upon a series of fertilization-induced rises in intracellular Ca(2+). Complete egg activation requires influx of extracellular Ca(2+); however, the channels that mediate this influx remain unknown. Here, we tested whether the α1 subunit of the T-type channel CaV3.2, encoded by Cacna1h, mediates Ca(2+) entry into oocytes. We show that mouse eggs express a robust voltage-activated Ca(2+) current that is completely absent in Cacna1h(-/-) eggs. Cacna1h(-/-) females have reduced litter sizes, and careful analysis of Ca(2+) oscillation patterns in Cacna1h(-/-) eggs following in vitro fertilization (IVF) revealed reductions in first transient length and oscillation persistence. Total and endoplasmic reticulum (ER) Ca(2+) stores were also reduced in Cacna1h(-/-) eggs. Pharmacological inhibition of CaV3.2 in wild-type CF-1 strain eggs using mibefradil or pimozide reduced Ca(2+) store accumulation during oocyte maturation and reduced Ca(2+) oscillation persistence, frequency and number following IVF. Overall, these data show that CaV3.2 T-type channels have prev8iously unrecognized roles in supporting the meiotic-maturation-associated increase in ER Ca(2+) stores and mediating Ca(2+) influx required for the activation of development.

Keywords: Ca2+; Egg activation; Fertilization; Meiosis; Oocyte; T-type channel.


Conflict of interest statement

Competing interests

The authors declare no competing or financial interests.

Figures

Fig. 1.
Fig. 1.
Cacna1h−/− eggs lack T-type Ca2+ currents, and Cacna1h−/− females are subfertile. (A,B) Whole-cell recordings were performed in the presence of 20 mM extracellular Ca2+. Current–voltage (IV) relationship and maximum current are graphed for each genotype (n=9, 3 or 11 eggs from three Cacna1h+/+, one Cacna1h+/− and three Cacna1h−/− mice, respectively). *P<0.05 (Kruskal–Wallis test with Dunn's multiple comparison test). Cacna1h+/+, Cacna1h+/− and Cacna1h−/− females were bred with wild-type C57BL/6J males for 15 weeks. (C) Time to first litter in days (n=5–6 pairs per genotype). Results are not significantly different (Kruskal–Wallis test). (D) Graph of average number of pups per litter (n=15–18 litters per genotype). *P<0.05 (Kruskal–Wallis test with Dunn's multiple comparison). Results are mean±s.e.m.
Fig. 2.
Fig. 2.
Ca2+ oscillation pattern following IVF for Cacna1h−/− eggs. Ratiometric Ca2+ imaging of Cacna1h+/− and Cacna1h−/− eggs was performed during IVF. (A) Representative traces are shown. (B,C) Graphs show oscillation frequency and relative maximum amplitude (n=22–24 eggs per genotype over three replicate experiments). Results are not significantly different (Mann–Whitney test). (D) First transient length in minutes (n=36–37 eggs per genotype over seven replicate experiments). *P<0.05 (Mann–Whitney test). (E) Persistence of oscillations to the end of the 60-min imaging period differed significantly between genotypes (P<0.05, Fisher's exact test, n=35–36 eggs per genotype over seven replicate experiments). (F–H) IVF experiments were repeated with addition of 2 μM GSK1349571A (SOCE inhibitor) to the imaging medium; representative traces and graphs of first transient length and oscillation persistence are shown (n=9–12 eggs per genotype over three replicate experiments). Results are not significantly different (Mann–Whitney and Fisher's exact test). (I,J) IVF experiments were performed in low-Ca2+ medium (0.5 mM) with Cacna1h+/+, Cacna1h+/−, and Cacna1h−/− eggs; graphs of first transient length and oscillation persistence are shown (n=19–25 eggs per genotype over five replicate experiments). *P<0.05 (Kruskal-Wallis with Dunn's multiple comparison test) in I; and P<0.05 in J (χ-square test for trend). Results are mean±s.e.m.
Fig. 3.
Fig. 3.
Total and ER Ca2+ stores are reduced in Cacna1h−/− eggs and maturing oocytes. Ionomycin-induced Ca2+ release was measured for Cacna1h+/− and Cacna1h−/− eggs and germinal vesicle (GV) oocytes. (A,D) Representative curves are shown for individual eggs or oocytes (gray lines) and as averages for 5–6 cells (black lines); average traces for both genotypes are also shown on the same graph for comparison. (B,C) Area under the curve and maximum amplitude were graphed for MII eggs (n=21 eggs per genotype over four replicate experiments). *P<0.05 (unpaired t-test with Welch's correction). (E,F) Graphs of area under the curve and maximum amplitude for germinal vesicle oocytes (n=44–50 oocytes per genotype from eight replicate experiments). Results are not significantly different (unpaired t-test with Welch's correction). (G) Representative traces of thapsigargin-induced Ca2+ release for individual MII eggs (gray lines) and averages for five eggs (black lines) are shown, along with compiled averages on one graph. (H,I) Area under the curve and maximum amplitude relative to baseline are graphed for Cacna1h+/+, Cacna1h+/− and Cacna1h−/− MII eggs and IVM oocytes. GVBD oocytes were assayed after 2.5 h of IVM, MI oocytes after 5.75–6.5 h IVM, and MII eggs at 15.5–17.5 h after hCG administration. 12–25 oocytes or eggs were assayed per genotype over three to five experimental replicates for each developmental stage. a,b,c,x,yP<0.05 (two-way ANOVA with Tukey's multiple comparison test; different letters show significant differences between genotypes for each developmental time point). Io, ionomycin; Tg, thapsigargin. Results are mean±s.e.m.
Fig. 4.
Fig. 4.
Inhibition of T-type channels during in vitro maturation impairs ER Ca2+ store accumulation. Germinal-vesicle-stage oocytes were collected and matured in vitro in the presence or absence of T-type channel inhibitors, mibefradil and pimozide. (A) Representative thapsigargin-induced Ca2+ release curves are shown for oocytes matured in 0, 1 or 5 μM mibefradil; each trace shows average data for 4–5 MII eggs. (B–D) Graphs of relative area under the curve, maximum amplitude relative to baseline and average baseline are shown (n=8–9 eggs per treatment from two experimental replicates). *P<0.05 (one-way ANOVA with Tukey's multiple comparison test). (E) Representative average Ca2+ traces from 4-5 MII eggs matured in 0, 0.5, 2, or 5 μM pimozide are shown. (F-H) Graphs of relative area under the curve, maximum amplitude relative to baseline and average baseline are shown (n=16–18 eggs per treatment from four experimental replicates). *P<0.05 (Kruskal-Wallis with Dunn's multiple comparison test). All assays were performed after 14.5–17.5 h IVM. Tg, thapsigargin. Results are mean±s.e.m.
Fig. 5.
Fig. 5.
Inhibition of T-type channels impairs Ca2+ oscillations following IVF. Wild-type CF-1 eggs were fertilized in vitro in the presence of mibefradil, pimozide or vehicle control. (A,G) Representative traces of Ca2+ response following IVF are shown. (B–F,H–L) Ca2+ oscillation parameters and persistence to the end of the 60-min imaging period are graphed as indicated (n=29–38 eggs per treatment over three replicate experiments). *P<0.05 for B–C, F, H–J and L (unpaired t-test with Welch's correction or Mann-Whitney, as appropriate), and oscillation persistence between treatments was significantly different in E and K (P<0.05, Fisher's exact test).
Fig. 6.
Fig. 6.
Inhibition of T-type channels reduces constitutive divalent cation influx. Mn2+-quenching assays were performed using fura-2-AM-loaded MII eggs. (A) Representative graphs of F360 are shown for individual eggs (gray lines) and averages for five eggs (black lines). Top panel, DMSO control; middle panel, 5 µM pimozide; bottom panel, 10 µM pimozide. (B) The rate of decrease in F360 from min 2–7 following Mn2+ addition, relative to baseline fluorescence and minimum fluorescence level within 10 min after ionomycin addition, is shown (n=23–36 eggs over 2–3 replicate experiments per treatment). *P<0.05 (Kruskal–Wallis with Dunn's multiple comparison test). Io, ionomycin. Results are mean±s.e.m.
Fig. 7.
Fig. 7.
Schematic showing role of CaV3.2 Ca2+ channels during oocyte maturation and after fertilization. Upper images: CaV3.2 channels mediate Ca2+ accrual during oocyte maturation. Lower images: CaV3.2 channels mediate Ca2+ influx needed to support sustained Ca2+ oscillations following fertilization. Intensity of green color indicates relative ER Ca2+ level. ER, endoplasmic reticulum; IP3R, IP3 receptor; PLCζ, phospholipase C zeta.

Similar articles

Cited by

References

    1. Arnoult C., Cardullo R. A., Lemos J. R. and Florman H. M. (1996). Activation of mouse sperm T-type Ca2+ channels by adhesion to the egg zona pellucida. Proc. Natl. Acad. Sci. USA 93, 13004-13009. 10.1073/pnas.93.23.13004 - DOI - PMC - PubMed
    1. Arnoult C., Villaz M. and Florman H. M. (1998). Pharmacological properties of the T-type Ca2+ current of mouse spermatogenic cells. Mol. Pharmacol. 53, 1104-1111. - PubMed
    1. Backs J., Stein P., Backs T., Duncan F. E., Grueter C. E., McAnally J., Qi X., Schultz R. M. and Olson E. N. (2010). The gamma isoform of CaM kinase II controls mouse egg activation by regulating cell cycle resumption. Proc. Natl. Acad. Sci. USA 107, 81-86. 10.1073/pnas.0912658106 - DOI - PMC - PubMed
    1. Bernhardt M. L., Kim A. M., O'Halloran T. V. and Woodruff T. K. (2011). Zinc requirement during meiosis I-meiosis II transition in mouse oocytes is independent of the MOS-MAPK pathway. Biol. Reprod. 84, 526-536. 10.1095/biolreprod.110.086488 - DOI - PMC - PubMed
    1. Bird G. S., DeHaven W. I., Smyth J. T. and Putney J. W. Jr. (2008). Methods for studying store-operated calcium entry. Methods 46, 204-212. 10.1016/j.ymeth.2008.09.009 - DOI - PMC - PubMed

Publication types

LinkOut - more resources