

Dopamine D3 Receptor Modulates l-DOPA-Induced Dyskinesia by Targeting D1 Receptor-Mediated Striatal Signaling
- PMID: 26483399
- PMCID: PMC5939228
- DOI: 10.1093/cercor/bhv231
Dopamine D3 Receptor Modulates l-DOPA-Induced Dyskinesia by Targeting D1 Receptor-Mediated Striatal Signaling
Abstract
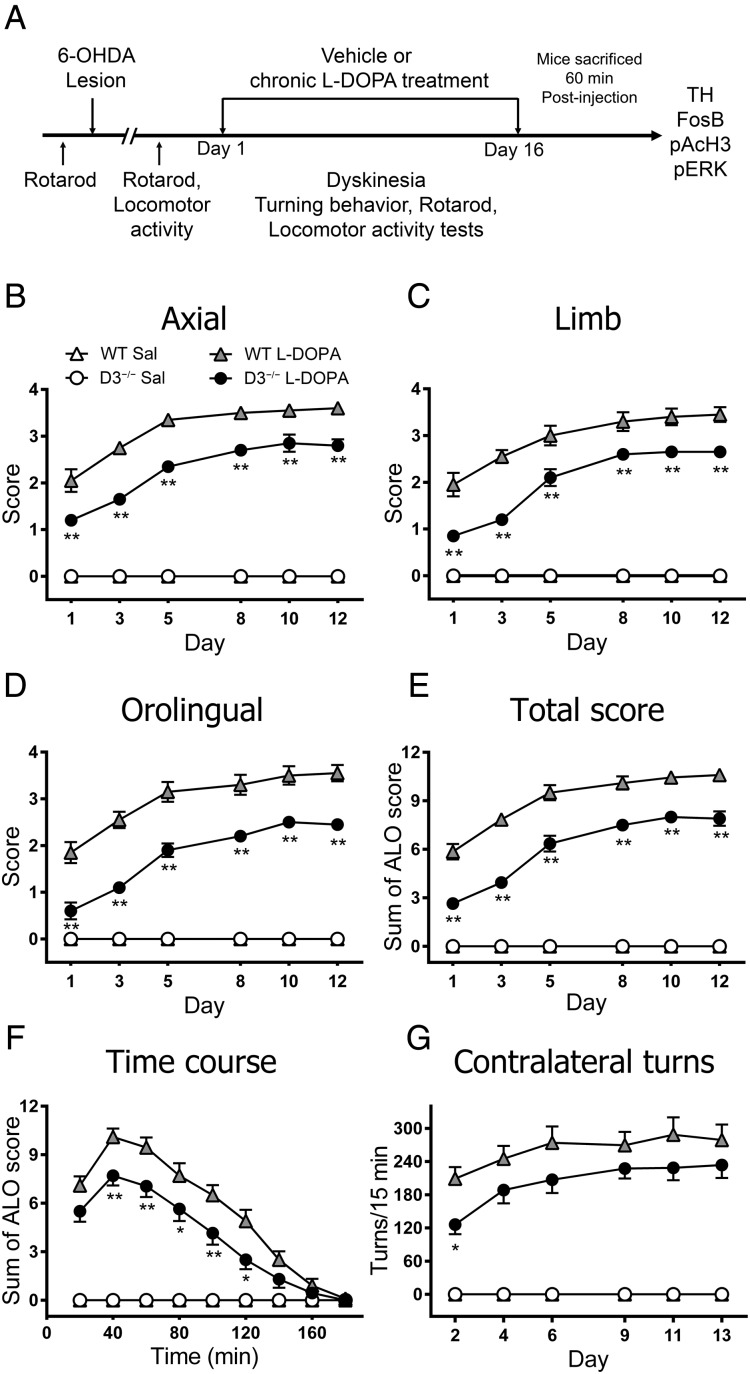
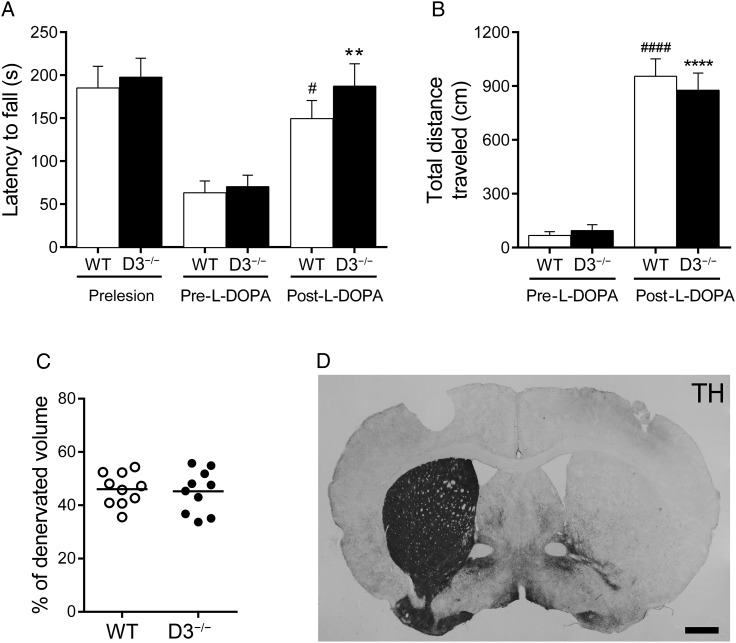
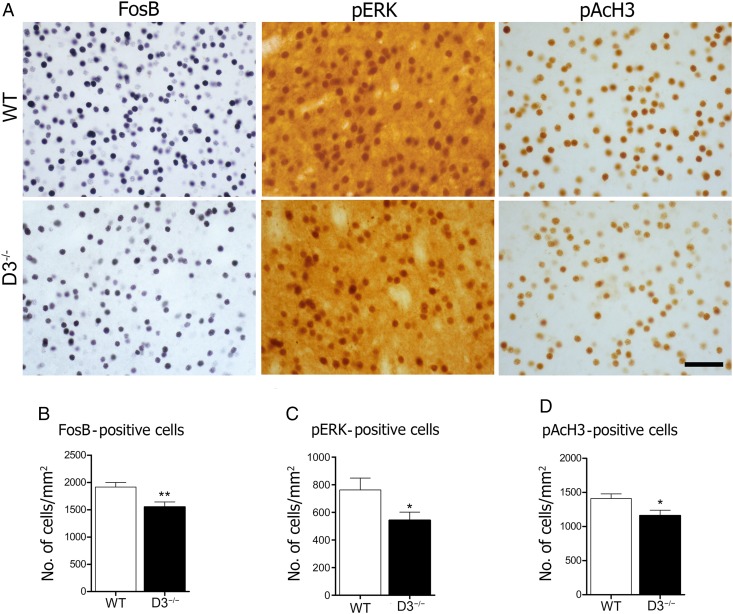
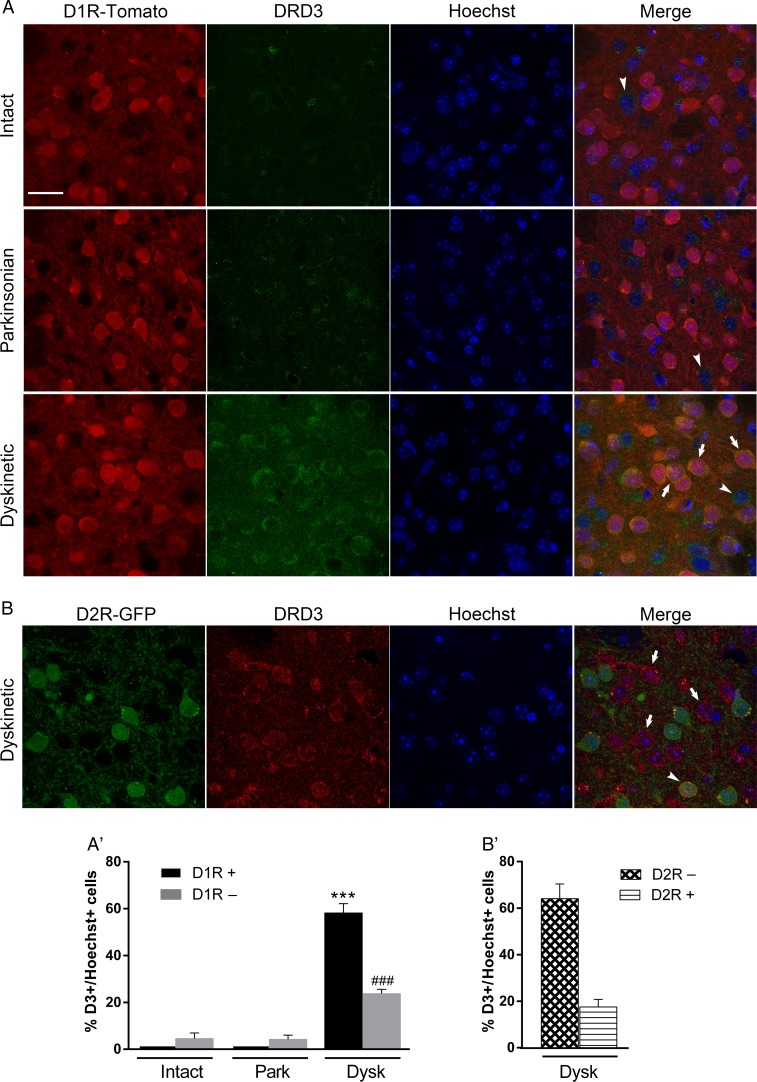
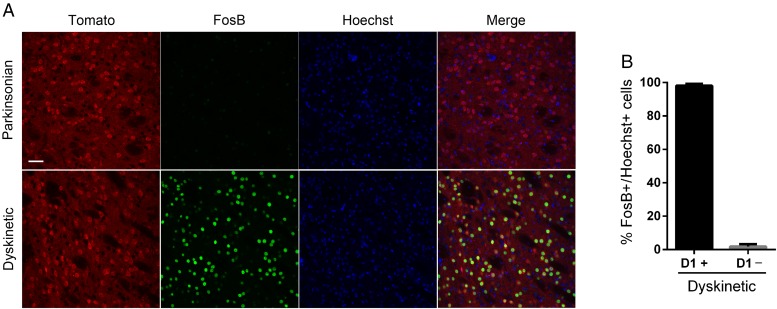
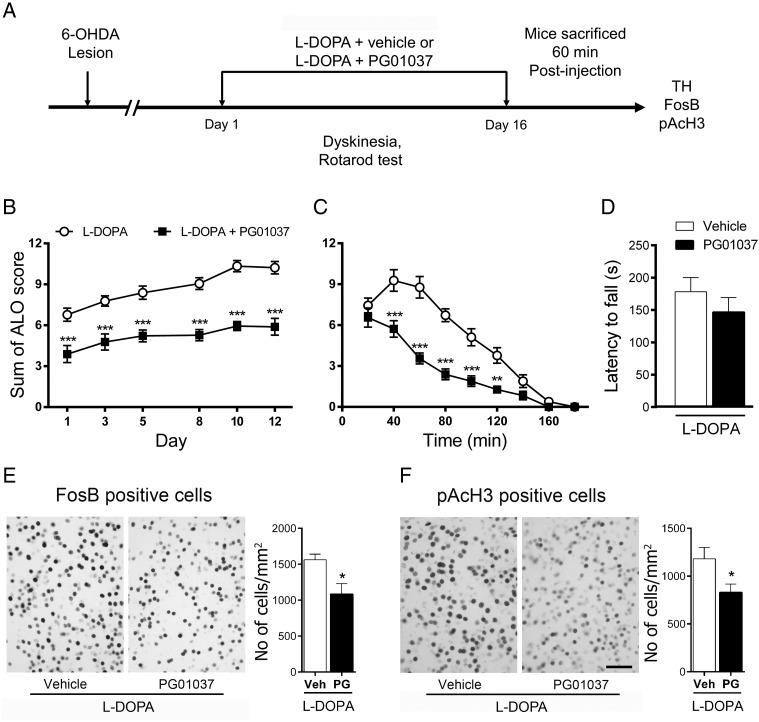
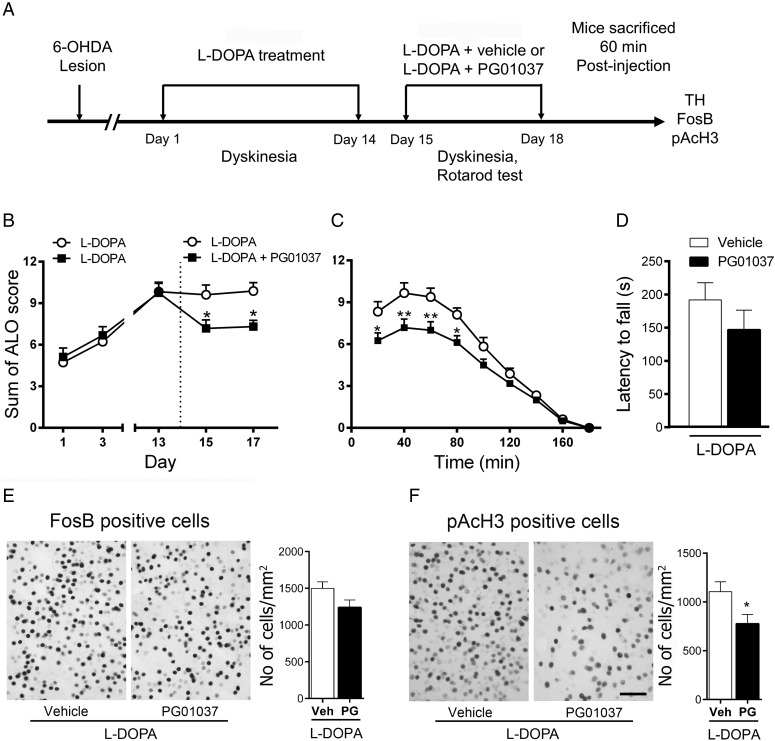
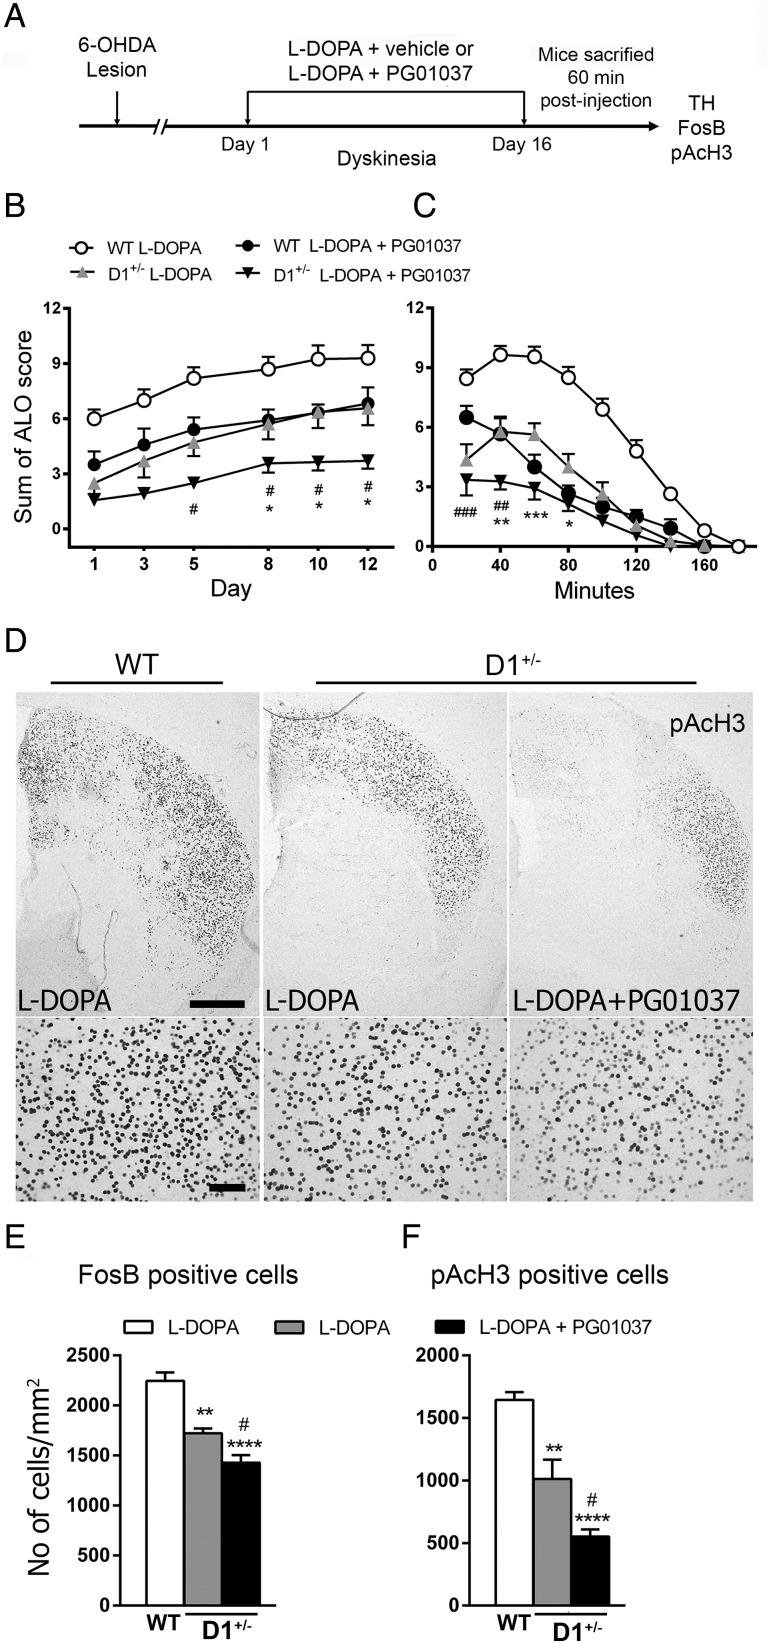
The dopamine D3 receptor (D3R) belongs to the dopamine D2-like receptor family and is principally located in the ventral striatum. However, previous studies reported D3R overexpression in the dorsal striatum following l-DOPA treatment in parkinsonian animals. This fact has drawn attention in the importance of D3R in l-DOPA-induced dyskinesia (LID). Here, we used D3R knockout mice to assess the role of D3R in LID and rotational sensitization in the hemiparkinsonian model. Mice lacking D3R presented a reduction in dyskinesia without interfering with the antiparkinsonian l-DOPA effect and were accompanied by a reduction in the l-DOPA-induced rotations. Interestingly, deleting D3R attenuated important molecular markers in the D1R-neurons such as FosB, extracellular signal-regulated kinase, and histone-3 (H3)-activation. Colocalization studies in D1R-tomato and D2R-green fluorescent protein BAC-transgenic mice indicated that l-DOPA-induced D3R overexpression principally occurs in D1R-containing neurons although it is also present in the D2R-neurons. Moreover, D3R pharmacological blockade with PG01037 reduced dyskinesia and the molecular markers expressed in D1R-neurons. In addition, this antagonist further reduced dyskinetic symptoms in D1R heterozygous mice, indicating a direct interaction between D1R and D3R. Together, our results demonstrate that D3R modulates the development of dyskinesia by targeting D1R-mediated intracellular signaling and suggest that decreasing D3R activity may help to ameliorate LID.
Keywords: Parkinson disease; abnormal involuntary movements; basal ganglia; behavioral sensitization; striatonigral.
© The Author 2015. Published by Oxford University Press. All rights reserved. For Permissions, please e-mail: journals.permissions@oup.com.
Figures
Similar articles
-
Behavioral and cellular dopamine D1 and D3 receptor-mediated synergy: Implications for L-DOPA-induced dyskinesia.Neuropharmacology. 2018 Aug;138:304-314. doi: 10.1016/j.neuropharm.2018.06.024. Epub 2018 Jun 21. Neuropharmacology. 2018. PMID: 29936243 Free PMC article.
-
Reciprocal cross-sensitization of D1 and D3 receptors following pharmacological stimulation in the hemiparkinsonian rat.Psychopharmacology (Berl). 2020 Jan;237(1):155-165. doi: 10.1007/s00213-019-05353-6. Epub 2019 Aug 21. Psychopharmacology (Berl). 2020. PMID: 31435690
-
5alpha-reductase inhibitors dampen L-DOPA-induced dyskinesia via normalization of dopamine D1-receptor signaling pathway and D1-D3 receptor interaction.Neurobiol Dis. 2019 Jan;121:120-130. doi: 10.1016/j.nbd.2018.09.018. Epub 2018 Sep 24. Neurobiol Dis. 2019. PMID: 30261284
-
Dopamine receptors: homomeric and heteromeric complexes in L-DOPA-induced dyskinesia.J Neural Transm (Vienna). 2018 Aug;125(8):1187-1194. doi: 10.1007/s00702-018-1852-x. Epub 2018 Feb 7. J Neural Transm (Vienna). 2018. PMID: 29417335 Review.
-
The D3 dopamine receptor: From structural interactions to function.Eur Neuropsychopharmacol. 2015 Sep;25(9):1462-9. doi: 10.1016/j.euroneuro.2014.11.021. Epub 2014 Dec 9. Eur Neuropsychopharmacol. 2015. PMID: 25532864 Review.
Cited by
-
Dopamine Receptors: Is It Possible to Become a Therapeutic Target for Depression?Front Pharmacol. 2022 Aug 17;13:947785. doi: 10.3389/fphar.2022.947785. eCollection 2022. Front Pharmacol. 2022. PMID: 36059987 Free PMC article. Review.
-
Riluzole Attenuates L-DOPA-Induced Abnormal Involuntary Movements Through Decreasing CREB1 Activity: Insights from a Rat Model.Mol Neurobiol. 2019 Jul;56(7):5111-5121. doi: 10.1007/s12035-018-1433-x. Epub 2018 Nov 27. Mol Neurobiol. 2019. PMID: 30484112 Free PMC article.
-
Safety and tolerability of IRL790 in Parkinson's disease with levodopa-induced dyskinesia-a phase 1b trial.NPJ Parkinsons Dis. 2018 Dec 6;4:35. doi: 10.1038/s41531-018-0071-3. eCollection 2018. NPJ Parkinsons Dis. 2018. PMID: 30534585 Free PMC article.
-
Neurophysiological Treatment Effects of Mesdopetam, Pimavanserin and Amantadine in a Rodent Model of Levodopa-Induced Dyskinesia.Eur J Neurosci. 2025 Mar;61(5):e70032. doi: 10.1111/ejn.70032. Eur J Neurosci. 2025. PMID: 40042199 Free PMC article.
-
Connectome and molecular pharmacological differences in the dopaminergic system in restless legs syndrome (RLS): plastic changes and neuroadaptations that may contribute to augmentation.Sleep Med. 2017 Mar;31:71-77. doi: 10.1016/j.sleep.2016.06.003. Epub 2016 Jun 27. Sleep Med. 2017. PMID: 27539027 Free PMC article. Review.
References
-
- Andersson M, Hilbertson A, Cenci MA. 1999. Striatal fosB expression is causally linked with l-DOPA-induced abnormal involuntary movements and the associated upregulation of striatal prodynorphin mRNA in a rat model of Parkinson's disease. Neurobiol Dis. 6:461–474. - PubMed
-
- Beaulieu JM, Gainetdinov RR. 2011. The physiology, signaling, and pharmacology of dopamine receptors. Pharmacol Rev. 63:182–217. - PubMed
-
- Bézard E, Ferry S, Mach U, Stark H, Leriche L, Boraud T, Gross C, Sokoloff P. 2003. Attenuation of levodopa-induced dyskinesia by normalizing dopamine D3 receptor function. Nat Med. 9:762–767. - PubMed
Publication types
MeSH terms
Substances
Grants and funding
LinkOut - more resources
Full Text Sources
Other Literature Sources
Molecular Biology Databases
Miscellaneous
