

Bovine Immunoinhibitory Receptors Contribute to Suppression of Mycobacterium avium subsp. paratuberculosis-Specific T-Cell Responses
- PMID: 26483406
- PMCID: PMC4694020
- DOI: 10.1128/IAI.01014-15
Bovine Immunoinhibitory Receptors Contribute to Suppression of Mycobacterium avium subsp. paratuberculosis-Specific T-Cell Responses
Abstract
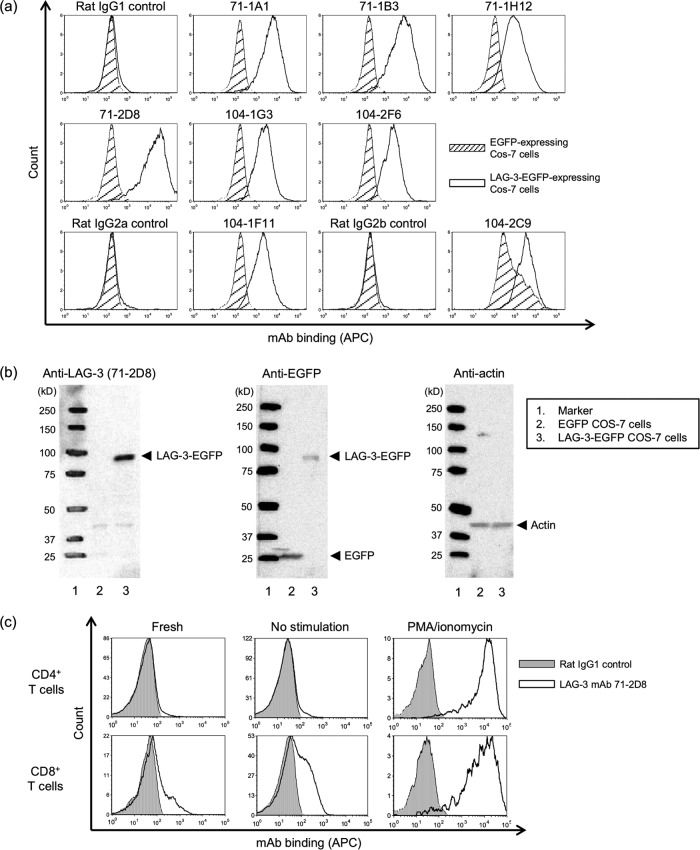
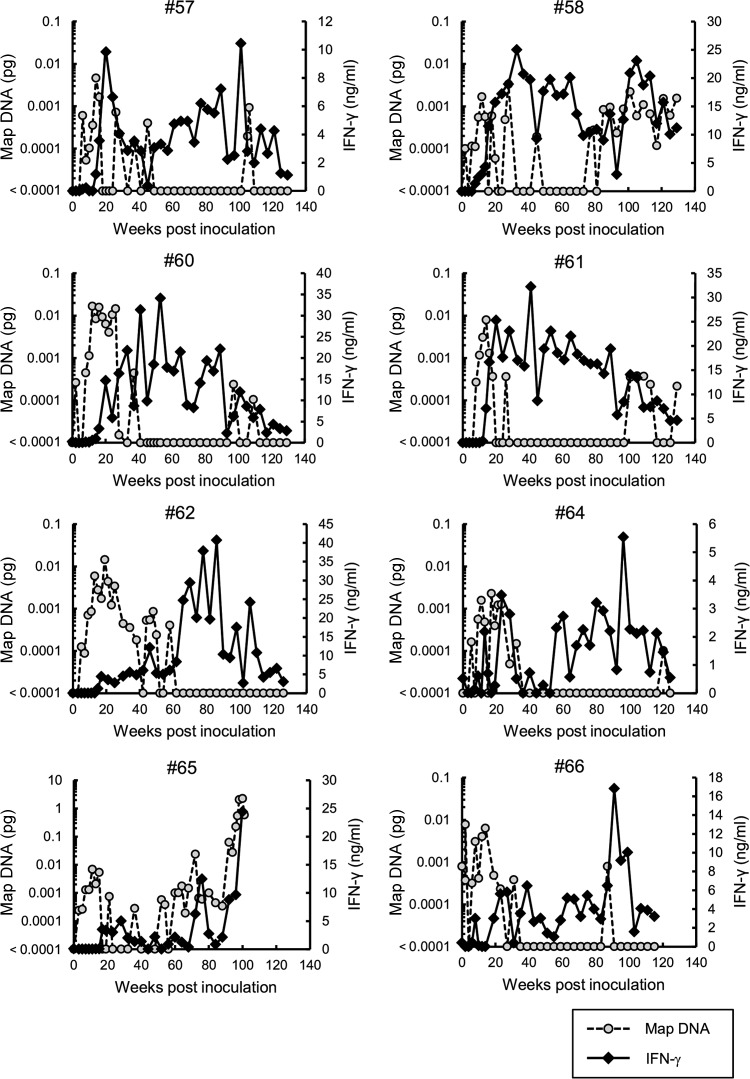
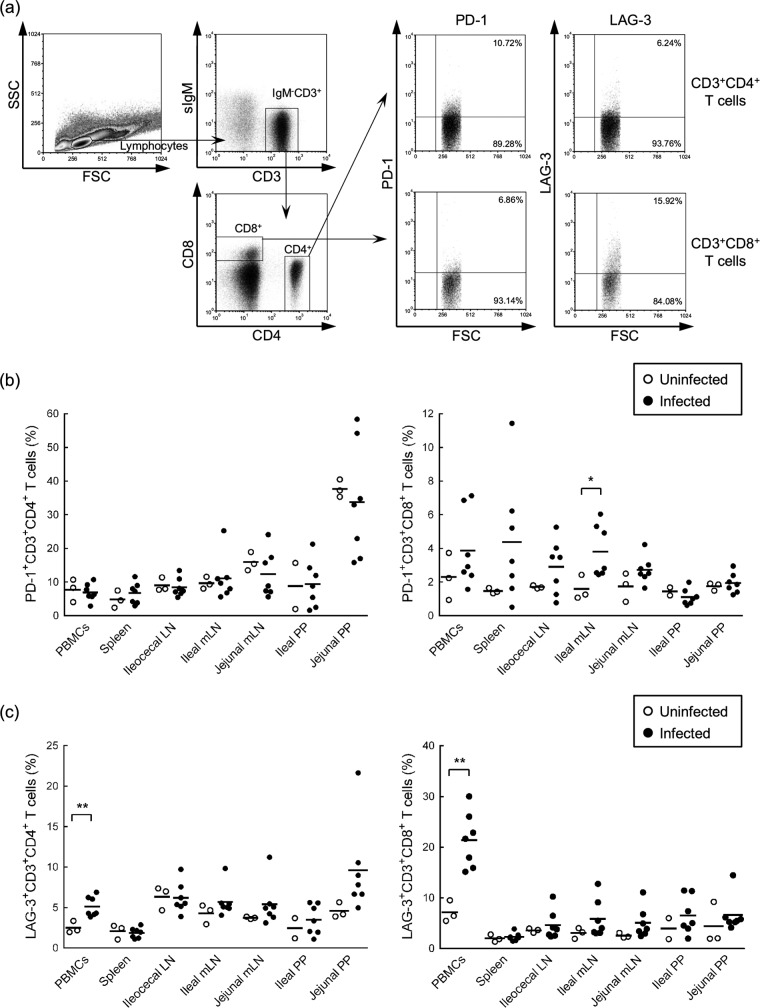
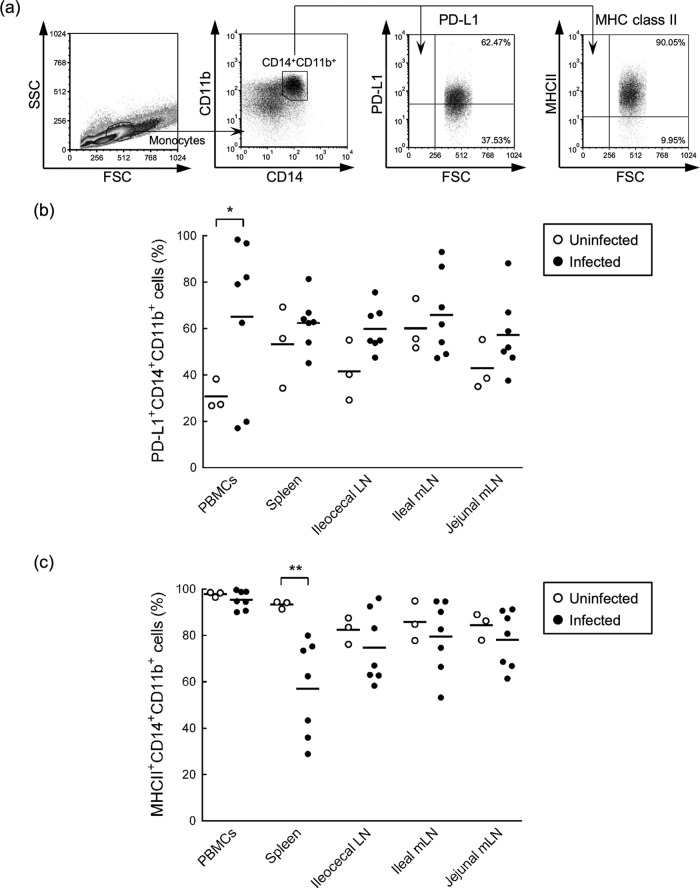
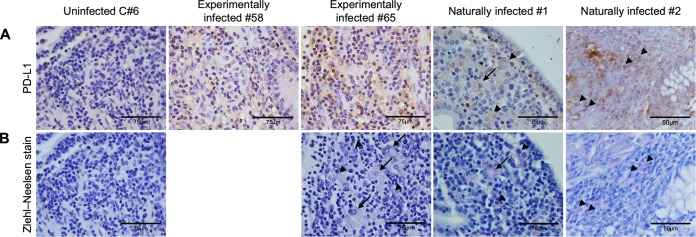
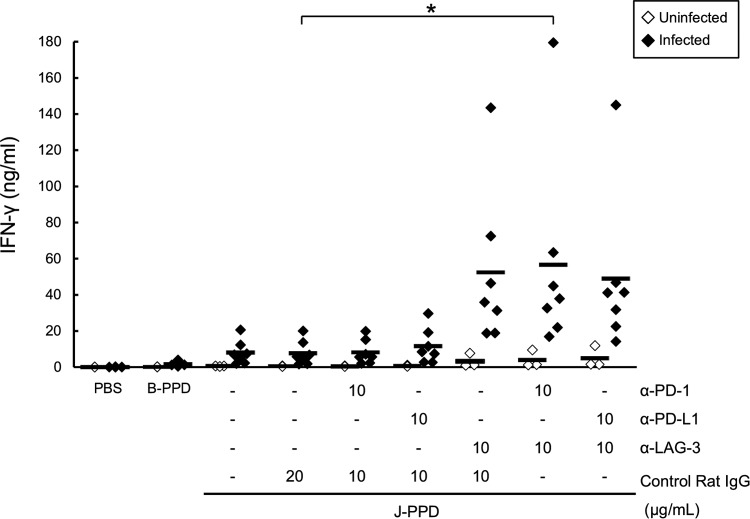
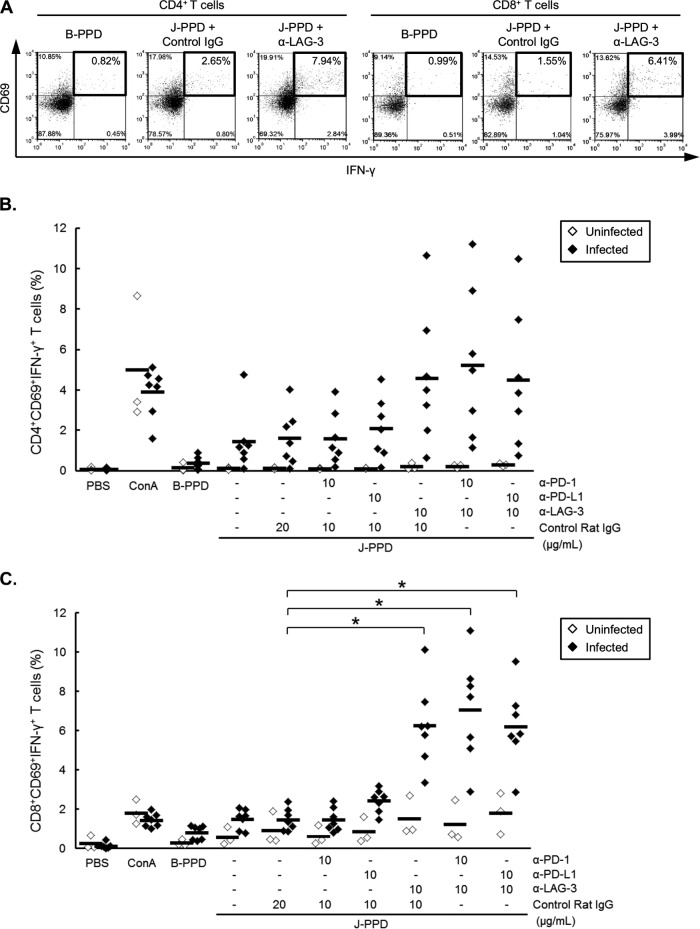
Johne's disease (paratuberculosis) is a chronic enteritis in cattle that is caused by intracellular infection with Mycobacterium avium subsp. paratuberculosis. This infection is characterized by the functional exhaustion of T-cell responses to M. avium subsp. paratuberculosis antigens during late subclinical and clinical stages, presumably facilitating the persistence of this bacterium and the formation of clinical lesions. However, the mechanisms underlying T-cell exhaustion in Johne's disease are poorly understood. Thus, we performed expression and functional analyses of the immunoinhibitory molecules programmed death-1 (PD-1)/PD-ligand 1 (PD-L1) and lymphocyte activation gene 3 (LAG-3)/major histocompatibility complex class II (MHC-II) in M. avium subsp. paratuberculosis-infected cattle during the late subclinical stage. Flow cytometric analyses revealed the upregulation of PD-1 and LAG-3 in T cells in infected animals, which suffered progressive suppression of interferon gamma (IFN-γ) responses to the M. avium subsp. paratuberculosis antigen. In addition, PD-L1 and MHC-II were expressed on macrophages from infected animals, consistent with PD-1 and LAG-3 pathways contributing to the suppression of IFN-γ responses during the subclinical stages of M. avium subsp. paratuberculosis infection. Furthermore, dual blockade of PD-L1 and LAG-3 enhanced M. avium subsp. paratuberculosis-specific IFN-γ responses in blood from infected animals, and in vitro LAG-3 blockade enhanced IFN-γ production from M. avium subsp. paratuberculosis-specific CD4(+) and CD8(+) T cells. Taken together, the present data indicate that M. avium subsp. paratuberculosis-specific T-cell exhaustion is in part mediated by PD-1/PD-L1 and LAG-3/MHC-II interactions and that LAG-3 is a molecular target for the control of M. avium subsp. paratuberculosis-specific T-cell responses.
Copyright © 2015, American Society for Microbiology. All Rights Reserved.
Figures
Similar articles
-
Failure of antigen-stimulated gammadelta T cells and CD4+ T cells from sensitized cattle to upregulate nitric oxide and mycobactericidal activity of autologous Mycobacterium avium subsp. paratuberculosis-infected macrophages.Vet Immunol Immunopathol. 2007 Mar 15;116(1-2):1-12. doi: 10.1016/j.vetimm.2006.12.005. Epub 2007 Jan 9. Vet Immunol Immunopathol. 2007. PMID: 17275098 Free PMC article.
-
Prostaglandin E2 Induction Suppresses the Th1 Immune Responses in Cattle with Johne's Disease.Infect Immun. 2018 Apr 23;86(5):e00910-17. doi: 10.1128/IAI.00910-17. Print 2018 May. Infect Immun. 2018. PMID: 29483289 Free PMC article.
-
Mycobacterium avium subsp. paratuberculosis inhibits gamma interferon-induced signaling in bovine monocytes: insights into the cellular mechanisms of Johne's disease.Infect Immun. 2012 Sep;80(9):3039-48. doi: 10.1128/IAI.00406-12. Epub 2012 Jun 11. Infect Immun. 2012. PMID: 22689821 Free PMC article.
-
Immune exhaustion during chronic infections in cattle.J Vet Med Sci. 2017 Jan 20;79(1):1-5. doi: 10.1292/jvms.16-0354. Epub 2016 Oct 8. J Vet Med Sci. 2017. PMID: 27725355 Free PMC article. Review.
-
Regulatory T cells in cattle and their potential role in bovine paratuberculosis.Comp Immunol Microbiol Infect Dis. 2012 May;35(3):233-9. doi: 10.1016/j.cimid.2012.01.004. Epub 2012 Jan 27. Comp Immunol Microbiol Infect Dis. 2012. PMID: 22285689 Review.
Cited by
-
Variations in T cell transcription factor gene structure and expression associated with the two disease forms of sheep paratuberculosis.Vet Res. 2016 Aug 17;47(1):83. doi: 10.1186/s13567-016-0368-3. Vet Res. 2016. PMID: 27530627 Free PMC article.
-
Immune Evasion of Mycoplasma bovis.Pathogens. 2021 Mar 4;10(3):297. doi: 10.3390/pathogens10030297. Pathogens. 2021. PMID: 33806506 Free PMC article. Review.
-
Evaluation of Immune Exhaustion and Co-Inhibitory Receptor Expression in Mycobacterium avium Subspecies paratuberculosis (MAP) Seropositive Diarrhoeic Bovines.Pathogens. 2024 Jun 4;13(6):473. doi: 10.3390/pathogens13060473. Pathogens. 2024. PMID: 38921771 Free PMC article.
-
T-cell Homing Therapy for Reducing Regulatory T Cells and Preserving Effector T-cell Function in Large Solid Tumors.Clin Cancer Res. 2018 Jun 15;24(12):2920-2934. doi: 10.1158/1078-0432.CCR-17-1365. Epub 2018 Feb 1. Clin Cancer Res. 2018. PMID: 29391351 Free PMC article.
-
A canine chimeric monoclonal antibody targeting PD-L1 and its clinical efficacy in canine oral malignant melanoma or undifferentiated sarcoma.Sci Rep. 2017 Aug 21;7(1):8951. doi: 10.1038/s41598-017-09444-2. Sci Rep. 2017. PMID: 28827658 Free PMC article.
References
-
- Burrells C, Clarke C, Colston A, Kay J, Porter J, Little D, Sharp J. 1998. A study of immunological responses of sheep clinically affected with paratuberculosis (Johne's disease): the relationship of blood, mesenteric lymph node and intestinal lymphocyte responses to gross and microscopic pathology. Vet Immunol Immunopathol 66:343–358. doi:10.1016/S0165-2427(98)00201-3. - DOI - PubMed
Publication types
MeSH terms
Substances
LinkOut - more resources
Full Text Sources
Other Literature Sources
Research Materials
