. 2015 Oct 19;36(1):119-31.
doi: 10.1128/MCB.00501-15. Print 2016 Jan 1.

NFAT2 Isoforms Differentially Regulate Gene Expression, Cell Death, and Transformation through Alternative N-Terminal Domains

Affiliations

NFAT2 Isoforms Differentially Regulate Gene Expression, Cell Death, and Transformation through Alternative N-Terminal Domains

Pedro I Lucena et al. Mol Cell Biol. .

Abstract

The NFAT (nuclear factor of activated T cells) family of transcription factors is composed of four calcium-responsive proteins (NFAT1 to -4). The NFAT2 (also called NFATc1) gene encodes the isoforms NFAT2α and NFAT2β that result mainly from alternative initiation exons that provide two different N-terminal transactivation domains. However, the specific roles of the NFAT2 isoforms in cell physiology remain unclear. Because previous studies have shown oncogenic potential for NFAT2, this study emphasized the role of the NFAT2 isoforms in cell transformation. Here, we show that a constitutively active form of NFAT2α (CA-NFAT2α) and CA-NFAT2β distinctly control death and transformation in NIH 3T3 cells. While CA-NFAT2α strongly induces cell transformation, CA-NFAT2β leads to reduced cell proliferation and intense cell death through the upregulation of tumor necrosis factor alpha (TNF-α). CA-NFAT2β also increases cell death and upregulates Fas ligand (FasL) and TNF-α in CD4(+) T cells. Furthermore, we demonstrate that differential roles of NFAT2 isoforms in NIH 3T3 cells depend on the N-terminal domain, where the NFAT2β-specific N-terminal acidic motif is necessary to induce cell death. Interestingly, the NFAT2α isoform is upregulated in Burkitt lymphomas, suggesting an isoform-specific involvement of NFAT2 in cancer development. Finally, our data suggest that alternative N-terminal domains of NFAT2 could provide differential mechanisms for the control of cellular functions.


Figures

FIG 1
FIG 1
NFAT2 isoforms play different roles in cell proliferation and death in NIH 3T3 fibroblasts. NIH 3T3 cells were infected with either the control pLIRES-EGFP vector (empty vector) or the pLIRES-EGFP-CA-NFAT2 vector. (A) Schematic alignment of the NFAT2 short isoforms. The NFAT2α and NFAT2β proteins differ only at the N terminus, which contains 42 amino acids in the NFAT2α protein, encoded by exon 1 of the gene, or 28 differential amino acids in the NFAT2β protein, encoded by exon 2. The identical shading patterns represent identical sequences. The numbers indicate the amino acid positions in the murine proteins. DBD, DNA-binding domain; NHR, NFAT homology region; TAD-N, N-terminal transactivation domain. (B) Western blotting of transduced NIH 3T3 cells. (C) Proliferation kinetic assay by crystal violet staining. The data are presented as means ± standard deviations of results from one representative experiment. O.D., optical density. (D) Cell death analysis by propidium iodide (PI) staining 72 h after plating at confluence. The percentage of cell death (sub-G0 DNA content) is indicated. All results are representative of data from at least three independent experiments.
FIG 2
FIG 2
CA-NFAT2α and CA-NFAT2β induce cell transformation with distinct intensities in NIH 3T3 cells. Cells were transduced with the empty vector or vectors containing cDNAs of NFAT2 isoforms. (A) Focus-forming assay. Transduced cells were mixed 1:4 with uninfected wild-type NIH 3T3 cells and grown for 10 to 14 days. For visualization of foci, the cells were stained with crystal violet. (B) Phase-contrast microscopy (left) and optical fluorescence microscopy for EGFP expression (right) of representative foci. The results are representative of data from at least three independent experiments. (C) Growth in semisolid medium. Transduced NIH 3T3 cells were grown in semisolid agarose medium, and colonies were counted 4 to 5 weeks after plating. Data are shown as means ± standard deviations of results from three independent experiments. *** indicates a P value of ≤0.001. (D) Phase-contrast microscopy (left) and optical fluorescence microscopy for EGFP expression (right) of representative colonies. (E) Tumor formation in nude mice. NIH 3T3 cells (5 × 10⁵ cells) were inoculated subcutaneously in the right flank of athymic BALB/c nude mice (n = 7). Tumor volumes were measured every 5 days, and the data are shown as means ± standard errors of the means. * indicates a P value of ≤0.05. (F) In vivo imaging of tumors from four representative mice 55 days after inoculation for EGFP expression. The color scale represents the fluorescence signal in radiance and ranges from red (minimum of 1.11 × 10⁸ photons/s/cm2/sr) to yellow (maximum of 1.85 × 10⁹ photons/s/cm2/sr).
FIG 3
FIG 3
Cell death induction, but not cell transformation, is dependent on the NFAT2 N-terminal differential domain. NIH 3T3 cells were infected with either the empty vector or vectors containing cDNAs of the CA-NFAT2 variants. (A) Schematic alignment of the NFAT2 short isoforms and the truncated CA-NFAT2-ΔN protein. CA-NFAT2-ΔN lacks only the amino acid residues that differ between the NFAT2α and NFAT2β isoforms. (B) Western blotting of transduced NIH 3T3 cells. (C) Proliferation kinetic assay by crystal violet staining. O.D., optical density. The data are presented as means ± standard deviations of results from one representative experiment. (D) Cell death analysis by PI staining 72 h after plating at confluence. Standard deviation values indicate the variance of data from four independent experiments, and ** indicates a P value of ≤0.01. (E) Focus-forming assay. See the legend to Fig. 2A for details. (F and G) Growth in semisolid medium. Cells were cultured in semisolid agarose medium, and anchorage-independent cell growth was analyzed described in the legend to Fig. 2C and D. * indicates a P value of ≤0.05.
FIG 4
FIG 4
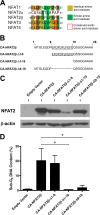
An acidic activation domain is fundamental for cell death induction by CA-NFAT2β. (A) Alignment of the N-terminal regions of the NFAT proteins. Amino acids encoded by the first exon of each NFAT gene were aligned by using the ClustalW tool. Shown is an acidic domain that displays sequence conservation between NFAT2β, NFAT1, NFAT3, and NFAT4 but not NFAT2α. The amino acid positions are indicated. (B) Schematic representation of the truncated variants of CA-NFAT2β. The conserved acidic domain is underlined. (C) Western blotting of transduced NIH 3T3 cells. (D) NIH 3T3 cells were transduced with either the empty vector or vectors containing full-length CA-NFAT2β or truncated CA-NFAT2β constructs. Cell death was analyzed by PI staining 72 h after plating at confluence. Standard deviation values indicate the variance of data from three independent experiments, and * indicates a P value of ≤0.05.
FIG 5
FIG 5
Substitution of the conserved acidic amino acids in the NFAT2β acidic activation domain completely abolishes cell death and enhances the cell transformation phenotype. NIH 3T3 cells were retrovirally transduced with the indicated vectors. (A, top) CA-NFAT2β-Mut-Acid was constructed by substitution of 4 acidic amino acids residues, E9A, D11A, E17A, and D19A. (Bottom) Expression levels of the CA-NFAT2 constructs were analyzed by Western blotting. (B) Cell death was assessed by sub-G0 DNA content analysis as described in the legend to Fig. 3D. *** indicates a P value of ≤0.001. (C and D) Proliferation kinetics assays (C) and focus-forming assays (D) were performed as described in the legend to Fig. 1C and 2A, respectively. (E and F) Growth in semisolid medium was assessed as described in the legend to Fig. 2C and D. ** indicates a P value of ≤0.01. All results are representative of data from at least three independent experiments.
FIG 6
FIG 6
CA-NFAT2β induces death in NIH 3T3 cells by upregulation of TNF-α. NIH 3T3 cells were transduced with the empty vector or vectors containing CA-NFAT2α, CA-NFAT2β, or CA-NFAT2β-Mut-Acid. (A and B) A real-time reverse transcriptase (SYBR green) SuperArray assay was performed to screen 81 apoptosis-related genes. The fold change values are relative to the values for cells transduced with the empty vector. (C) TNF-α ELISA. Transduced cells were plated, and the cell-free supernatant was assessed for TNF-α protein levels by an ELISA at the indicated times. Data are shown as means ± standard deviations of results from three independent experiments. (D) Schematic representation of luciferase reporter vectors. Transcription factor-binding sites are indicated. (E) NIH 3T3 cells were transfected with the luciferase reporter plasmids and pRL-TK (renilla plasmid) and transduced with retroviral vectors. Transduced cells were plated at confluence and lysed after 16 h. Luciferase activity was normalized to the activity of the renilla vector. The fold induction values are relative to the values for cells transduced with the empty vector. Data are shown as the means ± standard deviations of data from three independent experiments. ** indicates a P value of ≤0.01. (F) Neutralization assay. NIH 3T3 cells were infected with the pLIRES-CA-NFAT2β vector and plated with a TNF-α neutralizing antibody. After 72 h, cell death was analyzed by PI staining. Data were normalized and expressed as a percentage relative to the sub-G0 DNA content of nontreated cells. Standard deviation values indicate the variance of data from five independent experiments.
FIG 7
FIG 7
CA-NFAT2β induces cell death and increases FasL and TNF-α levels in CD4+ T lymphocytes. (A) Analysis of mRNA levels of NFAT2 isoforms in primary CD4+ T cells. Cells were stimulated with anti-CD3 and anti-CD28 (both at 1 μg/ml) for the indicated times, and mRNA levels of NFAT2 isoforms were analyzed by a real-time RT-PCR assay using SYBR green master mix. The data were normalized to hypoxanthine-guanine phosphoribosyltransferase levels. The fold change values are relative to the NFAT2α levels at the starting point (0 h). Data are shown as means ± standard deviations of results from three independent experiments. ** indicates a P value of ≤0.01. (B) Western blotting for NFAT2 and GAPDH (glyceraldehyde-3-phosphate dehydrogenase) levels in CD4+ T cells stimulated with anti-CD3 and anti-CD28 for the indicated times. (C) Western blotting of transduced CD4+ T cells. CD4+ T cells were purified from Nfat2+/+ Cd4-cre (wild-type cells) or Nfat2fl/fl Cd4-cre+ (Nfat2−/− cells) mice and transduced with the empty vector or vectors containing CA-NFAT2α or CA-NFAT2β. (D) Cell death analysis by annexin V and 7-AAD staining. Cells were plated in the absence (nonstimulated [NS]) or presence of 10 nM PMA. After 6 h, phosphatidylserine exposure was accompanied by annexin V staining. The data are representative of results from two independent experiments. (E) TNF-α ELISA. Transduced CD4+ T cells were plated, and the cell-free supernatant was assessed for TNF-α protein levels by an ELISA after 6 h. Data are shown as means of results from two independent experiments. (F) FasL staining. Cells were plated in the absence or presence of 10 nM PMA for 6 h and stained with anti-FasL-PE antibody. The data are representative of results from two independent experiments.
FIG 8
FIG 8
NFAT2 isoforms are differentially expressed in human cancer cell lines and Burkitt lymphoma samples. Total RNAs from the cancer cell lines Jurkat (T cell leukemia), 697 (pre-B cell leukemia), and Raji (Burkitt lymphoma); peripheral blood mononuclear cells (PBMC); or Burkitt lymphoma samples were isolated, and mRNA levels of human NFAT2 (hNFAT2) isoforms were analyzed by a real-time RT-PCR assay using SYBR green master mix. The data were normalized to phosphoglycerate kinase 1 and TATA-binding protein levels. (A) Comparison of levels of the NFAT2 isoforms in cultured cell lines. The fold change values are relative to the levels of human NFAT2α in Jurkat cells. Standard deviation values indicate the variance of data from five independent experiments. * indicates a P value of ≤0.05. (B) Analysis of NFAT2 levels after stimulation. Cell lines were treated with PMA (10 nM) plus ionomycin (1 μM) (P + I) for 4 h. The fold change values are relative to levels of human NFAT2α in nonstimulated (NS) cells. Data are shown as means ± standard deviations of results from at least four independent experiments. *** indicates a P value of ≤0.001. (C) Evaluation of NFAT2 mRNA levels in PBMCs (n = 10) or Burkitt lymphoma samples (n = 7). The mRNA levels are relative to the mRNA levels of housekeeping genes (phosphoglycerate kinase 1 and TATA-binding protein genes). ** indicates a P value of ≤0.01 (as determined by a Mann-Whitney U test).

Similar articles

Cited by

References

    1. Shaw JP, Utz PJ, Durand DB, Toole JJ, Emmel EA, Crabtree GR. 1988. Identification of a putative regulator of early T cell activation genes. Science 241:202–205. doi:10.1126/science.3260404. - DOI - PubMed
    1. McCaffrey PG, Perrino BA, Soderling TR, Rao A. 1993. NF-ATp, a T lymphocyte DNA-binding protein that is a target for calcineurin and immunosuppressive drugs. J Biol Chem 268:3747–3752. - PubMed
    1. Northrop JP, Ho SN, Chen L, Thomas DJ, Timmerman LA, Nolan GP, Admon A, Crabtree GR. 1994. NF-AT components define a family of transcription factors targeted in T-cell activation. Nature 369:497–502. doi:10.1038/369497a0. - DOI - PubMed
    1. Hoey T, Sun YL, Williamson K, Xu X. 1995. Isolation of two new members of the NF-AT gene family and functional characterization of the NF-AT proteins. Immunity 2:461–472. doi:10.1016/1074-7613(95)90027-6. - DOI - PubMed
    1. Masuda ES, Naito Y, Tokumitsu H, Campbell D, Saito F, Hannum C, Arai K, Arai N. 1995. NFATx, a novel member of the nuclear factor of activated T cells family that is expressed predominantly in the thymus. Mol Cell Biol 15:2697–2706. doi:10.1128/MCB.15.5.2697. - DOI - PMC - PubMed

Publication types

MeSH terms