. 2015 Nov 3;112(44):13711-6.
doi: 10.1073/pnas.1509820112. Epub 2015 Oct 19.

Synaptic circuits and their variations within different columns in the visual system of Drosophila

Affiliations

Synaptic circuits and their variations within different columns in the visual system of Drosophila

Shin-ya Takemura et al. Proc Natl Acad Sci U S A. .

Abstract

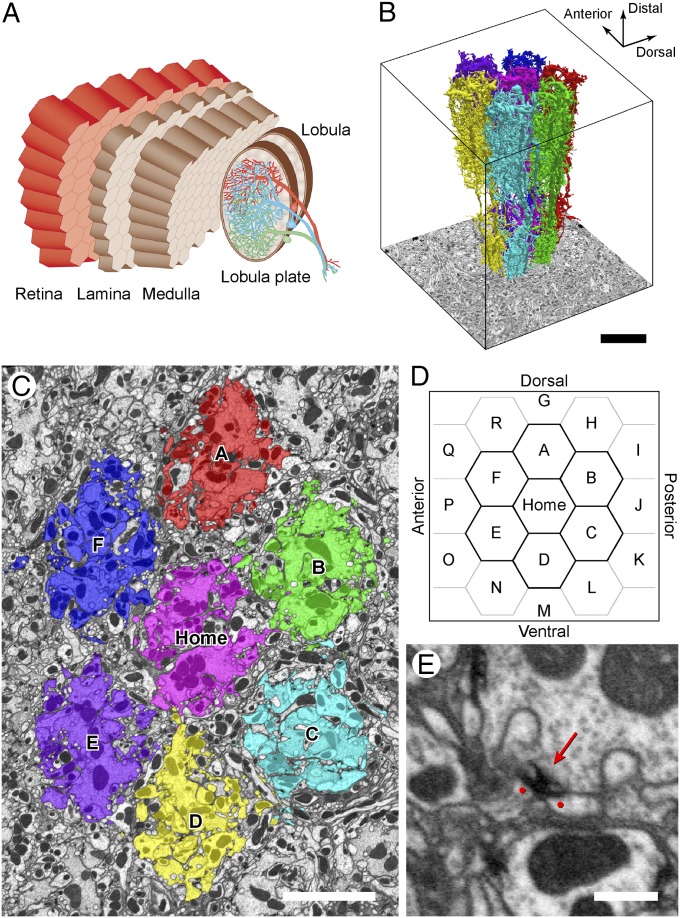
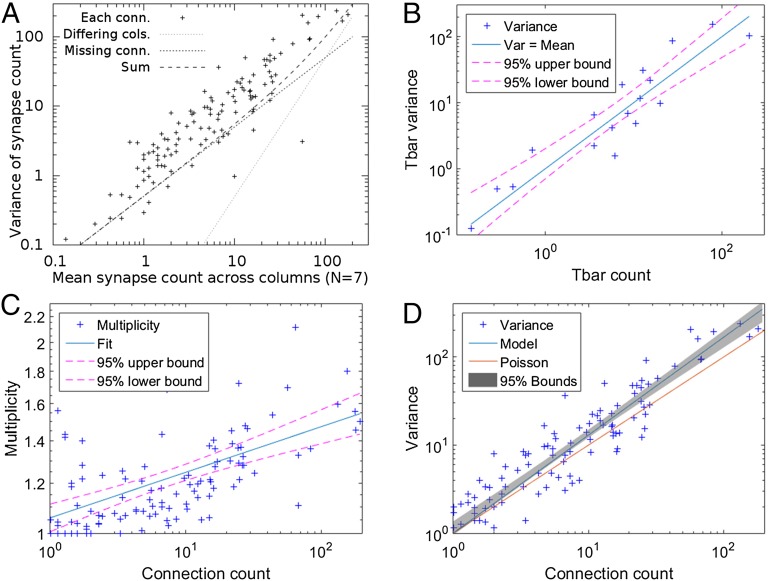
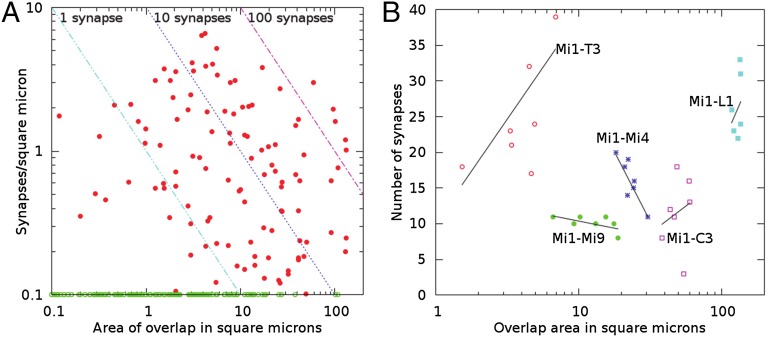
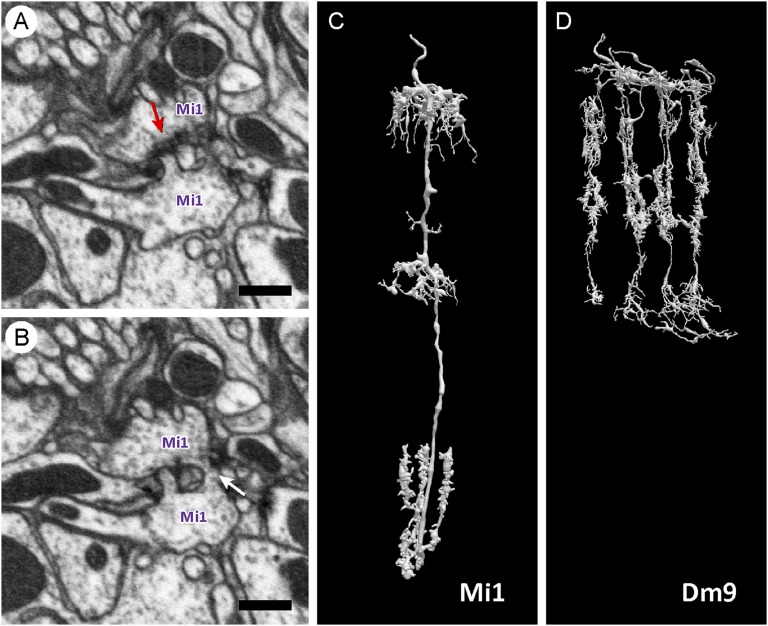
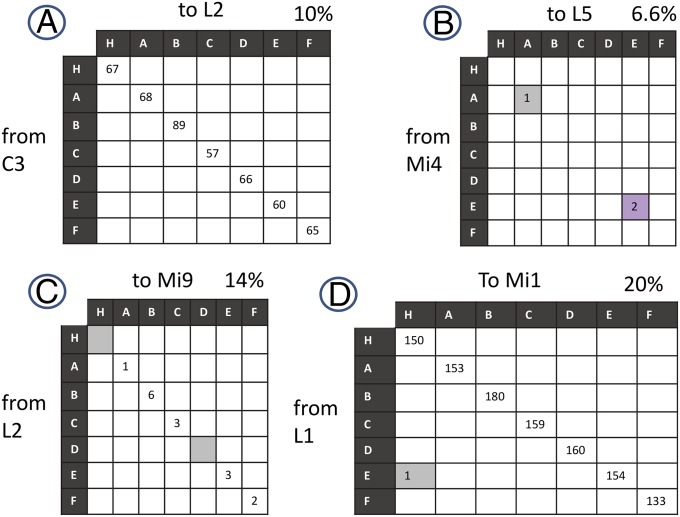
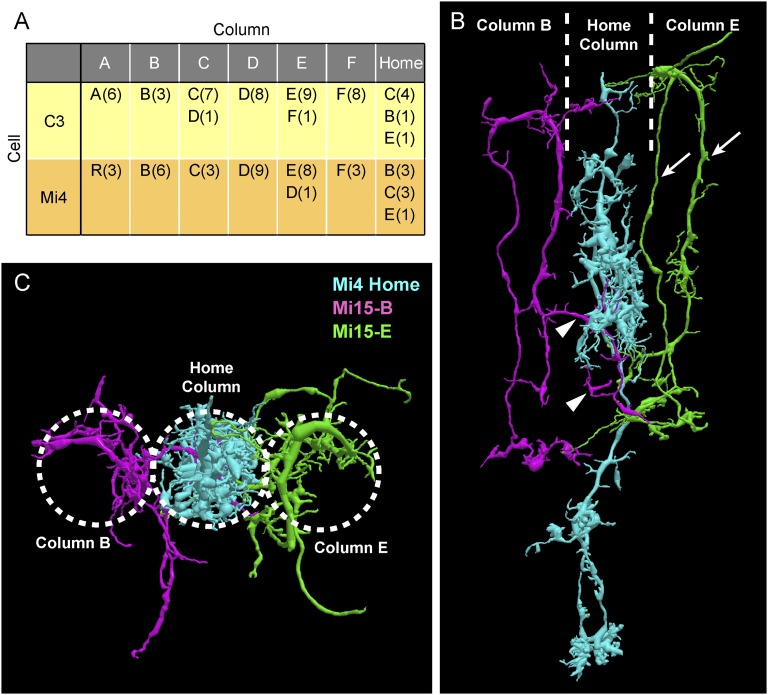
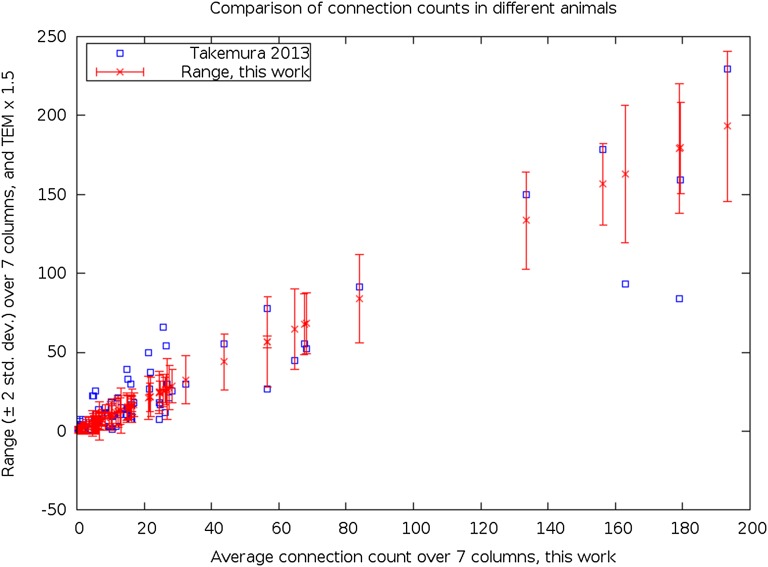
We reconstructed the synaptic circuits of seven columns in the second neuropil or medulla behind the fly's compound eye. These neurons embody some of the most stereotyped circuits in one of the most miniaturized of animal brains. The reconstructions allow us, for the first time to our knowledge, to study variations between circuits in the medulla's neighboring columns. This variation in the number of synapses and the types of their synaptic partners has previously been little addressed because methods that visualize multiple circuits have not resolved detailed connections, and existing connectomic studies, which can see such connections, have not so far examined multiple reconstructions of the same circuit. Here, we address the omission by comparing the circuits common to all seven columns to assess variation in their connection strengths and the resultant rates of several different and distinct types of connection error. Error rates reveal that, overall, <1% of contacts are not part of a consensus circuit, and we classify those contacts that supplement (E+) or are missing from it (E-). Autapses, in which the same cell is both presynaptic and postsynaptic at the same synapse, are occasionally seen; two cells in particular, Dm9 and Mi1, form ≥ 20-fold more autapses than do other neurons. These results delimit the accuracy of developmental events that establish and normally maintain synaptic circuits with such precision, and thereby address the operation of such circuits. They also establish a precedent for error rates that will be required in the new science of connectomics.

Keywords: biological error rates; neural circuits; reconstruction error rates; stereotypy.


Conflict of interest statement

The authors declare no conflict of interest.

Figures

Fig. 1.
Fig. 1.
Seven-column connectome reconstruction. (A) Overview of the optic lobe of Drosophila, showing the repeating retinotopic architecture of successive neuropils. Modified with permission from ref. . (B) Three-dimensional reconstruction of modular medulla cell types in each of seven reconstructed columns. (C) Transverse section in distal medulla stratum M1. Columns (Home and A–F) are colored to conform to B. (D) Plot of a column array. The central Home column is surrounded by its six neighboring columns A–F and 12 more in the outer ring. (E) Focused-ion beam milling (FIB) electron micrograph of neurite profiles with a presynaptic T-bar ribbon (arrow) and two juxtaposed dendrites with PSDs, revealed by membrane densities (dots). (Scale bars: B, 10 μm; C, 5 μm; E, 500 nm.)
Fig. 2.
Fig. 2.
Variation as a function of mean synapse count among connections of the core connectome. (A) Crosses represent the variation in each connection for the seven columns of the core connectome as a function of the mean connection count. Lines represent the two main experimental contributions to this variance, and their sum. “Differing cols.” shows the contribution that would be measured if each column were identical but reported to the estimated completeness. “Missing conn.” shows the variation expected from the incomplete reporting of synaptic contacts, assuming a binomial distribution with P = 0.5. The sum of these experimental artifacts falls well short of the observed variation. (B) Variation in T-bar counts across columns, from medulla stratum M2. A model with variance equal to the mean explains the data to within experimental error. (C) Multiplicity as a function of synapse count. (D) Same data as in A, plus a gray band showing the 95% confidence limits from fitting a straight line to these data. The best fit, not shown, is centered in the gray band. The proposed model from the text, combining the T-bar variance, the multiplicity, and the estimated experimental error, accounts reasonably well for the overall variance. A purely Poisson model, also shown, underpredicts this variance.
Fig. 3.
Fig. 3.
Contact area per synapse within the core connectome. (A) All connections. Cells with overlap but no connections (green) are shown along the bottom axis to appear on a log-scale plot. The diagonal lines represent combinations of area and density that result in the same synapse count between two cells. (B) Contact area and synapse count for the five most numerous outputs of Mi1. Solid lines are least-square fits to the seven examples of each connection.
Fig. S1.
Fig. S1.
Autapses (self-synapses). (A and B) Mi1 neuron makes a synaptic contact to itself (red arrow). A few sections later, the presynaptic and postsynaptic profiles connect (white arrow in B). (C) Reconstructed Mi1 neuron in the Home column. (D) Dm9 neuron extends between columns. (Scale bars: 500 nm.)
Fig. 4.
Fig. 4.
Characterizing connection errors. Plots for each synapse class between presynaptic (vertical columns) and postsynaptic (horizontal rows) partners. Each entry intercept is the number of synaptic contacts from the presynaptic cell (Left) to its postsynaptic partner (Top) for each of the seven columns [Home (H) and A–F]. (A) Completely consistent connection, with seven-column variation in connection strength. (B) Class E + U errors. (C) Class E− errors. (D) Class E + N errors. ICs are shaded throughout. The percentage (of all 400 pre/post pairs) with this pattern is shown at the top right of each matrix. Not shown are examples lacking connections (60%) and connections that did not fall into the patterns shown here (3.5%). The sum exceeds 100% because a single cell pair can have both missing and extra connections.
Fig. S2.
Fig. S2.
Missing Mi15 cell in the Home column. (A) Synaptic connections between Mi15 and C3/Mi4. Mi15 is normally presynaptic to both C3 and Mi4 in its own column. However, because the Home column lacks Mi15, the Home C3 and Home Mi4 are instead postsynaptic to Mi15s in the neighboring columns (the number of their contacts is shown in parentheses). (B) Cell in column E (green) is a typical Mi15 with two main branches (arrows). The Mi15 in column B (magenta) extends a branch in the Home column (arrowheads), where the normal Mi15 is missing. This branch connects to Mi4, which is normally postsynaptic to the Mi15 in its own column. (C) Plan view of B. Dotted circles indicate approximate boundaries of columns.
Fig. S3.
Fig. S3.
Comparison of the connection counts in two individual flies.

References

    1. Chklovskii DB, Schikorski T, Stevens CF. Wiring optimization in cortical circuits. Neuron. 2002;34(3):341–347. - PubMed
    1. Cherniak C. Neural wiring optimization. Prog Brain Res. 2012;195:361–371. - PubMed
    1. Robertson RM. Neuronal circuits controlling flight in the locust: Central generation of the rhythm. Trends Neurosci. 1986;9(6):278–280.
    1. Grillner S, Wallén P. Cellular bases of a vertebrate locomotor system-steering, intersegmental and segmental co-ordination and sensory control. Brain Res Brain Res Rev. 2002;40(1-3):92–106. - PubMed
    1. Kristan WB, Jr, Calabrese RL, Friesen WO. Neuronal control of leech behavior. Prog Neurobiol. 2005;76(5):279–327. - PubMed

Publication types

LinkOut - more resources