. 2015 Nov 10;112(45):13970-5.
doi: 10.1073/pnas.1515937112. Epub 2015 Oct 19.

Molecular signatures of plastic phenotypes in two eusocial insect species with simple societies

Affiliations

Molecular signatures of plastic phenotypes in two eusocial insect species with simple societies

Solenn Patalano et al. Proc Natl Acad Sci U S A. .

Abstract

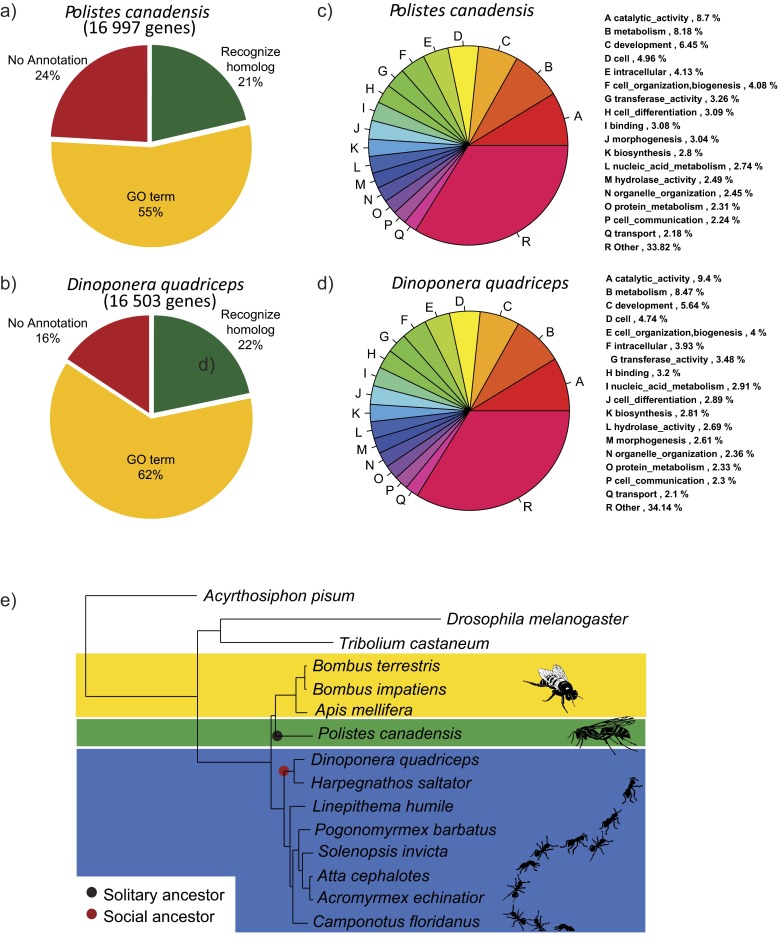
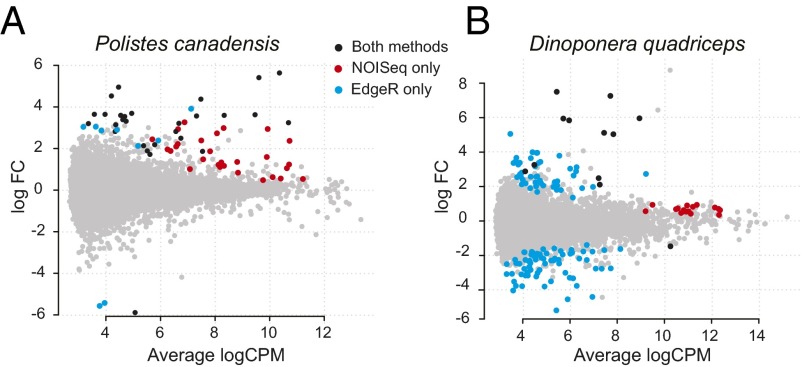
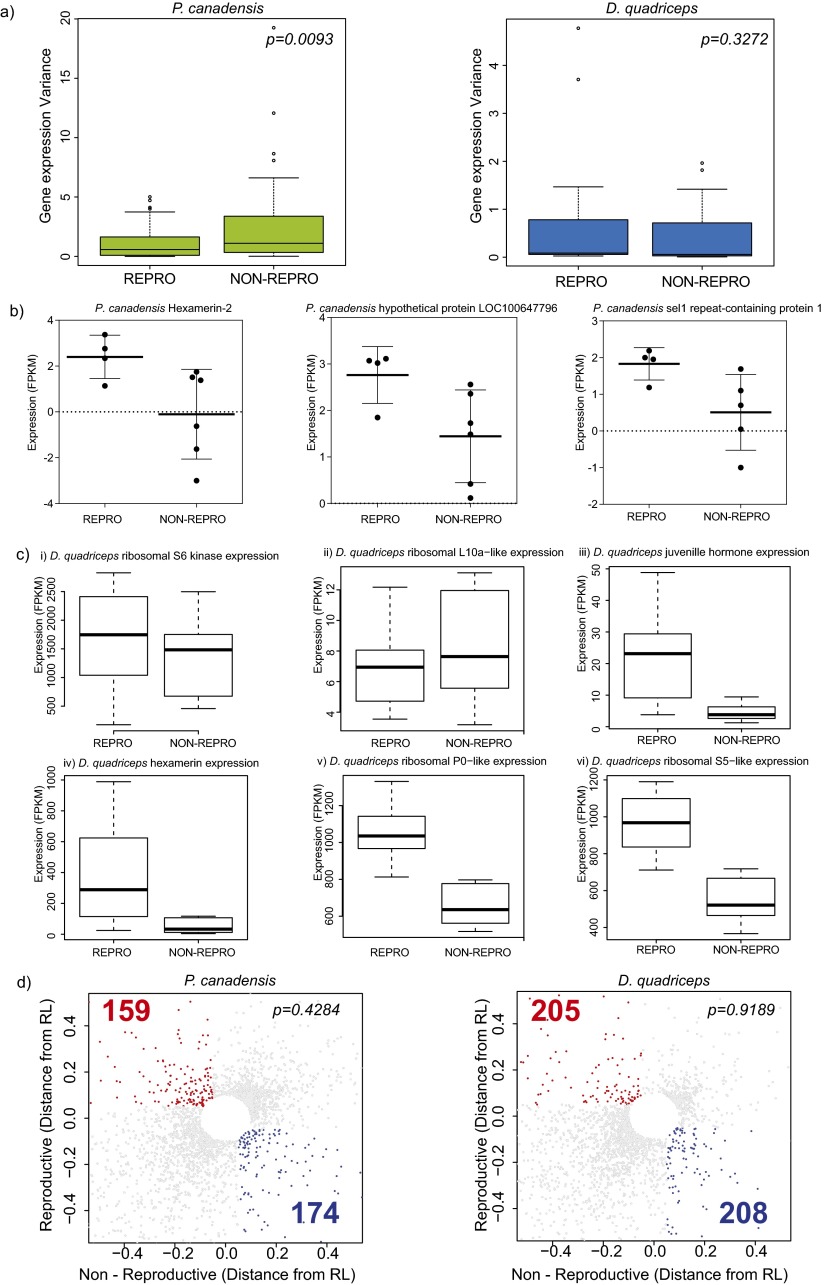
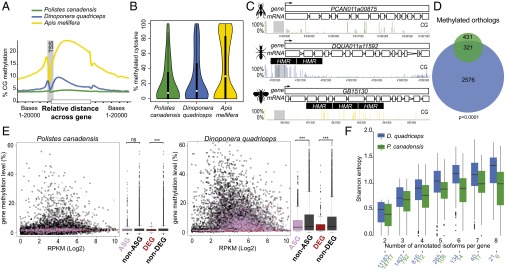
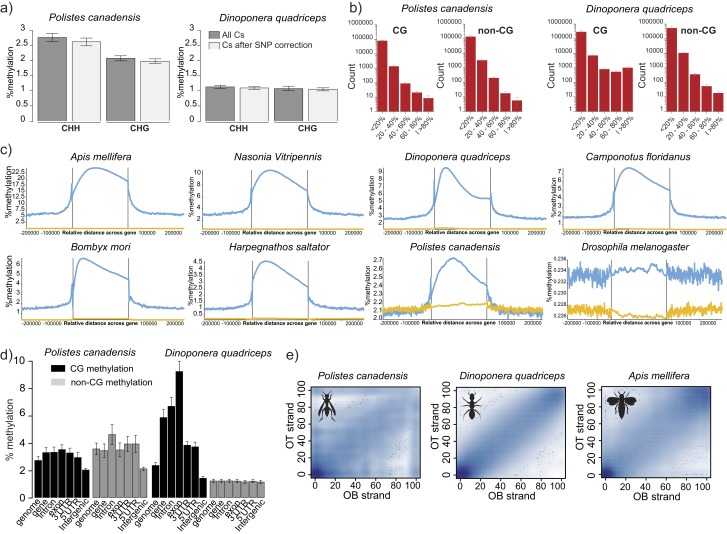
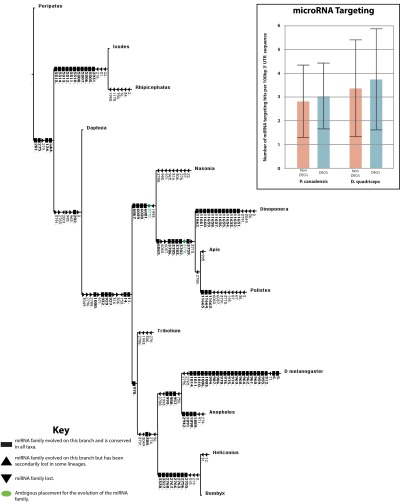
Phenotypic plasticity is important in adaptation and shapes the evolution of organisms. However, we understand little about what aspects of the genome are important in facilitating plasticity. Eusocial insect societies produce plastic phenotypes from the same genome, as reproductives (queens) and nonreproductives (workers). The greatest plasticity is found in the simple eusocial insect societies in which individuals retain the ability to switch between reproductive and nonreproductive phenotypes as adults. We lack comprehensive data on the molecular basis of plastic phenotypes. Here, we sequenced genomes, microRNAs (miRNAs), and multiple transcriptomes and methylomes from individual brains in a wasp (Polistes canadensis) and an ant (Dinoponera quadriceps) that live in simple eusocial societies. In both species, we found few differences between phenotypes at the transcriptional level, with little functional specialization, and no evidence that phenotype-specific gene expression is driven by DNA methylation or miRNAs. Instead, phenotypic differentiation was defined more subtly by nonrandom transcriptional network organization, with roles in these networks for both conserved and taxon-restricted genes. The general lack of highly methylated regions or methylome patterning in both species may be an important mechanism for achieving plasticity among phenotypes during adulthood. These findings define previously unidentified hypotheses on the genomic processes that facilitate plasticity and suggest that the molecular hallmarks of social behavior are likely to differ with the level of social complexity.

Keywords: DNA methylation; genome sequencing; phenotypic plasticity; social evolution; transcriptomes.


Conflict of interest statement

Conflict of interest statement: S.B. is a founder and shareholder of Cambridge Epigenetix Limited, and W.R. is a consultant and shareholder of Cambridge Epigenetix Limited.

Figures

Fig. 1.
Fig. 1.
Genome sequencing and organization. P. canadensis (A) and D. quadriceps (B) share similar ecological, social, and behavioral traits (Dataset S1). (C) P. canadensis shares more similarity in predicted proteins with bees (Apidae) than ants (Formicidae), as expected, given the lack of other published aculeate wasp genome sequences; D. quadriceps shares greatest similarity of predicted protein sequences with sequenced ant genomes (Formicidae). These data are derived from computational protein analyses (SI Text, section SII.7). (D) Distribution of different classes of repetitive elements and transposons across P. canadensis and D. quadriceps genomes.
Fig. S1.
Fig. S1.
Functional annotation of P. canadensis and D. quadriceps genomes and reconstruction of the hymenopteran phylogeny. (AD) Functional annotation of P. canadensis and D. quadriceps genomes. (E) Reconstruction of the hymenopteran phylogeny across species for which genome sequences are publically available, using 600 shared proteins and including P. canadensis and D. quadriceps, places ants (Formicidae) basal to aculeate wasps and bees. The ancestor of the P. canadensis lineage is likely to have been a solitary species (black dot) (80), whereas the ancestor of D. quadriceps was a species that had developmental caste determination (red dot) (81).
Fig. 2.
Fig. 2.
Low levels of transcriptional differentiation between phenotypes. (A and B) Counts per million plots of log fold mean gene expression differences between phenotypes, showing the numbers and log fold differences of DEGs up-regulated in reproductives (positive) and nonreproductives (negative). The union and individual results of two methods for detecting DEGs (NOISeq and EdgeR) are presented. FC, fold change.
Fig. S2.
Fig. S2.
Differences between NOISeq and EdgeR in identification of DEGs and analysis of variance. (A) Box plots of the distribution of the variance from DEGs detected by NOISeq according to reproductive phenotype in each species. P values shown are for t tests. (B) Examples of highly variable gene expression in the nonreproductive phenotype of P. canadensis. Each individual is represented by a dot. (C) Box-whisker plots show examples of different patterns of gene calling using NOISeq or EdgeR in D. quadriceps. (i and ii) Ribosomal proteins are not found differentially expressed with either EdgeR or NOISeq. (iii and iv) Genes found only by EdgeR. (v and vi) Genes found only by NOISeq (ribosomal proteins). (D) Nonlinear RL was obtained based on an exponential decay model curve. For each gene, distances from the coefficient of variation (CV) and regression line (RL) were plotted and values below 0.05 of √ (reproductive^2 square + nonreproductive^2) were excluded to show only highly variable transcripts between reproductive phenotypes. Statistical tests (χ2) were performed comparing highly variable and nonvariable transcripts between each reproductive phenotype for each species. NON-REPRO, nonreproductive; REPRO, reproductive.
Fig. 3.
Fig. 3.
Absence of distinct DNA methylation patterning. (A) Average CG methylation level in brain tissue along gene bodies and 20 kb of adjacent sequence for P. canadensis (green), D. quadriceps (blue), and A. mellifera (yellow). (B) Proportion of methylated cytosines within highly methylated regions (HMRs). Hartigan’s dip test for unimodality: D = 0.0184 in P. canadensis, D = 0.0257 in D. quadriceps, and D = 0.0849 in A. mellifera (P < 0.0001 in all three species). (C) Screen shot from SeqMonk software showing the distribution of CG methylation in an orthologous gene in each of the three species. (D) Venn diagram of methylated orthologs: 74.5% (321 of 431) of the methylated genes in P. canadensis (green) overlap with D. quadriceps (blue). (E) Methylation distribution and summary box plots of the DEGs, ASGs, and non-ASGs, tested with Welch two-sample t tests. ns, not significant; RPKM, reads per kilobase per million. ***P < 0.0001. (F) Splicing entropy of annotated transcript isoforms. Shannon entropy grows with the number of annotated isoforms and with their equifrequency (entropy is 0 when only one isoform is expressed and high when all isoforms are expressed equally, Welch two-sample t test).
Fig. S3.
Fig. S3.
Context and distribution of DNA methylation. (A) Non-CG methylation validation. Both CHH and CHG contexts were analyzed. The levels of the non-CG methylation wrongly assigned due to genomic CpG SNPs represent 0.15% (±0.03) and 0.03% (±0.01) of the CHH context and 0.09% (±0.02) and 0.03% (±0.01) of the CHG context in P. canadensis and D. quadriceps, respectively. (B) Base-pair methylation distribution (coverage ≥ 5) follows the HMR pattern from Fig. 3B and confirms the absence of highly methylated cytosines in P. canadensis and D. quadriceps. (C) Average methylation distribution along gene bodies and their 200-kb adjacent sequences in different species of insects (blue, CG methylation; yellow, non-CG methylation; references are provided in Dataset S4). (D) Methylation levels across different genomic features and cytosine contexts were determined across six individuals for each species. (E) Smoothed scatter plots of methylation of the top and bottom DNA strands. Adjusted R2 values are as follows: 0.08745 for P. canadensis, 0.9037 for D. quadriceps, and 0.7816 for A. mellifera. Only Cyts covered by ≥20 reads are shown. OB, original bottom strands; OT, original top strands.
Fig. S4.
Fig. S4.
Synteny of the DNMT3 locus across eusocial insects and genetic comparison of DNMT1 and ten-eleven-translocation (TET) gene sequences. (A) Synteny analyses in the DNMT3 locus across eusocial insects [bee (A. mellifera) and ants (Atta cephalotes, Camponotus floridanus, Acromyrmex echinatior, Harpegnathos saltator, and Linepithema humile)]. Different colors of the bars in the plot represent noninterrupted genomic fragments, which are homologous between the compared species. (B) Schematic representation of domain conservation between Homo sapiens and P. canadensis of the DNMT1 enzyme. (C) Percentage of CXXC homology between P. canadensis and D. quadriceps TET, DNMT1, and an insect-specific CXXC-containing domain. (D) CXXC sequence alignment of DNMT1. Gray arrows highlight the exchange found only in P. canadensis. (E) Three major amino acid changes (R to K, “other” to F and “other” to I) were mapped in the mouse CXXC domain bound to unmethylated DNA. (F) Schematic representation of TET genes in P. canadensis (PCAN011a000021) and D. quadriceps (DQUA011a009260). The CXXC domain and 20GFeDO [Fe(II)-dependent oxygenase] domain sequences are aligned between the two insect species and with the Mus m. domesticus TET sequence.
Fig. S5.
Fig. S5.
Phylogeny, expression, and activity detection of the DNA methylation and demethylation machinery. (A) Phylogenomic tree of the key proteins involved in DNA methylation and demethylation across insects. (B) Brain gene expression levels of the DNA methylation and demethylation machinery based on RNA-seq datasets. (C) Ratio of 5mC/5-hydroxymethyl-cytosine (5hmC) in genomic DNA as measured by MS. Sample sizes are seven, five, and four individuals in P. canadensis, D. quadriceps, and M. m. domesticus, respectively.
Fig. S6.
Fig. S6.
CG islands description and association between methylation and expression and CG density. (A) CG density and distribution around the transcription start site (TSS). Data were analyzed using repeated measures one-way ANOVA, followed by Tukey post hoc tests. The difference between the TSS and ±2 kb are all significant for all four species (P < 0.0001). However, the baseline levels (±) and increase to the TSS vary widely between species. The increase expressed as a percentage for each species is shown in each graph. (B) Scatter plots of averages of gene body methylation vs. their transcriptional activity in log2 RPKM. Each data point is an individual gene. (C) Scatter plots showing percentage of CG within genes vs. their methylation level. Each point is an individual gene.
Fig. S7.
Fig. S7.
The evolutionary history of arthropod microRNA families, based on ref. and data in this study. Both gains and losses of miRNA families are variable between taxa, and although a higher rate of loss is observed within Hymenoptera than Diptera, this probably reflects the greater depth of genome and small RNA sequencing within Dipterans. (Box) MicroRNA targeting of both the differentially expressed genes (DEGs) and non-DEGs using the program TargetSpy. Candidate miRNA products (both 5′ and 3′) and 3′ UTR sequences for all non-DEGs (n = 2,223 for P. canadensis, and 3,121 for D. quadriceps) and DEGs (n = 33 for P. canadensis, and 35 for D. quadriceps) were used to identify the target sites. As 3′ UTR length was variable (D. quadriceps: non-DEGs = 319 nt, DEGs = 372 nt; P. canadensis: non-DEGs = 313 nt, DEGs = 429 nt), and the longer the 3′ UTR, the greater the likelihood of target sites being identified, the data were normalized per 100 nucleotides. These data showed no difference in the number of miRNA target sites between either the non-DEGs (2.8 hits per 100 nucleotides, SD = 1.5) or the DEGs (3.0 hits per 100 nucleotides, SD = 1.4) in P. canadensis or the non-DEGs (3.4 hits per 100 nucleotides, SD = 2.1) and the DEGs (3.8 hits per 100 nucleotides, SD = 2.1) in D. quadriceps.
Fig. 4.
Fig. 4.
Coordinated transcriptional network organization. (A) DEGs are nonrandomly distributed across modules (groups of genes with similar levels of expression): 14 of 41 DEGs in P. canadensis modules [binomial generalized linear model (glm) × 2[13] = 162; P < 0.0001] and 25 of 31 DEGs in D. quadriceps modules (binomial glm × 2[24] = 288; P < 0.00001). Colors correspond to the different modules. An asterisk indicates the modules that correlate significantly with phenotype. (BF) Network graphs show the connectivity of annotated genes and TRGs in the modules that correlate significantly with phenotype. There were two modules in P. canadensis [yellow module, P = 2.4 × 10⁻²³ (C); red module, P = 14.1 × 10⁻²² (E)] and three in D. quadriceps [light yellow module, P = 9 × 10⁻¹⁹ (B); magenta module, P = 2.7 × 10−42 (D); dark turquoise module, P = 8.6 × 10⁻⁴ (F)]. DEG fold enrichment in module: yellow (9-fold), red (3.6-fold), light yellow (21.5-fold), magenta (5.4-fold), and dark turquoise (7.7-fold). Nodes represent individual genes (with their XLOC gene name given). Edges indicate high coexpression between genes; edges with a correlation below specific thresholds are removed to aid visualization (41) [Thresholds: 0.27–1 (B), 0.31–1 (C), 0.15–1 (D), 0.24–1 (E), 0.12–1 (F)]. Connectivity (number of edges per node above the threshold) is indicated by node size. Annotated DEGs that are hubs [hubs defined as highly connected genes with more than five connections (c > 5)] are shown in red, and taxon-restricted DEGs that are hubs (c > 5) are shown in blue. Toolkit genes and TRG names are highlighted. Three genes that are DEGs in both species were found to be hubs in some networks: myrosinase (c = 16) in P. canadensis and vitellogenin (c = 14) and fibrillin (c = 8) in D. quadriceps.
Fig. S8.
Fig. S8.
Comparison of characteristics of taxon-restricted (TRGs) and known (annotated) genes, with respect to their length, expression levels, and distribution among coexpression networks. (A) TRGs (orphans) are similarly expressed compared with annotated genes but tend to be shorter in length in both P. canadensis and D. quadriceps. FPKM values of DEGs (Top) and gene lengths of DEGs (Bottom) are shown [P. canadensis (n = 5) and D. quadriceps (n = 16)]. (B) Length of putative proteins of TRGs compared with all and annotated putative proteins in the genome. AA, amino acid. (C, Left) Distribution of known (shaded) and putative taxon-restricted (hatched) genes in reproductives (red) and nonreproductives (blue) of D. quadriceps and P. canadensis. The number of genes is shown within each area, and the proportion of phenotype-biased genes that each represents within that species is denoted in parentheses. (C, Right) Distribution of TRGs within the modules of weighted coexpression networks. The numbers of DEGs for each phenotype (reproductives in red, nonreproductives in blue) and whether they are taxon-restricted (hatched) or known (shaded) are shown.

Comment in

References

    1. West-Eberhard MJ. Developmental Plasticity and Evolution. Oxford Univ Press; New York: 2003.
    1. Pfennig DW, et al. Phenotypic plasticity’s impacts on diversification and speciation. Trends Ecol Evol. 2010;25(8):459–467. - PubMed
    1. Pigliucci M, Murren CJ, Schlichting CD. Phenotypic plasticity and evolution by genetic assimilation. J Exp Biol. 2006;209(Pt 12):2362–2367. - PubMed
    1. Schlichting CD, Wund MA. Phenotypic plasticity and epigenetic marking: An assessment of evidence for genetic accommodation. Evolution. 2014;68(3):656–672. - PubMed
    1. Ferreira PG, et al. Transcriptome analyses of primitively eusocial wasps reveal novel insights into the evolution of sociality and the origin of alternative phenotypes. Genome Biol. 2013;14(2):R20. - PMC - PubMed

Publication types