. 2015 Nov 3;112(44):13543-8.
doi: 10.1073/pnas.1518255112. Epub 2015 Oct 19.

Structure of an RNA polymerase II preinitiation complex

Affiliations

Structure of an RNA polymerase II preinitiation complex

Kenji Murakami et al. Proc Natl Acad Sci U S A. .

Abstract

The structure of a 33-protein, 1.5-MDa RNA polymerase II preinitiation complex (PIC) was determined by cryo-EM and image processing at a resolution of 6-11 Å. Atomic structures of over 50% of the mass were fitted into the electron density map in a manner consistent with protein-protein cross-links previously identified by mass spectrometry. The resulting model of the PIC confirmed the main conclusions from previous cryo-EM at lower resolution, including the association of promoter DNA only with general transcription factors and not with the polymerase. Electron density due to DNA was identifiable by the grooves of the double helix and exhibited sharp bends at points downstream of the TATA box, with an important consequence: The DNA at the downstream end coincides with the DNA in a transcribing polymerase. The structure of the PIC is therefore conducive to promoter melting, start-site scanning, and the initiation of transcription.

Keywords: cryo-EM; general transcription factors; transcription; yeast.


Conflict of interest statement

The authors declare no conflict of interest.

Figures

Fig. 1.
Fig. 1.
Cryo-EM structure of the PIC. Side view (Left) and front view (Right) of the cryo-EM electron density map (gray, space-filling) are shown. A crystallographic model of a pol II (all light blue, except Rpb4/7 subunits pink)–TBP (green)–TFIIBC (red)–TATA box complex and crystal structures of TFIIA (cyan) and TFIIS (green) were fitted to the map. Atomic models of the Tfg1–Tfg2 dimerization domain (Tfg1 blue; Tfg2 magenta), the WH domain of Tfg2 (navy blue), WH domains of Tfa2 (magenta), the WH domain of Tfa1 (purple), the zinc ribbon domain of Tfa1 (navy blue), Rad3 (green), Ssl2 (N-Ssl2 orange red; C-Ssl2 dark purple), and Tfb2-Tfb5 (dark red) were placed on the basis of protein–protein cross-linking. Volumes assigned on the basis of fitting the atomic models and results of cross-linking are colored according to the code at the lower left.
Fig. S1.
Fig. S1.
Cryo-EM analysis of the PIC. (A) A micrograph showing PIC particles preserved in amorphous ice. (B) Class averages obtained after clustering images of PIC particles. (C) Initial cryo-EM map of the PIC calculated ab initio from the class averages shown in B. (D) Docking of an X-ray model of a pol II–TFIIA–TFIIB–TBP–TATA DNA complex (PDB ID code 4V1N) into the initial PIC map in C. (E) Fourier shell correlation (FSC) plots used to estimate the resolution of the form 1 PIC and P-lobe cryo-EM maps. (Inset) A front view of the P-lobe colored by local resolution values.
Fig. S2.
Fig. S2.
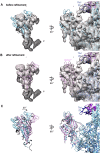
Two forms of the PIC. (A) TFIIH and pol II in forms 1 (purple) and 2 (pink) were aligned as indicated. To aid in comparisons, crystallographic models of Rad3 (green), Ssl2 (N-Ssl2 orange red; C-Ssl2 dark purple), and Tfb2-Tfb5 (dark red) are shown. (B) Rotated by 180° relative to A.
Fig. S3.
Fig. S3.
Rotation of pol II subunits Rpb4 and Rpb7 in the PIC. (A) Crystallographic model of pol II is light blue. Cryo-EM electron density map of the PIC is in space-filling gray. (B and C) Crystallographic model of Rob4 and Rpb7 following refinement to the cryo-EM map is pink.
Fig. S4.
Fig. S4.
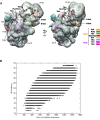
(A) Two views of the locations of subunits of TFIIE and TFIIH based on results from combinatorial analysis. Spheres mark the peaks in the map assigned to subunits, colored according to the code at the right. (B) Fit of all models assessed in the combinatorial analysis to results from cross-linking and mass spectrometry. Each point in the scatter plot represents a different model. Two measures of fit are plotted for each model: the number of cross-linked spheres that are more than 65 Å apart (y axis) and the sum of distances in excess of 40 Å between cross-linked spheres (x axis). The best-fitting model (red point) is shown in A.
Fig. S5.
Fig. S5.
Comparison of the best model from combinatorial analysis between this work and ref. , seen in side (A) and top (B) views. Spheres mark the locations determined previously, overlaid on the ribbon model from this work. Arrows represent shifts to corresponding positions in form 1 of this work. The coordinates of Rad3, Tfg2 WH, TFIIE dimerization domain, and DNA defined the relationship between the previous and current models. Models and color code are as in Fig. S4.
Fig. 2.
Fig. 2.
Placement of crystal structures for TFIIH subunits. (A and B) Density has been removed (cut surfaces dark blue) to expose N- and C-terminal regions of Ssl2 (N-Ssl2 orange red; C-Ssl2 dark purple). Also shown are Tfb2–Tfb5 (dark red) and the WH domains of Tfa1 (pink) and Tfg2 (navy blue). (C and D) Rad3 (green). Volumes are colored as in Fig. 1. Residues of Rad3 in cyan form cross-links with core subunits of TFIIH, and residues in blue form cross-links with Tfa2 in PIC lacking TFIIK. If the cross-linked residue is absent from the model, the closest residue in the model is shown. Cross-link between K60 of Tfb2 and K725 of Ssl2 is indicated by a dashed red line. Positions in the DNA are numbered with respect to the first transcription start site of the HIS4 promoter, with distances (base pairs) from the upstream edge of the TATA box in parentheses.
Fig. 3.
Fig. 3.
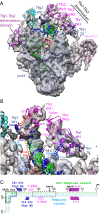
Path of promoter DNA in the PIC. (A) Views of DNA path, with green cylinders representing straight B-form DNA segments superimposed. Proteins contacting the DNA are shown: TFIIA (cyan), TBP(green), TFIIBc(red), Ssl2 (N-Ssl2 orange red; C-Ssl2 dark purple), WH domains of Tfa2 (magenta), Tfg2 (navy blue), and Tfa1 (purple), and the zinc ribbon domain of Tfa1 (navy blue). Positions in the DNA are numbered as in Fig. 2. (B) Pol II in the crystal structure of a transcribing complex (40) is aligned with pol II in the PIC, the DNA of the transcribing complex (magenta) is extended at the downstream end with straight B-form DNA, and the DNA of the PIC with all associated proteins is shown as in Fig. 1.
Fig. 4.
Fig. 4.
Refined structure of the P-lobe, with DNA and associated GTFs. Models and color code as in Fig. 1. (A) Front view. (B) Zoomed view of upstream end showing GTF–DNA interactions. Red and blue dashed lines indicate protein–protein interactions obtained with cross-linking and mass spectrometry (1) and Fe-BABE (39), respectively. (C) Schematic diagram of protein–DNA interactions suggested by the model. Positions in the DNA are numbered as in Fig. 2. Transcription bubble formed upon initial promoter melting is indicated by a dashed box. TSS at +1 is indicated by black arrow.
Fig. 5.
Fig. 5.
Schematic of transition from closed to open promoter complex. Cutaway views based on Fig. 3B. TFIIE, TFIIF, and the core subunits of TFIIH are omitted for clarity. DNA in blue and green is rotated and translocated by Ssl2 in an ATP-dependent manner, in the directions indicated by the large red arrows.
Fig. S6.
Fig. S6.
Variability in Ssl2 position in the PIC. (A) P-lobe submaps obtained by Ssl2-focused classification of aligned P-lobe images (the spherical mask used for classification is shown in the top left volume). Density due to Ssl2 varies in both amount and location. (B) Comparison between P-lobe submaps in A shows changes in the location of Ssl2 and apparent correlation with changes in the downstream DNA. Submap 1 is in blue mesh. Submaps 3 and 5 are semitransparent olive and light green, respectively. (C) Three-dimensional variability analysis of the P-lobe (variability in solid red, first P-lobe submap in semitransparent blue) confirms variability in Ssl2 and DNA.

References

    1. Murakami K, et al. Architecture of an RNA polymerase II transcription pre-initiation complex. Science. 2013;342(6159):1238724. - PMC - PubMed
    1. Murakami K, et al. Formation and fate of a complete 31-protein RNA polymerase II transcription preinitiation complex. J Biol Chem. 2013;288(9):6325–6332. - PMC - PubMed
    1. Ge H, Roeder RG. Purification, cloning, and characterization of a human coactivator, PC4, that mediates transcriptional activation of class II genes. Cell. 1994;78(3):513–523. - PubMed
    1. Henry NL, Bushnell DA, Kornberg RD. A yeast transcriptional stimulatory protein similar to human PC4. J Biol Chem. 1996;271(36):21842–21847. - PubMed
    1. Brandsen J, et al. C-terminal domain of transcription cofactor PC4 reveals dimeric ssDNA binding site. Nat Struct Biol. 1997;4(11):900–903. - PubMed

Publication types

MeSH terms