. 2015 Oct 26;211(2):391-405.
doi: 10.1083/jcb.201503081. Epub 2015 Oct 19.

NF2/Merlin mediates contact-dependent inhibition of EGFR mobility and internalization via cortical actomyosin

Affiliations

NF2/Merlin mediates contact-dependent inhibition of EGFR mobility and internalization via cortical actomyosin

Christine Chiasson-MacKenzie et al. J Cell Biol. .

Abstract

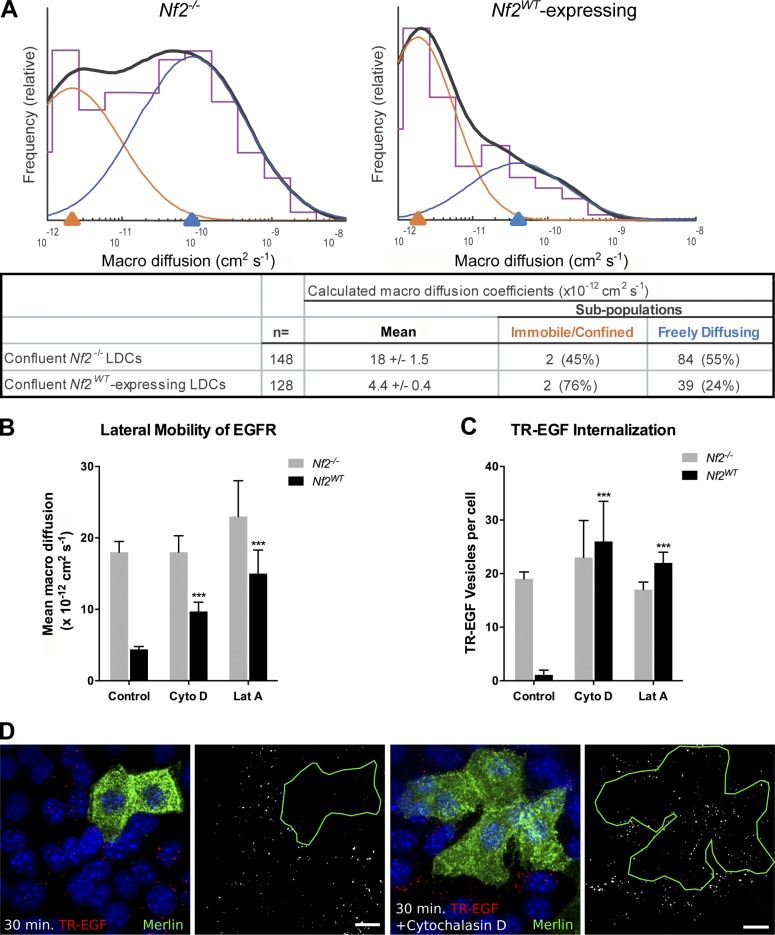
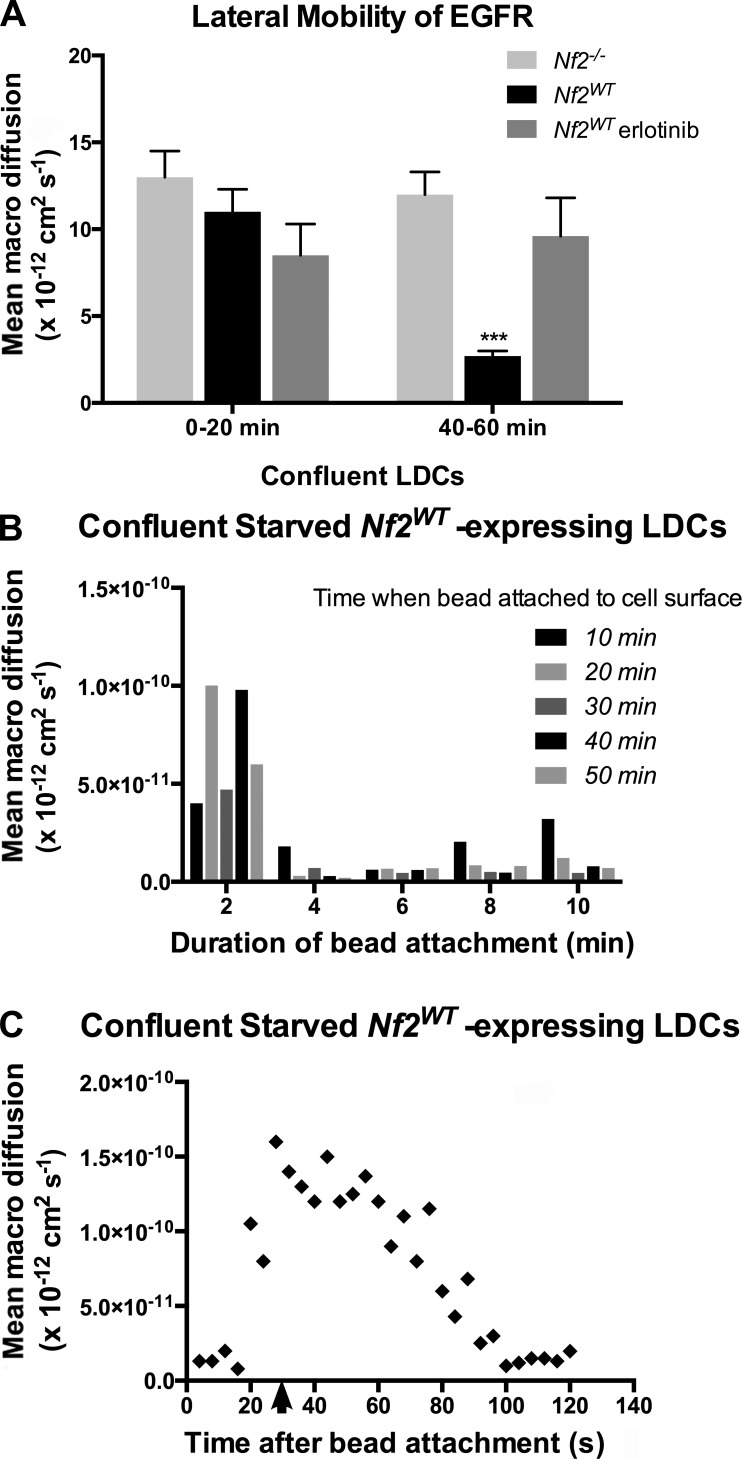
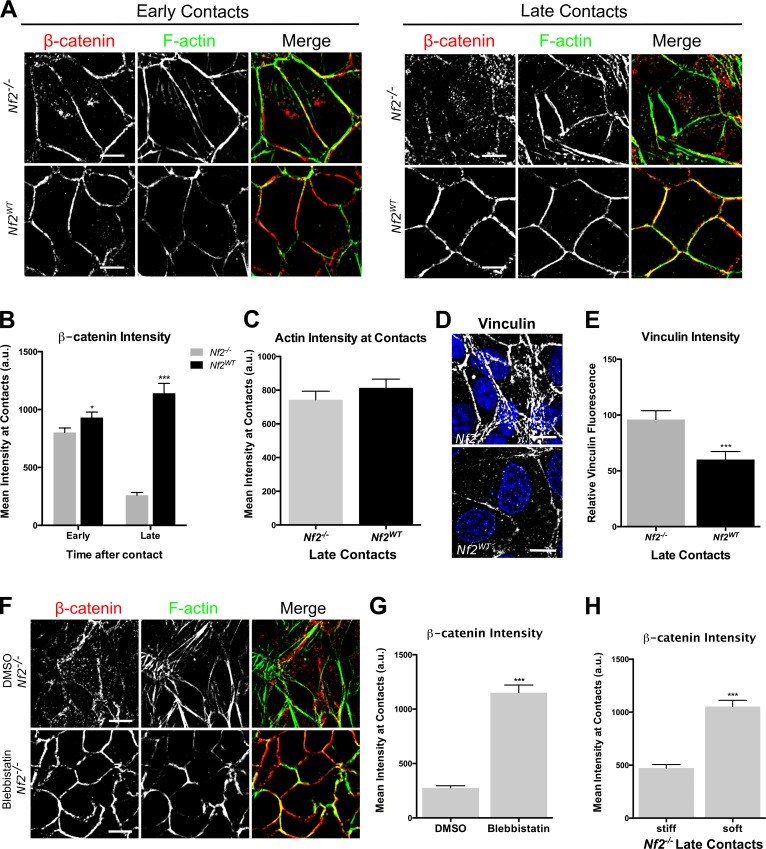
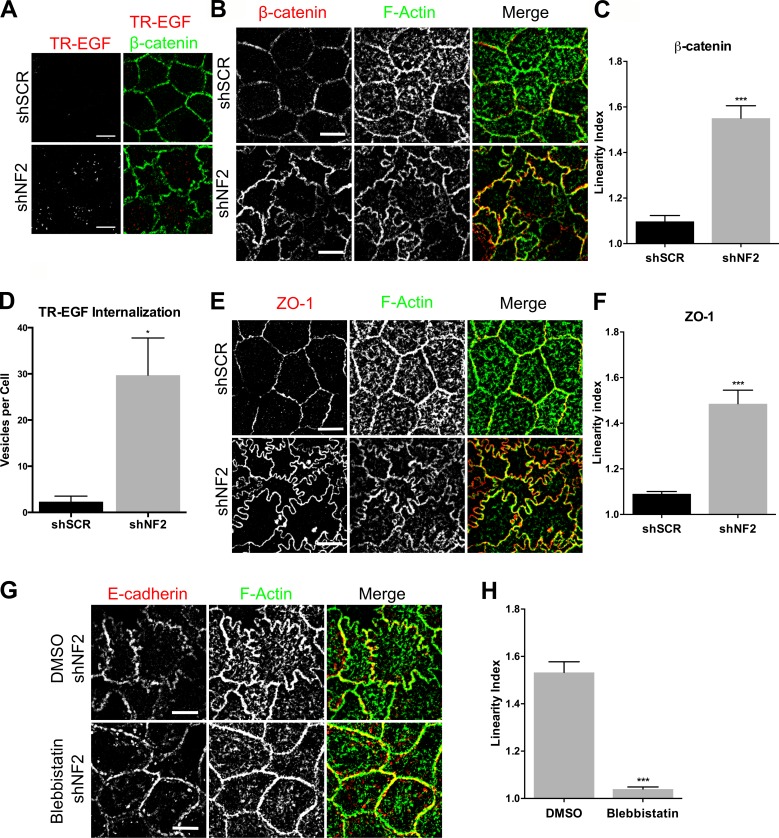
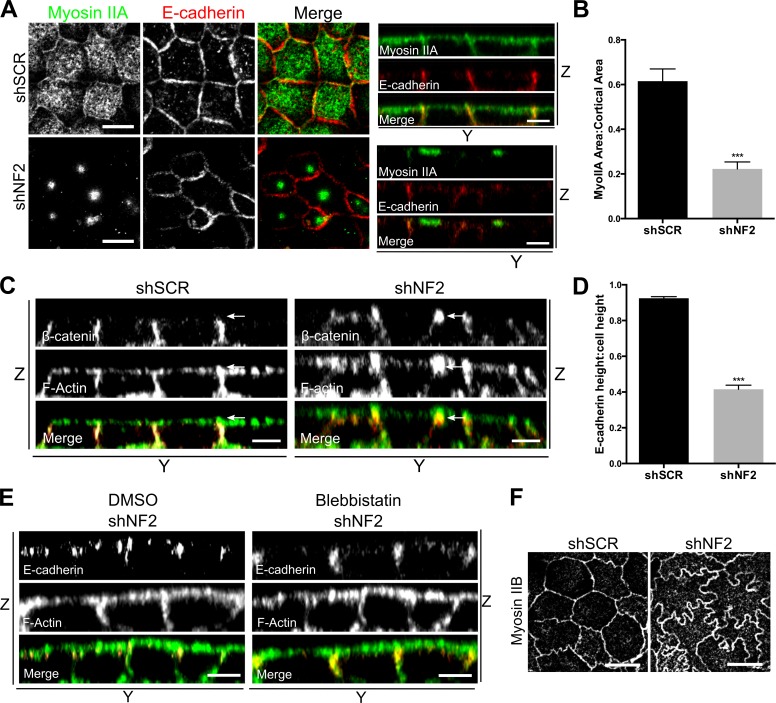
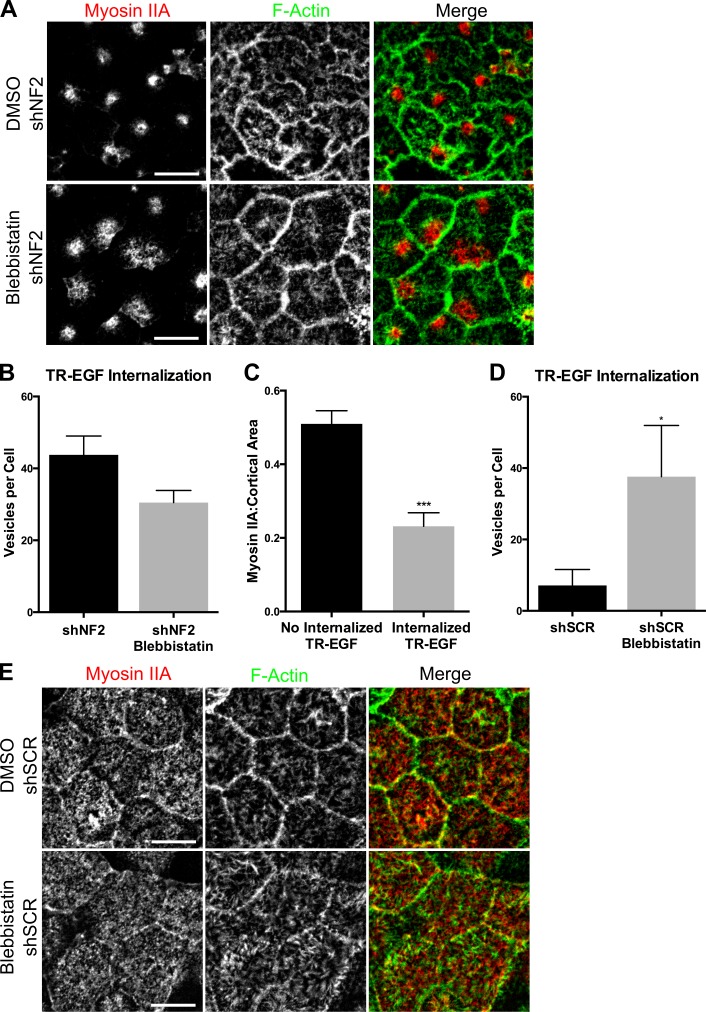
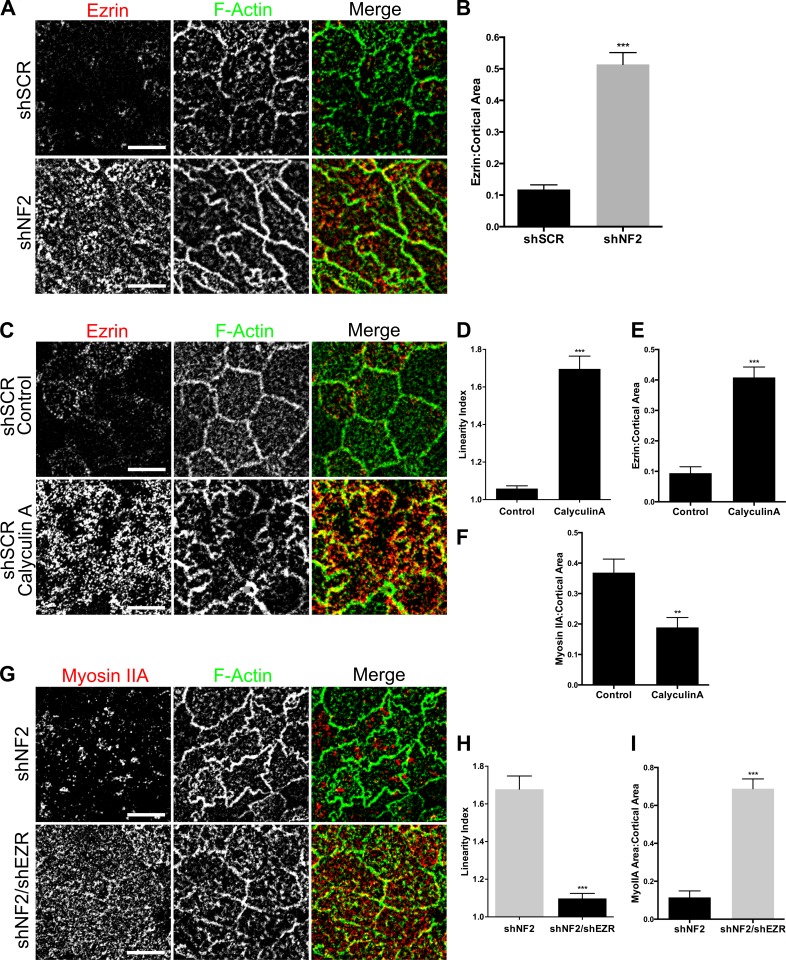
The proliferation of normal cells is inhibited at confluence, but the molecular basis of this phenomenon, known as contact-dependent inhibition of proliferation, is unclear. We previously identified the neurofibromatosis type 2 (NF2) tumor suppressor Merlin as a critical mediator of contact-dependent inhibition of proliferation and specifically found that Merlin inhibits the internalization of, and signaling from, the epidermal growth factor receptor (EGFR) in response to cell contact. Merlin is closely related to the membrane-cytoskeleton linking proteins Ezrin, Radixin, and Moesin, and localization of Merlin to the cortical cytoskeleton is required for contact-dependent regulation of EGFR. We show that Merlin and Ezrin are essential components of a mechanism whereby mechanical forces associated with the establishment of cell-cell junctions are transduced across the cell cortex via the cortical actomyosin cytoskeleton to control the lateral mobility and activity of EGFR, providing novel insight into how cells inhibit mitogenic signaling in response to cell contact.


Figures

Figure 1.
Figure 1.
EGFR is immobilized at the plasma membrane in a Merlin- and actin-dependent manner. (A) SPTM depicting the mean diffusivity of EGFR molecules in the plasma membrane of Nf2−/− (left) or Nf2WT-expressing (right) LDCs. Histograms (purple) show the relative frequency at which beads were observed (y axis) with a given coefficient (Dmacro; x axis). Overlaid on each histogram is a two-Gaussian fit (orange and blue) and its sum (solid black). The log-scale x axis displays Dmacro representing increasing lateral diffusivity from left to right. The underlying chart displays the log mean of Dmacro ± SEM as well as the mean of the two-Gaussian fit subpopulations (right) and the percentage of receptors that fall into each subpopulation (parentheses). Subsequent figures show only the log mean of the Dmacro ± SEM for comparison. Numerical values of calculated Dmacro for all experiments are displayed in Table S1. (B) Lateral mobility of EGFR in Nf2−/− or Nf2WT-expressing LDCs with and without 5-µM cytochalasin D or 5-µM latrunculin A treatment. (C) Internalization of TR-EGF, which reliably marks EGF–EGFR complexes in Nf2−/− or Nf2WT-expressing LDCs with and without cytochalasin D or latrunculin A treatment. Numerical values for quantification of TR-EGF vesicles per cell for all experiments are displayed in Table S2. (D) Representative confocal images of internalized TR-EGF (red; 30-min stimulation) in mosaic populations of Nf2−/− and Nf2WT-expressing (green) LDCs with and without cytochalasin D. Bars, 10 µm. (B and C) Data are represented as mean ± SEM. ***, P < 0.001 (one-way ANOVA with multiple comparisons). Data are representative of at least three experiments.
Figure 2.
Figure 2.
Rapid, local, signal-dependent immobilization of EGFR in confluent Nf2WT-expressing cells. (A) Lateral mobility of EGFR in confluent, serum-starved Nf2wt-expressing versus Nf2−/− LDCs at early (0–20 min) and late (40–60 min) time points after EGF-labeled beads were added. Also shown is the impact of 1-µM erlotinib treatment on EGFR mobility in Nf2WT-expressing cells. Data are represented as mean ± SEM. ***, P < 0.001 (one-way ANOVA with multiple comparisons). (B) Lateral mobility of EGFR in confluent, serum-starved Nf2WT-expressing LDCs measured at 2-min intervals after visually observing bead-to-cell attachment. Data are binned according to the time elapsed between exposing cells to EGF-labeled beads and observing bead-to-cell attachment. The graph shown is a representative time course of the mobility of a single bead over time. For each experiment, n > 3 beads. (C) Lateral mobility of single EGF-labeled beads on the surface of confluent, serum-starved Nf2WT-expressing cells at increasing time points after release from a laser optical trap (arrow). Data are representative of at least three experiments.
Figure 3.
Figure 3.
Cell junctions in Nf2−/− LDCs are under increased mechanical stress. (A) Confocal images showing Nf2−/− or Nf2WT-expressing LDCs at early (left) and late (right) stages of confluence; cells were labeled with an anti–β-catenin antibody (red) and with phalloidin to detect F-actin (green). (B) Junctional localization of β-catenin was quantified by fluorescence intensity analysis of AJs in early and late confluent Nf2−/− and Nf2WT-expressing LDCs. (C) Junctional localization of F-actin was quantified by fluorescence intensity analysis of AJs in late confluent Nf2−/− and Nf2WT-expressing LDCs. (D) Confocal images showing endogenous vinculin at AJs in Nf2−/− and Nf2WT-expressing LDCs. (E) The amount of vinculin at AJs in Nf2−/− and Nf2WT-expressing LDCs was quantified by measuring the junctional area stained for vinculin. (F) Confocal images showing endogenous β-catenin (red) and/or F-actin (green) in Nf2−/− LDCs treated with 100-µM blebbistatin or vehicle (DMSO). (G) Junctional localization of β-catenin in DMSO- and blebbistatin-treated confluent Nf2−/− LDCs was quantified by fluorescence intensity analysis of AJs. (H) Junctional localization of β-catenin in Nf2−/− LDCs cultured on stiff (40 kPa) and soft (12 kPa) polyacrylamide hydrogels. (B, C, E, G, and H) Error bars indicate SEM (n = 25 junctions per group). *, P < 0.05; ***, P < 0.001. Data are representative of at least three experiments. Bars, 10 µm. a.u., arbitrary units.
Figure 4.
Figure 4.
Merlin limits EGFR internalization and junctional stress in Caco2 colonic epithelial cells. (A) Confocal images of control (shSCR) and shNF2-expressing Caco2 cells showing the localization of β-catenin (green) and internalized TR-EGF (red; 30 min after stimulation). (B) Confocal images of control and shNF2-expressing Caco2 cells showing junctional localization of β-catenin (red) and F-actin (green). (C) Linearity index of β-catenin–labeled cell junctions in the experiment in B was quantified and graphed as the mean of the ratio of the length of a freehand-drawn line to a straight line drawn between two junctional vertices. (D) Internalized TR-EGF was quantified by fluorescence intensity thresholding to measure the number of TR-EGF vesicles per cell. (E) Confocal images showing junctional localization of ZO-1 (red) and F-actin (green). (F) Linearity index of ZO-1–labeled junctions calculated from the experiment in E. (G) Confocal images of shNF2-expressing Caco2 cells treated with 100-µM blebbistatin or DMSO showing junctional localization of E-cadherin (red) and F-actin (green). (H) Linearity index of F-actin–labeled junctions calculated from the experiment in F. (C, D, F, and H) Error bars indicate SEM. n = at least 25 junctions per group. *, P < 0.05; ***, P < 0.001. Data are representative of at least three experiments. Bars, 10 µm.
Figure 5.
Figure 5.
Features of apical contraction in Merlin-deficient cells. (A) Confocal images showing the cortical distribution of MyoIIA (green) and E-cadherin (red) in control (shSCR) and shNF2-expressing Caco2 monolayers. Bars, 10μm. The distributions of E-cadherin and F-actin along the z axis are shown in accompanying y-z views (apical = top). Bars, 5μm. (B) The cortical area covered by MyoIIA was quantified by calculating the ratio of cortical MyoIIA to the total cortical area delimited by F-actin. n = 25 cells per group. (C) Y-Z confocal images of control and shNF2-expressing Caco2 cells showing the vertical height and apical position of the ZA marked by β-catenin and F-actin. Arrows indicate the apical junction region. Bars, 5μm. (D) Ratio of E-cadherin–marked cell junction height to total cell height in control and shNF2-expressing Caco2 cells. n = 10 cells per group. (E) Y-Z confocal images depicting the vertical height and position of the E-cadherin and F-actin–stained ZA in shNF2-expressing Caco2 cells treated with either 100-µM blebbistatin or DMSO. Bars, 5μm. (F) Confocal images showing the distribution of Myosin IIB in control and shNF2-expressing Caco2 cells. Bars, 10μm. Error bars indicate SEM. ***, P < 0.001. Data are representative of at least three experiments.
Figure 6.
Figure 6.
Uniformly distributed MyoIIA is essential for contact-dependent inhibition of EGFR internalization. (A) Confocal images of shNF2-expressing cells treated with 100-µM blebbistatin or DMSO and stained for MyoIIA and F-actin. (B) Quantification of internalized TR-EGF–containing vesicles (30 min after stimulation) in DMSO and blebbistatin-treated shNF2-expressing cells. n = >50 cells per group. P > 0.05. (C) Graph shows the fraction of cortical area covered by MyoIIA in shSCR cells that do not (left) versus do (right) display internalized TR-EGF at 30 min after stimulation. n = 25 cells per group. (D) Internalized TR-EGF (30 min after stimulation) was quantified in DMSO and blebbistatin-treated control cells. n = >50 cells per group. (E) Confocal images depict MyoIIA and junctional F-actin localization in control Caco2 cells treated with DMSO or 100-µM blebbistatin. Error bars indicate SEM. *, P < 0.05; ***, P < 0.001. Data are representative of at least three experiments. Bars, 10 µm.
Figure 7.
Figure 7.
Increased cortical Ezrin drives apical contractility. (A) Endogenous Ezrin (red) and junctional F-actin (green) in confluent control and shNF2-expressing Caco2 cells as depicted by representative confocal images. (B) The levels of apical Ezrin in A were quantified by calculating the ratio of apical Ezrin to the total apical area delimited by F-actin. (C) Confocal images showing apical Ezrin and junctional F-actin in shSCR Caco2 cells treated with DMSO or 1-µM calyculin A for 5 min. (D) Linearity index of F-actin–labeled junctions calculated from the experiment in C. (E) Levels of apical Ezrin in control or calyculin A–treated cells. (F) Levels of cortical MyoIIA in control or calyculin A–treated cells. (G) Confocal images depict the levels and distribution of MyoIIA (red) and F-actin (green) in shNF2- and shNF2/shEZR-expressing Caco2 cells. (H) Linearity index in shNF2- and shNF2/shEZR-expressing cells. (I) Cortical area covered by MyoIIA in shNF2- and shNF2/shEZR-expressing cells. Error bars indicate SEM. **, P < 0.01; ***, P < 0.001. Data are representative of at least two experiments. Bars, 10 µm.

References

    1. Avraham R., and Yarden Y.. 2011. Feedback regulation of EGFR signalling: Decision making by early and delayed loops. Nat. Rev. Mol. Cell Biol. 12:104–117. 10.1038/nrm3048 - DOI - PubMed
    1. Benhamouche S., Curto M., Saotome I., Gladden A.B., Liu C.H., Giovannini M., and McClatchey A.I.. 2010. Nf2/Merlin controls progenitor homeostasis and tumorigenesis in the liver. Genes Dev. 24:1718–1730. 10.1101/gad.1938710 - DOI - PMC - PubMed
    1. Benjamin J.M., Kwiatkowski A.V., Yang C., Korobova F., Pokutta S., Svitkina T., Weis W.I., and Nelson W.J.. 2010. αE-catenin regulates actin dynamics independently of cadherin-mediated cell–cell adhesion. J. Cell Biol. 189:339–352. 10.1083/jcb.200910041 - DOI - PMC - PubMed
    1. Boggiano J.C., and Fehon R.G.. 2012. Growth control by committee: Intercellular junctions, cell polarity, and the cytoskeleton regulate Hippo signaling. Dev. Cell. 22:695–702. 10.1016/j.devcel.2012.03.013 - DOI - PMC - PubMed
    1. Buckley C.D., Tan J., Anderson K.L., Hanein D., Volkmann N., Weis W.I., Nelson W.J., and Dunn A.R.. 2014. Cell adhesion. The minimal cadherin-catenin complex binds to actin filaments under force. Science. 346:1254211 10.1126/science.1254211 - DOI - PMC - PubMed

Publication types

MeSH terms