. 2015 Sep 30:9:53.
doi: 10.3389/fncir.2015.00053. eCollection 2015.

Corticofugal projection patterns of whisker sensorimotor cortex to the sensory trigeminal nuclei

Affiliations

Corticofugal projection patterns of whisker sensorimotor cortex to the sensory trigeminal nuclei

Jared B Smith et al. Front Neural Circuits. .

Abstract

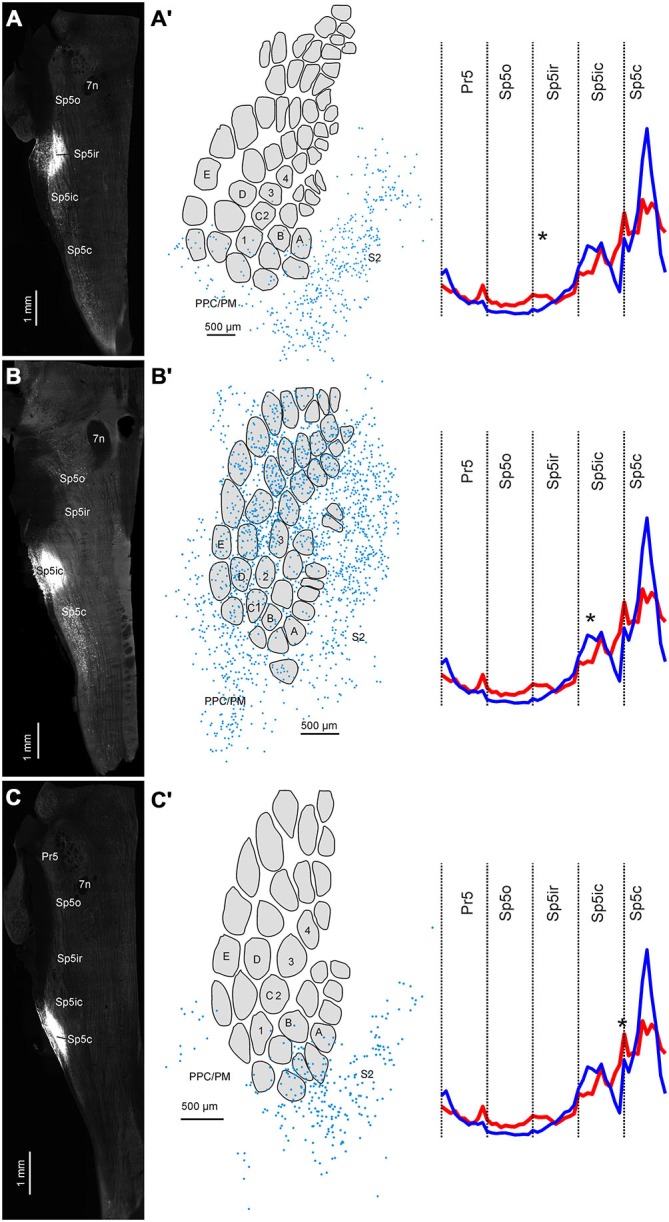
The primary (S1) and secondary (S2) somatosensory cortices project to several trigeminal sensory nuclei. One putative function of these corticofugal projections is the gating of sensory transmission through the trigeminal principal nucleus (Pr5), and some have proposed that S1 and S2 project differentially to the spinal trigeminal subnuclei, which have inhibitory circuits that could inhibit or disinhibit the output projections of Pr5. Very little, however, is known about the origin of sensorimotor corticofugal projections and their patterns of termination in the various trigeminal nuclei. We addressed this issue by injecting anterograde tracers in S1, S2 and primary motor (M1) cortices, and quantitatively characterizing the distribution of labeled terminals within the entire rostro-caudal chain of trigeminal sub-nuclei. We confirmed our anterograde tracing results by injecting retrograde tracers at various rostro-caudal levels within the trigeminal sensory nuclei to determine the position of retrogradely labeled cortical cells with respect to S1 barrel cortex. Our results demonstrate that S1 and S2 projections terminate in largely overlapping regions but show some significant differences. Whereas S1 projection terminals tend to cluster within the principal trigeminal (Pr5), caudal spinal trigeminal interpolaris (Sp5ic), and the dorsal spinal trigeminal caudalis (Sp5c), S2 projection terminals are distributed in a continuum across all trigeminal nuclei. Contrary to the view that sensory gating could be mediated by differential activation of inhibitory interconnections between the spinal trigeminal subnuclei, we observed that projections from S1 and S2 are largely overlapping in these subnuclei despite the differences noted earlier.

Keywords: anterograde tracing; barrel cortex; corticofugal pathways; retrograde tracing; trigeminal nuclei; whisker.


Figures

Figure 1
Figure 1
Labeling patterns in the trigeminal sensory nuclei following dual anterograde tracer deposits in the whisker representations of primary (S1) and secondary somatosensory (S2) cortices. (A) Photomicrograph of tangential cortical section processed for Biotinylated Dextran Amine (BDA) (B). Locations of the tracer deposits in the (C,D) rows of S1 (BDA) and (B–D) rows of S2 (FR) shown on a tangential section of the cortex through layer IV, processed for cytochrome oxidase (CO). (C) Adjacent section processed for the fluorescent tracer Fluoro Ruby (FR), which was injected at two locations in the S2 whisker representation corresponding to the inset in (B). (D) Horizontal section through the contralateral trigeminal sensory nuclei processed for BDA shows different nuclei and anatomical landmarks (dotted lines), identified from an adjoining CO section. (E) The same section viewed using a TRITC filter for FR visualization showing labeled terminals across trigeminal sensory nuclei. (F,H,J) Photomicrographs of the areas in the insets of 1D show the morphology of BDA-labeled terminals in Pr5, Sp5ic and Sp5c, respectively. (G,I,K) The areas under the same insets (E) but viewed using a TRITC filter to show the morphology of FR labeled terminals. The BDA reaction product can be seen on the same photomicrographs. Abbreviations: M1, primary motor cortex; PPC/PM, posterior parietal cortex/posterio-medial cortex; Pr5, principal trigeminal nucleus; Sp5o, spinal trigeminal nucleus pars oralis; Sp5ir, spinal trigeminal nucleus pars interpolaris rostral; Sp5ic, spinal trigeminal nucleus pars interpolaris caudal; Sp5c, spinal trigeminal nucleus pars caudalis; Sp5t, spinal trigeminal tract; 7n, nucleus of the 7th cranial nerve; VCN, ventral cochlear nucleus.
Figure 2
Figure 2
Digital reconstructions of anterogradely-labeled terminals in five horizontal sections spanning the entire dorsoventral extent of the trigeminal sensory nuclei. Labeled S1 corticofugal terminals are shown in blue, S2 terminals in red. Sections are arranged from the most dorsal (A) to the most ventral (E). Outlines of the different trigeminal sensory nuclei, defined using adjacent CO sections are shown superimposed on the plotted terminals. Consecutive sections were 180 μm apart.
Figure 3
Figure 3
Corticofugal terminal counts in the trigeminal sensory nuclei following dual tracer injections in S1 and S2. Bar graph showing the total number of labeled terminals resulting from anterograde tracer injections into S1 (blue) and S2 (red) whisker representations, normalized by the total number of terminals resulting from each injection, averaged across animals (n = 3). Brackets indicate standard error of the mean.
Figure 4
Figure 4
Pattern of corticofugal terminal distribution across trigeminal sensory nuclei in both dorsoventral and rostro-caudal dimensions. (A) Terminal counts from an anterograde tracer injection into S1 cortex, normalized by total S1 terminal counts tallied across all horizontal sections through the brainstem. The different horizontal sections are arranged along the y axis with the dorsal most section located at the top. The rostral and caudal boundaries of the different trigeminal sensory nuclei have been overlaid on top using dotted white lines. All rostrocaudal measurements were normalized to the rostral boundary of the Pr5 nucleus for each section. Three animals are represented in the three rows. The yellow dotted lines in the second row denote the section shown in Figure 1D. (B) Identical plots for terminals labeled with an anterograde tracer injected into S2. All rostrocaudal distances are in mm.
Figure 5
Figure 5
The rostrocaudal distribution of labeled terminals from S1 and S2 cortical injections across the different trigeminal sensory nuclei. (A) The binned terminal counts resulting from an anterograde injection into the S1 cortex of three rats. Each nucleus, irrespective of its actual rostrocaudal extent, has been binned into 10, equally spaced bins. The width of each bin varies according the rostro-caudal extent of each nucleus with Pr5 bins being the smallest. Dotted lines show the binned terminal counts averaged across all sections, for each animal. Thick line denotes the mean of these averages across animals. (B) Identical plot of terminal distribution from the S2 injection. a.u., arbitrary units.
Figure 6
Figure 6
Representative example showing cortical labeling patterns following a retrograde tracer (fluorogold, FG) deposit into the Sp5ic nucleus. (A) Horizontal section through brainstem showing location of the FG injection site. (B) Adjacent horizontal section showing the presence of clusters of retrogradely labeled cells (arrows) located in Sp5ic and Sp5c. White boxes denote insets shown at greater magnification in panels (C–D). (E) Horizontal section through layer IV of the contralateral S1 cortex visualized for CO staining showing the spatial extents of the S1 barrel field, S2 and PPM/PC. (F,F′). Two horizontal sections through infragranular layers, processed for visualization of the tracer, showing retrogradely labeled cells in S1, S2 and PPC/PM. (G) Digital reconstructions of the positions of the retrogradely labeled cells shown superimposed upon outlines of layer IV barrels and inter-barrel septa obtained from the CO-stained section. The sections containing the CO stained barrel field and the retrogradely labeled cells were aligned using blood vessels running orthogonal to the cortical surface (panels (E,F,F′) arrows) as control points.
Figure 7
Figure 7
Three cases showing the distribution of retrogradely labeled cells in cortex following FG deposits at different rostrocaudal positions in the trigeminal sensory nuclei. (A) FG deposit into the Sp5ir. (A′) Digital reconstruction of retrogradely labeled cells in cortex superimposed on an outline of layer IV barrels and septa. Schematic shows the average distribution of binned terminals across the different trigeminal sensory nuclei (taken from Figure 5) with the location of the current injection marked with an asterisk. (B–C′) Identical plots for two other cases receiving tracer deposits into the Sp5ic and the Sp5ic/Sp5c boundary.
Figure 8
Figure 8
A representative example showing the laminar distribution of retrogradely labeled cells in cortex following a tracer deposit into the Sp5ic. (A) Horizontal section through the brainstem showing the location of the injection site in Sp5ic. (B) Coronal section through cortex showing the layer IV barrels (asterisks) in relation to the retrogradely labeled cells. The layer boundaries have been drawn from neighboring sections stained for CO and superimposed on this section. (C) Inset from (B), shown at higher magnification, showing the retrogradely labeled cells with the presence of apical dendrites (arrowhead).
Figure 9
Figure 9
A representative example of a case receiving dual anterograde tracer deposits into the M1 and S1 cortices. (A) Nissl stained coronal section through the cortex showing the track of the pipette used to inject FR into M1. (B) Injection site of FR into vibrissal representation of the M1 cortex. (C) Coronal section through S1 barrel cortex processed for CO labeling. (D) Adjacent section, processed for visualization of BDA showing injection site in S1 and associated anterograde labeling. Anterograde labeling can be seen in ventral posterior medial nucleus (VPM). (E) Coronal section through the brainstem at the level of Pr5 stained for CO for better visualization of nuclear boundaries and neural tracts. (F) Adjacent section processed for visualization of FR terminals showing lack of any labeled terminals. (G) Adjacent section processed for visualization of BDA labeled terminals showing the presence of labeled varicosities in Pr5. (G′) Inset from (G) shown at greater magnification. (H–J′) Identical photomicrographs from the brainstem at the rostrocaudal level of Sp5o. (K–M′) Sections from the level of Sp5ic. (N–P′) Sections from the level of Sp5c.

Similar articles

Cited by

References

    1. Alloway K. D., Smith J. B., Beauchemin K. J. (2010). Quantitative analysis of the bilateral brainstem projections from the whisker and forepaw regions in rat primary motor cortex. J. Comp. Neurol. 518, 4546–4566. 10.1002/cne.22477 - DOI - PMC - PubMed
    1. Alloway K. D., Zhang M., Chakrabarti S. (2004). Septal columns in rodent barrel cortex: functional circuits for modulating whisking behavior. J. Comp. Neurol. 480, 299–309. 10.1002/cne.20339 - DOI - PubMed
    1. Aronoff R., Matyas F., Mateo C., Ciron C., Schneider B., Petersen C. C. (2010). Long-range connectivity of mouse primary somatosensory barrel cortex. Eur. J. Neurosci. 31, 2221–2233. 10.1111/j.1460-9568.2010.07264.x - DOI - PubMed
    1. Arvidsson J. (1982). Somatotopic organization of vibrissae afferents in the trigeminal sensory nuclei of the rat studied by transganglionic transport of HRP. J. Comp. Neurol. 211, 84–92. 10.1002/cne.902110108 - DOI - PubMed
    1. Avendaño C., Machín R., Bermejo P. E., Lagares A. (2005). Neuron numbers in the sensory trigeminal nuclei of the rat: a GABA- and glycine-immunocytochemical and stereological analysis. J. Comp. Neurol. 493, 538–553. 10.1002/cne.20778 - DOI - PubMed

Publication types

MeSH terms

LinkOut - more resources