

Screening for biomarkers of liver injury induced by Polygonum multiflorum: a targeted metabolomic study
- PMID: 26483689
- PMCID: PMC4591842
- DOI: 10.3389/fphar.2015.00217
Screening for biomarkers of liver injury induced by Polygonum multiflorum: a targeted metabolomic study
Abstract
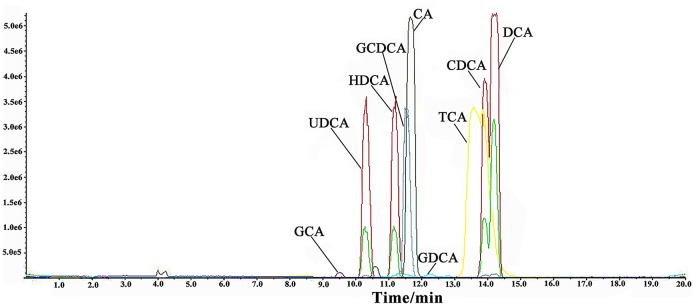
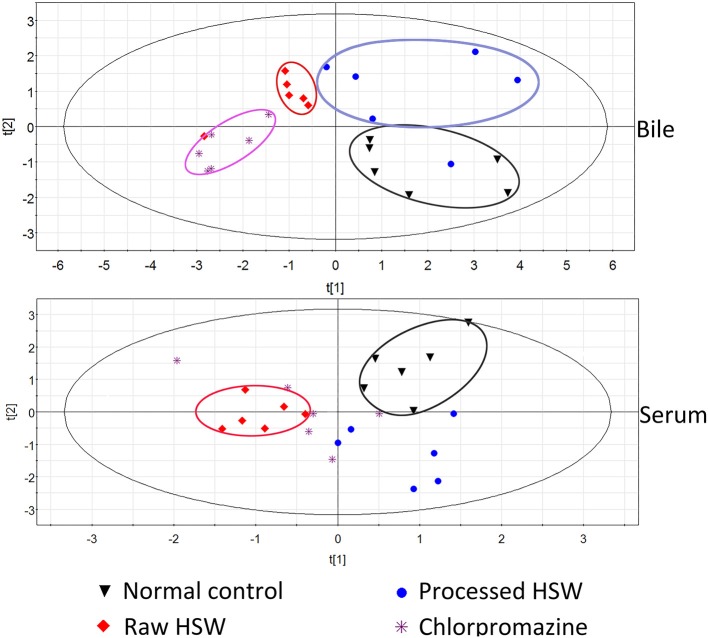
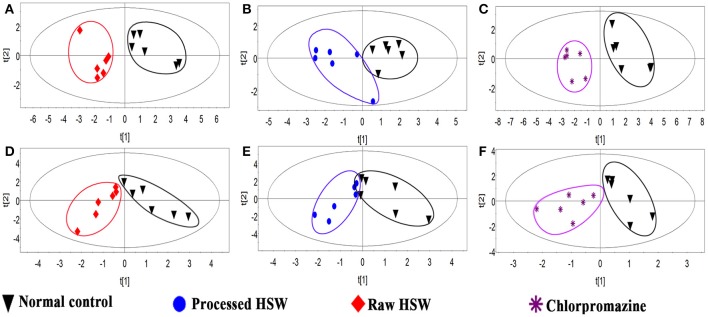
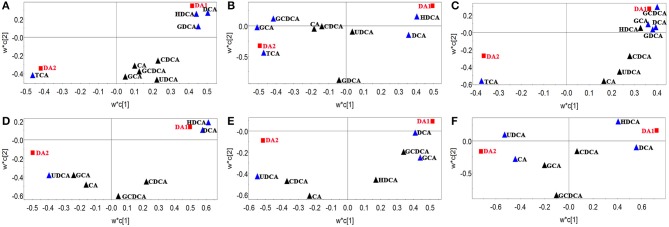
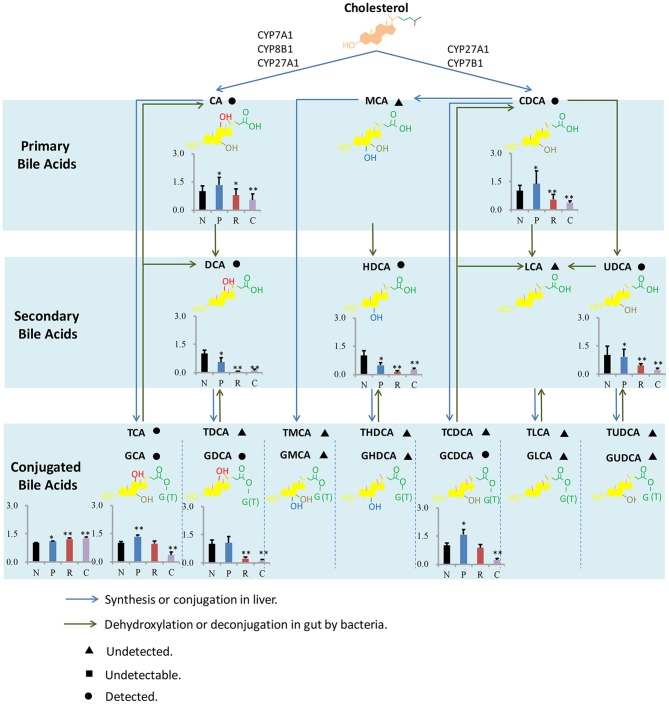
Heshouwu (HSW), the dry roots of Polygonum multiflorum, a classical traditional Chinese medicine is used as a tonic for a wide range of conditions, particularly those associated with aging. However, it tends to be taken overdose or long term in these years, which has resulted in liver damage reported in many countries. In this study, the indicative roles of nine bile acids (BAs) were evaluated to offer potential biomarkers for HSW induced liver injury. Nine BAs including cholic acid (CA) and chenodeoxycholic acid (CDCA), taurocholic acid (TCA), glycocholic acid (GCA), glycochenodeoxycholic acid (GCDCA), deoxycholic acid (DCA), glycodeoxycholic acid (GDCA), ursodeoxycholic acid (UDCA), and hyodeoxycholic acid (HDCA) in rat bile and serum were detected by a developed LC-MS method after 42 days treatment. Partial least square-discriminate analysis (PLS-DA) was applied to evaluate the indicative roles of the nine BAs, and metabolism of the nine BAs was summarized. Significant change was observed for the concentrations of nine BAs in treatment groups compared with normal control; In the PLS-DA plots of nine BAs in bile, normal control and raw HSW groups were separately clustered and could be clearly distinguished, GDCA was selected as the distinguished components for raw HSW overdose treatment group. In the PLS-DA plots of nine BAs in serum, the normal control and raw HSW overdose treatment group were separately clustered and could be clearly distinguished, and HDCA was selected as the distinguished components for raw HSW overdose treatment group. The results indicated the perturbation of nine BAs was associated with HSW induced liver injury; GDCA in bile, as well as HDCA in serum could be selected as potential biomarkers for HSW induced liver injury; it also laid the foundation for the further search on the mechanisms of liver injury induced by HSW.
Keywords: LC-MS; Polygonum multiflorum; bile acid; biomarker; liver injury.
Figures
References
-
- Bechmann L. P., Kocabayoglu P., Sowa J. P., Sydor S., Best J., Schlattjan M., et al. (2013). Free fatty acids repress small heterodimer partner (SHP) activation and adiponectin counteracts bile acid-induced liver injury in superobese patients with nonalcoholic steatohepatitis. Hepatology 57, 1394–1406. 10.1002/hep.26225 - DOI - PubMed
-
- Bobeldijk I., Hekman M., de Vries-van der Weij J., Coulier L., Ramaker R., Kleemann R., et al. (2008). Quantitative profiling of bile acids in biofluids and tissues based on accurate mass high resolution LC-FT-MS: compound class targeting in a metabolomics workflow. J. Chromatogr. B 871, 306–313. 10.1016/j.jchromb.2008.05.008 - DOI - PubMed
-
- But P. P., Tomlinson B., Lee K. L. (1996). Hepatitis related to the Chinese medicine Shou-wu-pian manufactured from Polygonum multiflorum. Vet. Hum. Toxicol. 38, 280–282. - PubMed
LinkOut - more resources
Full Text Sources
Other Literature Sources