

Circadian Phenotype Composition is a Major Predictor of Diurnal Physical Performance in Teams
- PMID: 26483754
- PMCID: PMC4589674
- DOI: 10.3389/fneur.2015.00208
Circadian Phenotype Composition is a Major Predictor of Diurnal Physical Performance in Teams
Abstract
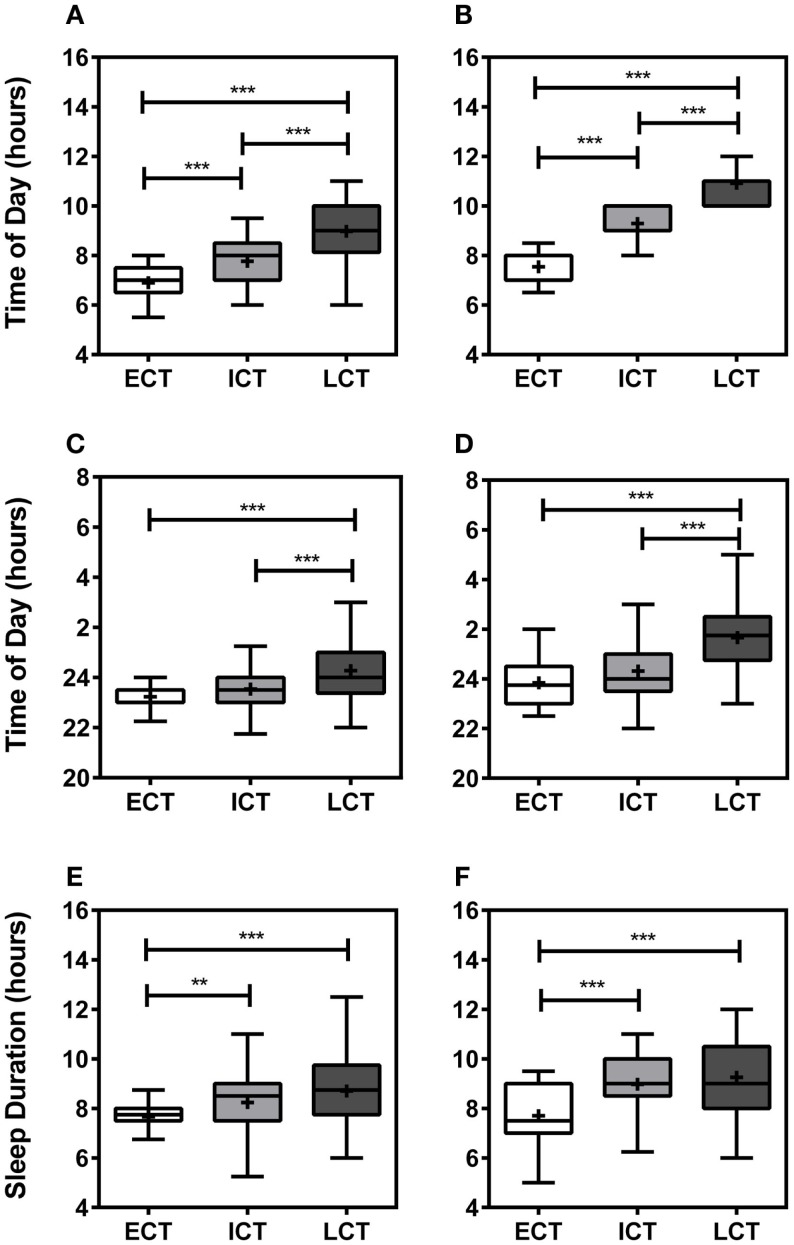
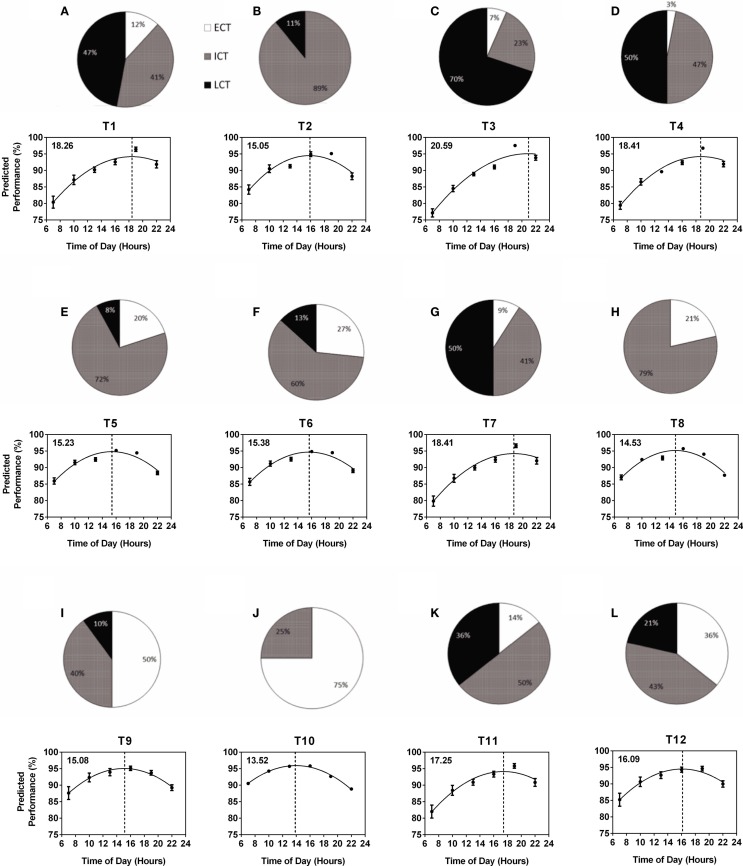
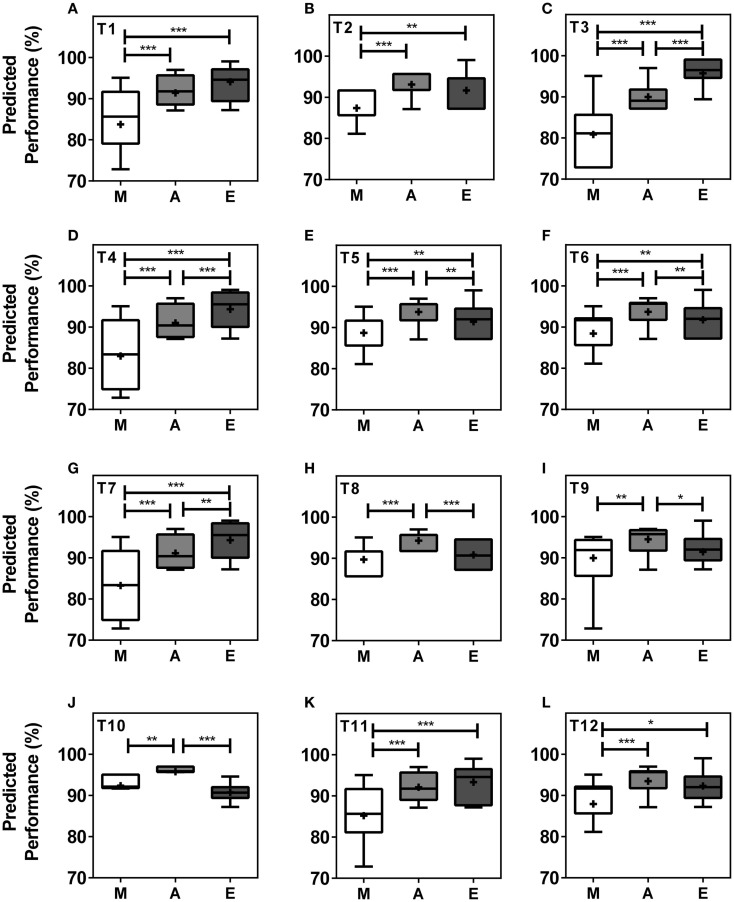
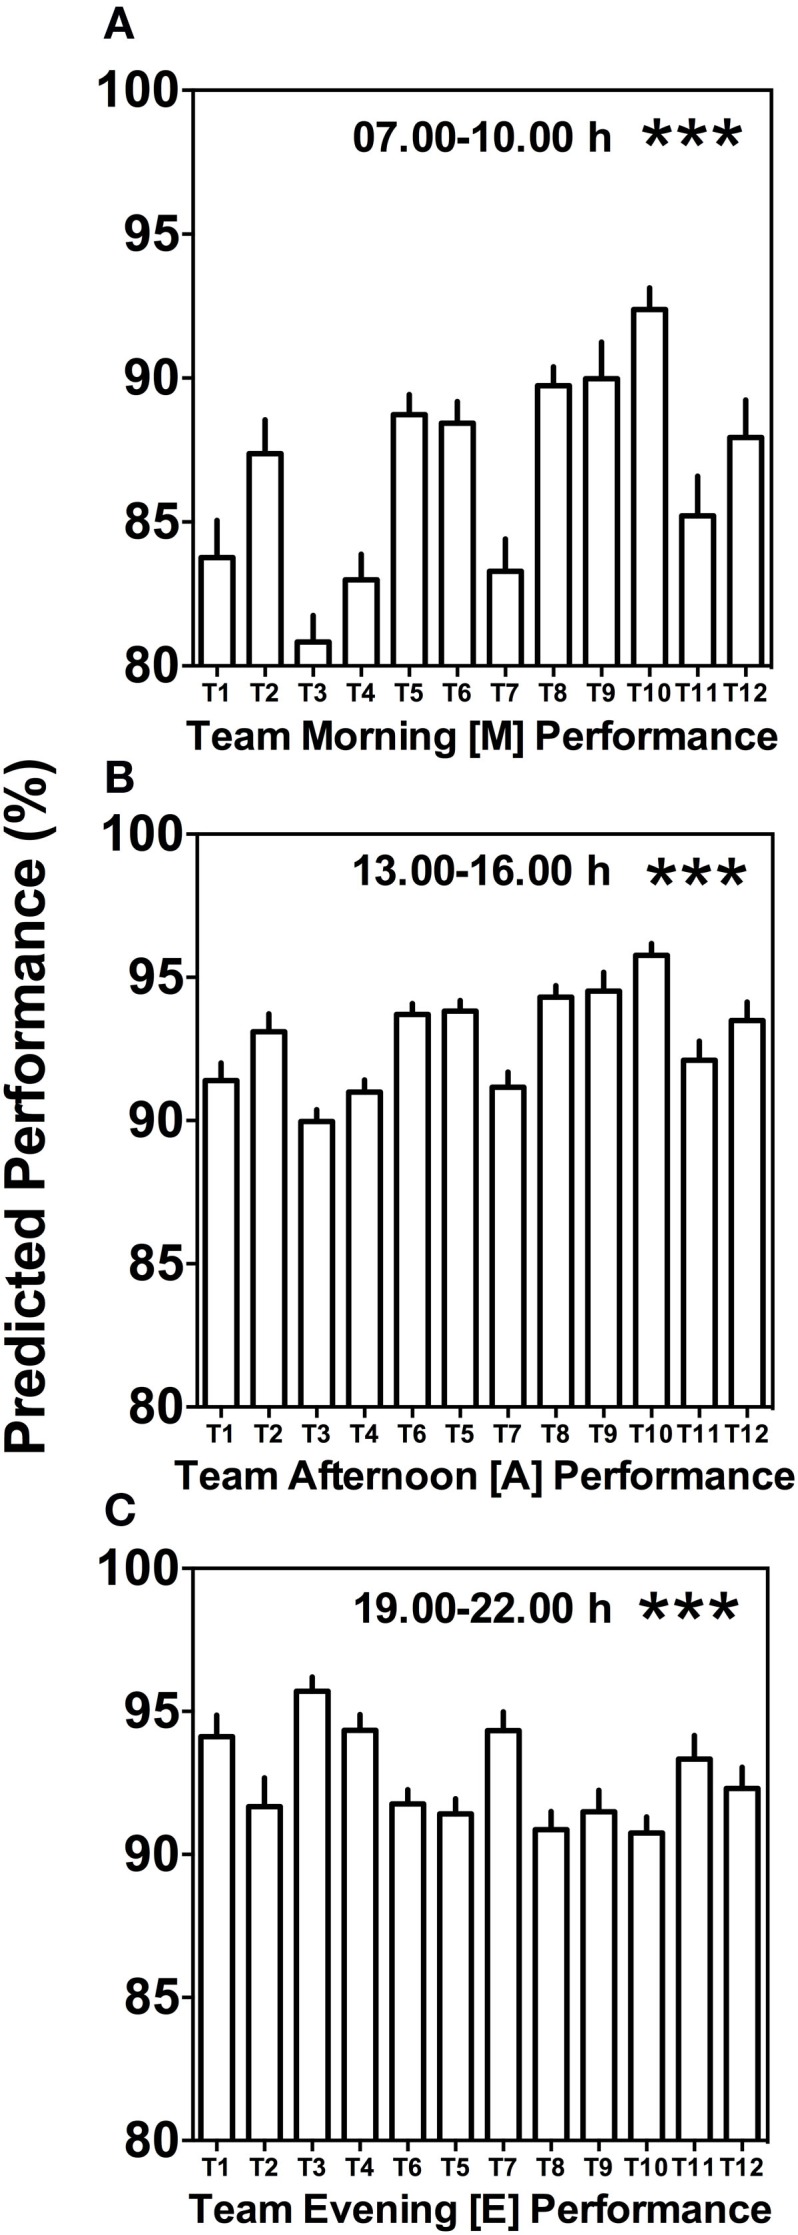
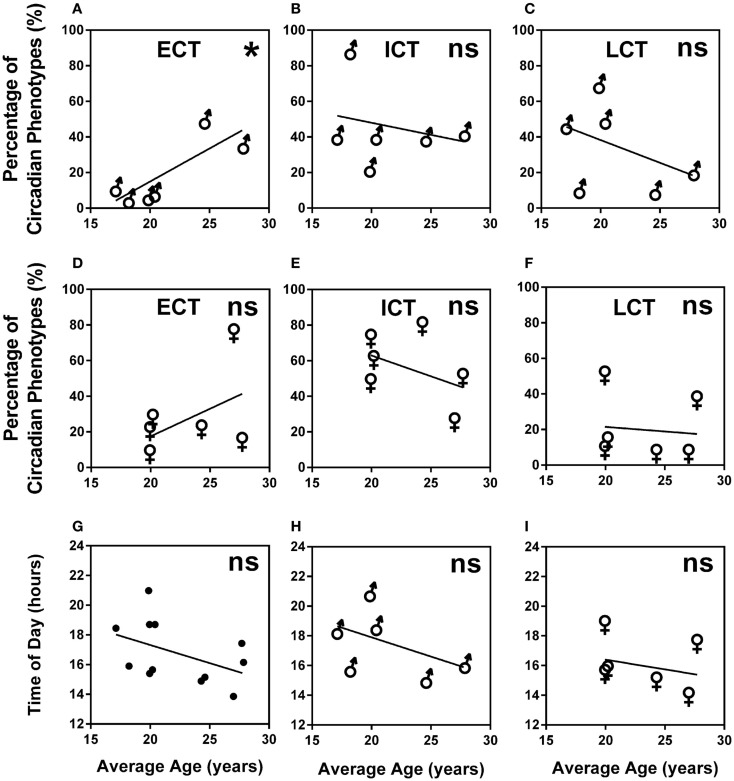
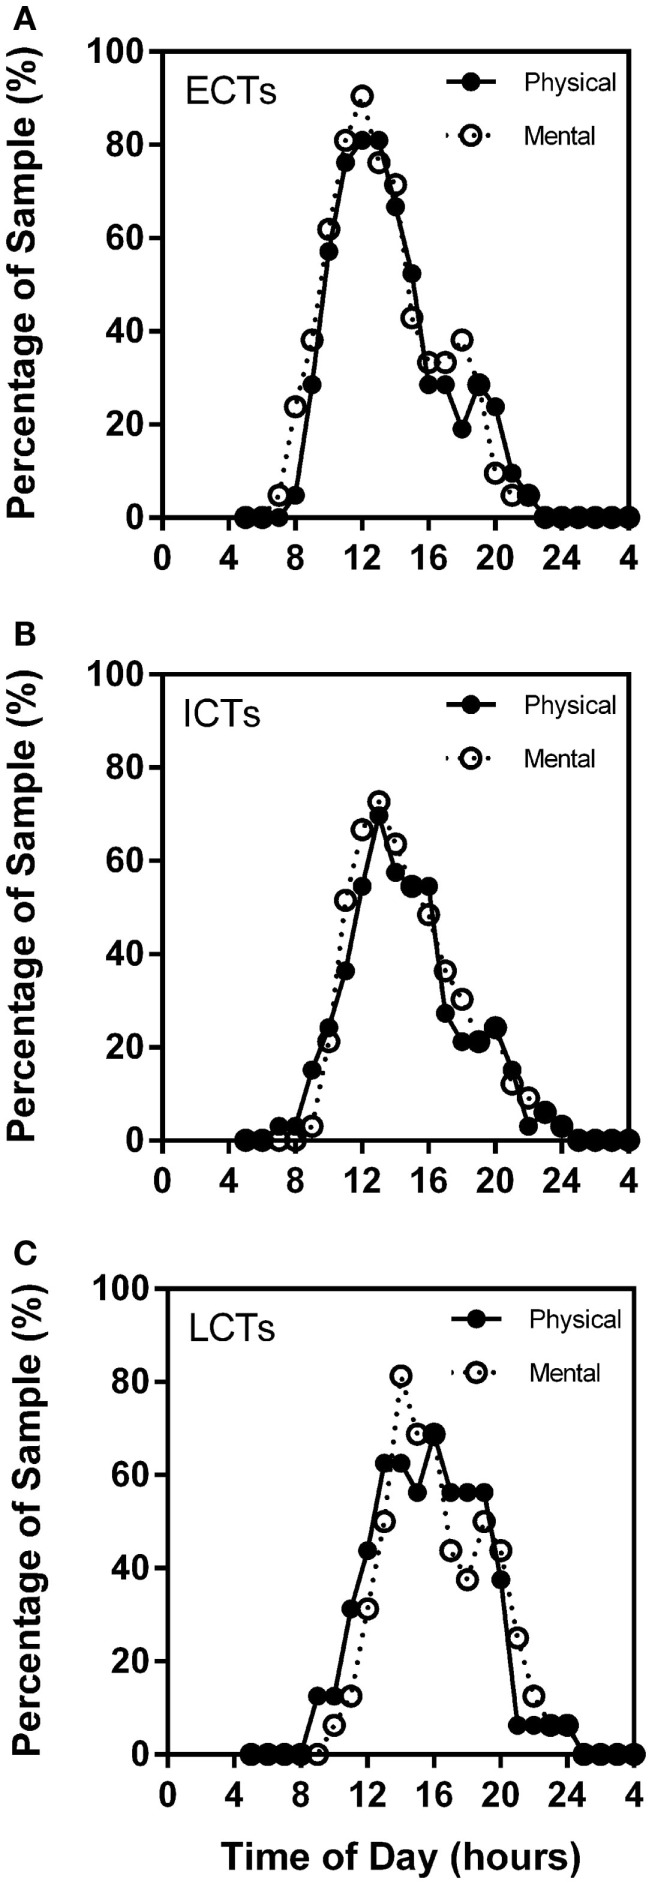
Team performance is a complex phenomenon involving numerous influencing factors including physiology, psychology, and management. Biological rhythms and the impact of circadian phenotype have not been studied for their contribution to this array of factors so far despite our knowledge of the circadian regulation of key physiological processes involved in physical and mental performance. This study involved 216 individuals from 12 different teams who were categorized into circadian phenotypes using the novel RBUB chronometric test. The composition of circadian phenotypes within each team was used to model predicted daily team performance profiles based on physical performance tests. Our results show that the composition of circadian phenotypes within teams is variable and unpredictable. Predicted physical peak performance ranged from 1:52 to 8:59 p.m. with performance levels fluctuating by up to 14.88% over the course of the day. The major predictor for peak performance time in the course of a day in a team is the occurrence of late circadian phenotypes. We conclude that circadian phenotype is a performance indicator in teams that allows new insight and a better understanding of team performance variation in the course of a day as often observed in different groupings of individuals.
Keywords: circadian; mental; performance; physical; sleep.
Figures
Similar articles
-
The impact of circadian phenotype and time since awakening on diurnal performance in athletes.Curr Biol. 2015 Feb 16;25(4):518-22. doi: 10.1016/j.cub.2014.12.036. Epub 2015 Jan 29. Curr Biol. 2015. PMID: 25639241
-
Human Circadian Phenotyping and Diurnal Performance Testing in the Real World.J Vis Exp. 2020 Apr 7;(158). doi: 10.3791/60448. J Vis Exp. 2020. PMID: 32338646
-
Lighting the way: Exploring diurnal physical performance differences in school-aged visually impaired children and adolescents.Chronobiol Int. 2024 Mar;41(3):417-426. doi: 10.1080/07420528.2024.2312814. Epub 2024 Feb 1. Chronobiol Int. 2024. PMID: 38303130
-
Circadian variation in sports performance.Sports Med. 1996 Apr;21(4):292-312. doi: 10.2165/00007256-199621040-00005. Sports Med. 1996. PMID: 8726347 Review.
-
Effects of sleep and fatigue on teams in a submarine environment.Undersea Hyperb Med. 2018 May-Jun;45(3):257-272. Undersea Hyperb Med. 2018. PMID: 30028913 Review.
Cited by
-
Diurnal variations in the expression of core-clock genes correlate with resting muscle properties and predict fluctuations in exercise performance across the day.BMJ Open Sport Exerc Med. 2021 Feb 10;7(1):e000876. doi: 10.1136/bmjsem-2020-000876. eCollection 2021. BMJ Open Sport Exerc Med. 2021. PMID: 33680499 Free PMC article.
-
Modification of Diurnal Cortisol Secretion in Women's Professional Basketball. A Pilot Study.Int J Environ Res Public Health. 2021 Aug 25;18(17):8961. doi: 10.3390/ijerph18178961. Int J Environ Res Public Health. 2021. PMID: 34501551 Free PMC article.
-
The effects of time of day and chronotype on cognitive and physical performance in healthy volunteers.Sports Med Open. 2018 Oct 24;4(1):47. doi: 10.1186/s40798-018-0162-z. Sports Med Open. 2018. PMID: 30357501 Free PMC article.
-
Exercise sustains the hallmarks of health.J Sport Health Sci. 2023 Jan;12(1):8-35. doi: 10.1016/j.jshs.2022.10.003. Epub 2022 Oct 29. J Sport Health Sci. 2023. PMID: 36374766 Free PMC article. Review.
-
Ageing in relation to skeletal muscle dysfunction: redox homoeostasis to regulation of gene expression.Mamm Genome. 2016 Aug;27(7-8):341-57. doi: 10.1007/s00335-016-9643-x. Epub 2016 May 23. Mamm Genome. 2016. PMID: 27215643 Free PMC article. Review.
References
-
- Gelade GA, Ivery M. The impact of human resource management and work climate on organizational performance. Pers Psychol (2003) 56(2):383–404.10.1111/j.1744-6570.2003.tb00155.x - DOI
-
- Hunter JE. Validity and utility of alternative predictors of job performance. In: Hunter RF, editor. Psychological Bulletin. Michigan State: American Psychological Association (APA). (1984). p. 72–98.10.1037/0033-2909.96.1.72 - DOI
-
- Alderman RB. Influence of local fatigue on speed and accuracy in motor learning. Res Q (1965) 36:131–40. - PubMed
Grants and funding
LinkOut - more resources
Full Text Sources
Other Literature Sources