

Variability in subpopulation formation propagates into biocatalytic variability of engineered Pseudomonas putida strains
- PMID: 26483771
- PMCID: PMC4589675
- DOI: 10.3389/fmicb.2015.01042
Variability in subpopulation formation propagates into biocatalytic variability of engineered Pseudomonas putida strains
Abstract
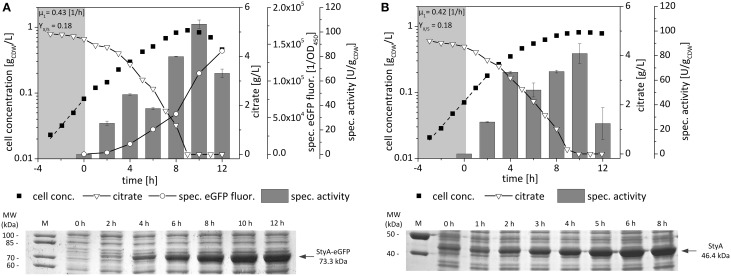
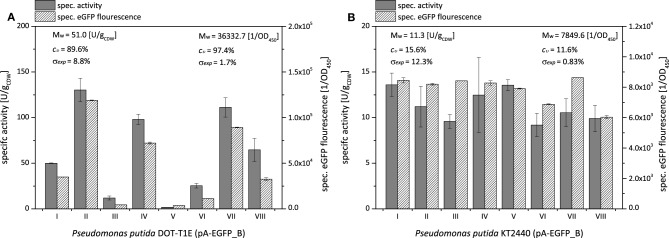
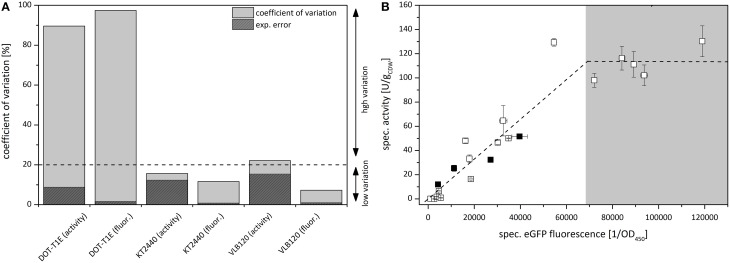
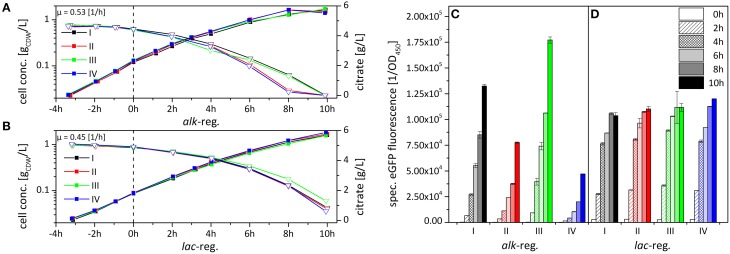
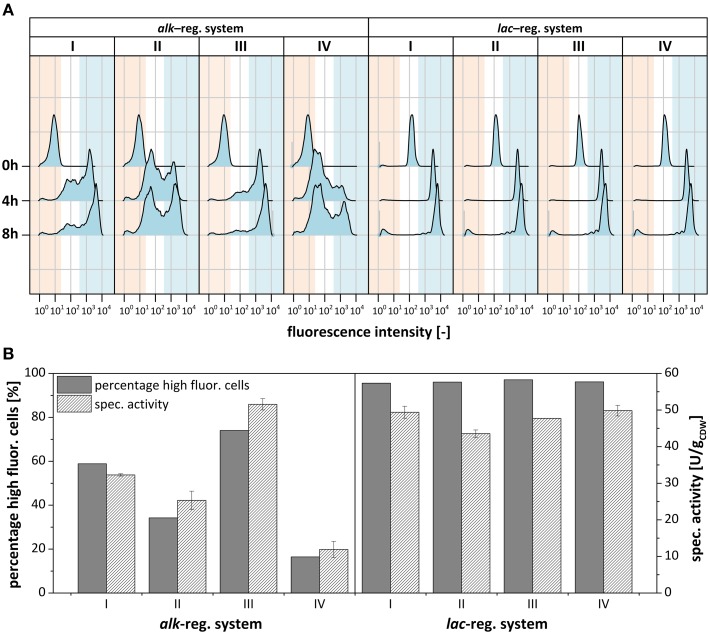
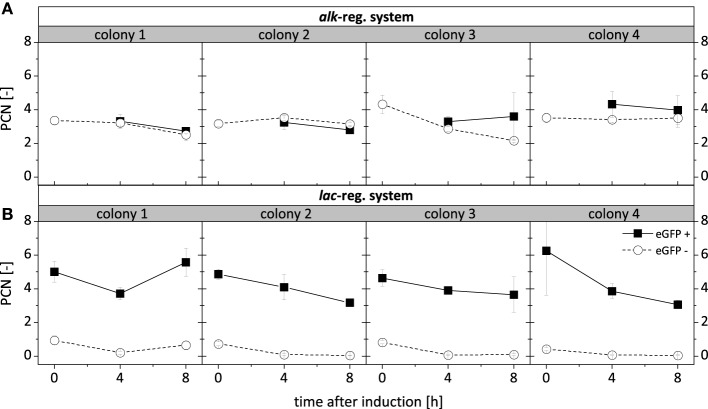
Pivotal challenges in industrial biotechnology are the identification and overcoming of cell-to-cell heterogeneity in microbial processes. While the development of subpopulations of isogenic cells in bioprocesses is well described (intra-population variability), a possible variability between genetically identical cultures growing under macroscopically identical conditions (clonal variability) is not. A high such clonal variability has been found for the recombinant expression of the styrene monooxygenase genes styAB from Pseudomonas taiwanensis VLB120 in solvent-tolerant Pseudomonas putida DOT-T1E using the alk-regulatory system from P. putida GPo1. In this study, the oxygenase subunit StyA fused to eGFP was used as readout tool to characterize the population structure in P. putida DOT-T1E regarding recombinant protein content. Flow cytometric analyses revealed that in individual cultures, at least two subpopulations with highly differing recombinant StyA-eGFP protein contents appeared (intra-population variability). Interestingly, subpopulation sizes varied from culture-to-culture correlating with the specific styrene epoxidation activity of cells derived from respective cultures (clonal variability). In addition, flow cytometric cell sorting coupled to plasmid copy number (PCN) determination revealed that detected clonal variations cannot be correlated to the PCN, but depend on the combination of the regulatory system and the host strain employed. This is, to the best of our knowledge, the first work reporting that intra-population variability (with differing protein contents in the presented case study) causes clonal variability of genetically identical cultures. Respective impacts on bioprocess reliability and performance and strategies to overcome respective reliability issues are discussed.
Keywords: Pseudomonas putida; alk-regulatory system; clonal variability; flow cytometry; fluorescent reporter; intra-population variability; phenotypic heterogeneity; plasmid copy number.
Figures
Similar articles
-
Making variability less variable: matching expression system and host for oxygenase-based biotransformations.J Ind Microbiol Biotechnol. 2015 Jun;42(6):851-66. doi: 10.1007/s10295-015-1615-8. Epub 2015 Apr 16. J Ind Microbiol Biotechnol. 2015. PMID: 25877162
-
Constitutively solvent-tolerant Pseudomonas taiwanensis VLB120∆ C∆ ttgV supports particularly high-styrene epoxidation activities when grown under glucose excess conditions.Biotechnol Bioeng. 2019 May;116(5):1089-1101. doi: 10.1002/bit.26924. Epub 2019 Feb 6. Biotechnol Bioeng. 2019. PMID: 30636283
-
Engineering of Pseudomonas taiwanensis VLB120 for constitutive solvent tolerance and increased specific styrene epoxidation activity.Appl Environ Microbiol. 2014 Oct;80(20):6539-48. doi: 10.1128/AEM.01940-14. Epub 2014 Aug 15. Appl Environ Microbiol. 2014. PMID: 25128338 Free PMC article.
-
Analysis of solvent tolerance in Pseudomonas putida DOT-T1E based on its genome sequence and a collection of mutants.FEBS Lett. 2012 Aug 31;586(18):2932-8. doi: 10.1016/j.febslet.2012.07.031. Epub 2012 Jul 20. FEBS Lett. 2012. PMID: 22819823 Review.
-
Mechanisms of solvent tolerance in gram-negative bacteria.Annu Rev Microbiol. 2002;56:743-68. doi: 10.1146/annurev.micro.56.012302.161038. Epub 2002 Jan 30. Annu Rev Microbiol. 2002. PMID: 12142492 Review.
Cited by
-
Microfluidic Single-Cell Analytics.Adv Biochem Eng Biotechnol. 2022;179:159-189. doi: 10.1007/10_2020_134. Adv Biochem Eng Biotechnol. 2022. PMID: 32737554
-
Copy number variability of expression plasmids determined by cell sorting and Droplet Digital PCR.Microb Cell Fact. 2016 Dec 19;15(1):211. doi: 10.1186/s12934-016-0610-8. Microb Cell Fact. 2016. PMID: 27993152 Free PMC article.
-
Characterization of Context-Dependent Effects on Synthetic Promoters.Front Bioeng Biotechnol. 2020 Jun 12;8:551. doi: 10.3389/fbioe.2020.00551. eCollection 2020. Front Bioeng Biotechnol. 2020. PMID: 32596224 Free PMC article.
-
Strategies found not to be suitable for stabilizing high steroid hydroxylation activities of CYP450 BM3-based whole-cell biocatalysts.PLoS One. 2024 Sep 6;19(9):e0309965. doi: 10.1371/journal.pone.0309965. eCollection 2024. PLoS One. 2024. PMID: 39240904 Free PMC article.
-
Reliable Genomic Integration Sites in Pseudomonas putida Identified by Two-Dimensional Transcriptome Analysis.ACS Synth Biol. 2024 Jul 19;13(7):2060-2072. doi: 10.1021/acssynbio.3c00747. Epub 2024 Jul 5. ACS Synth Biol. 2024. PMID: 38968167 Free PMC article.
References
LinkOut - more resources
Full Text Sources
Other Literature Sources