. 2015 Sep 29:6:496.
doi: 10.3389/fimmu.2015.00496. eCollection 2015.

Systemic Sclerosis Patients Present Alterations in the Expression of Molecules Involved in B-Cell Regulation

Affiliations

Systemic Sclerosis Patients Present Alterations in the Expression of Molecules Involved in B-Cell Regulation

Lilian Soto et al. Front Immunol. .

Abstract

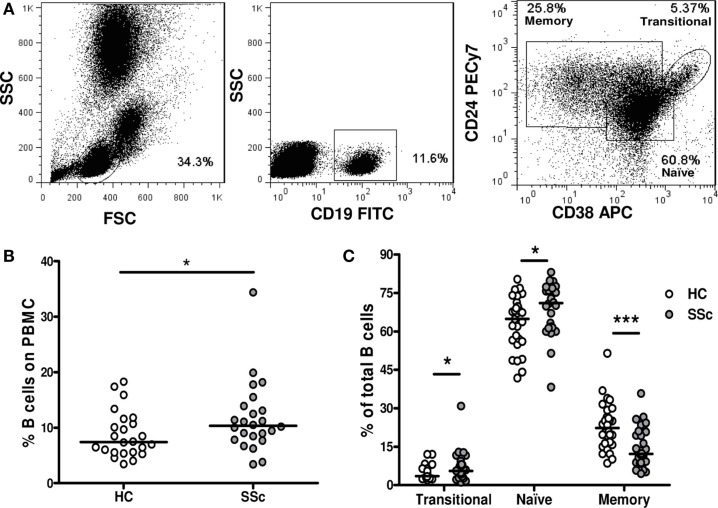
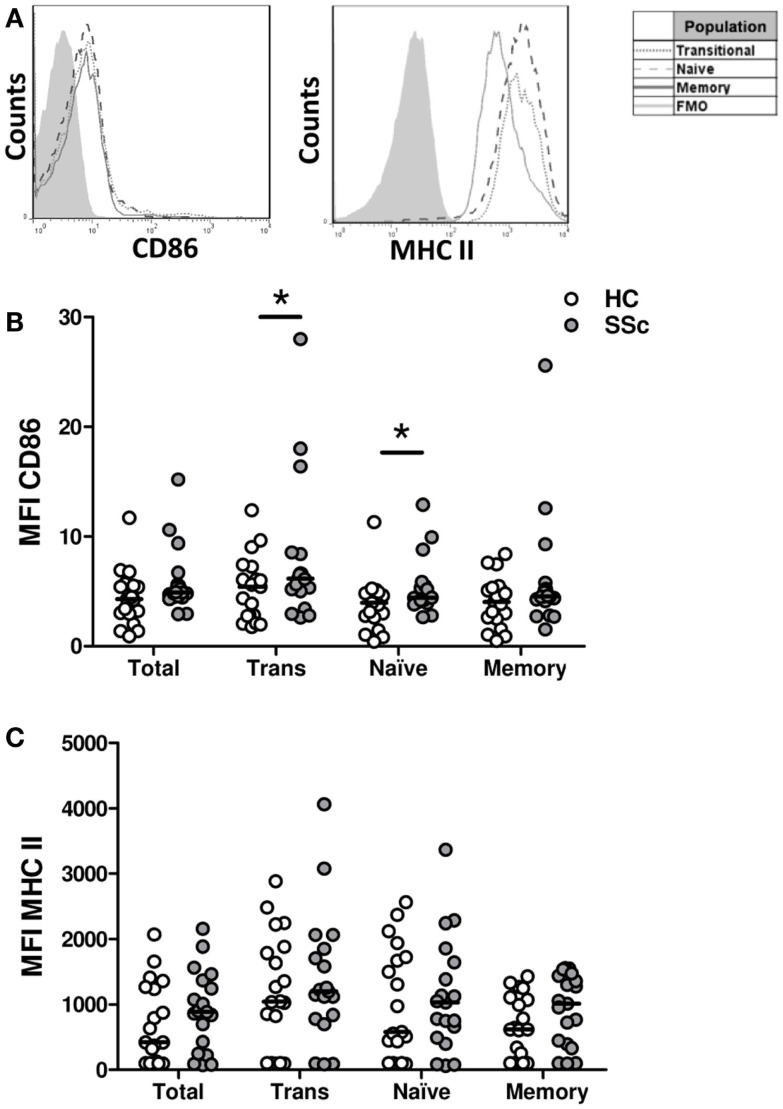
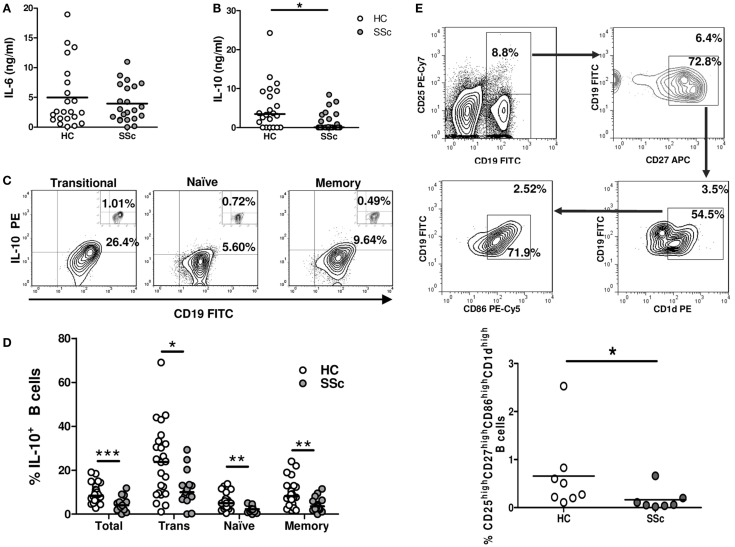
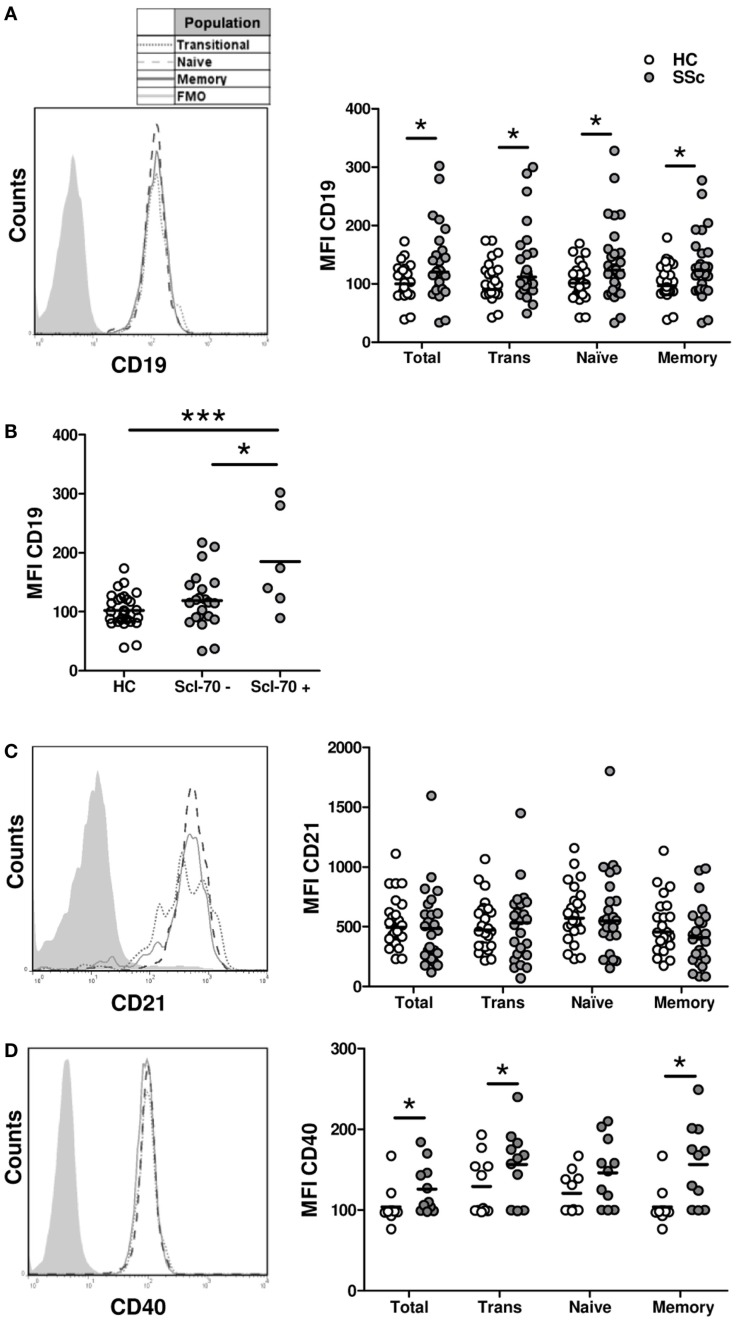
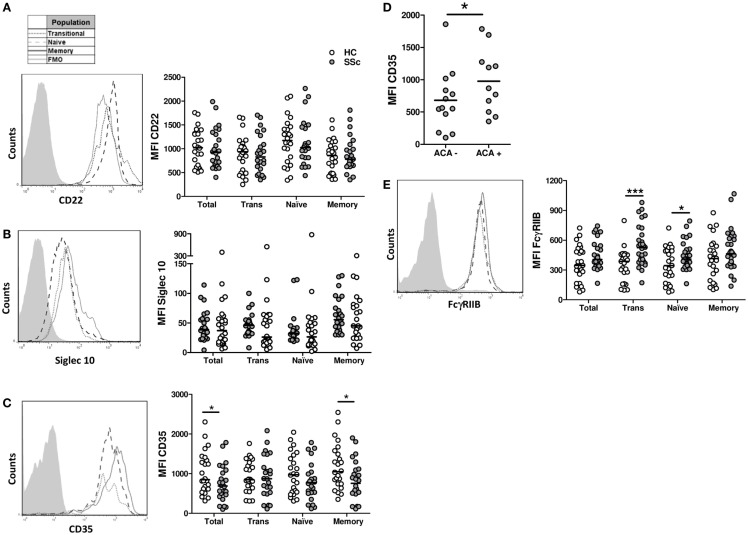
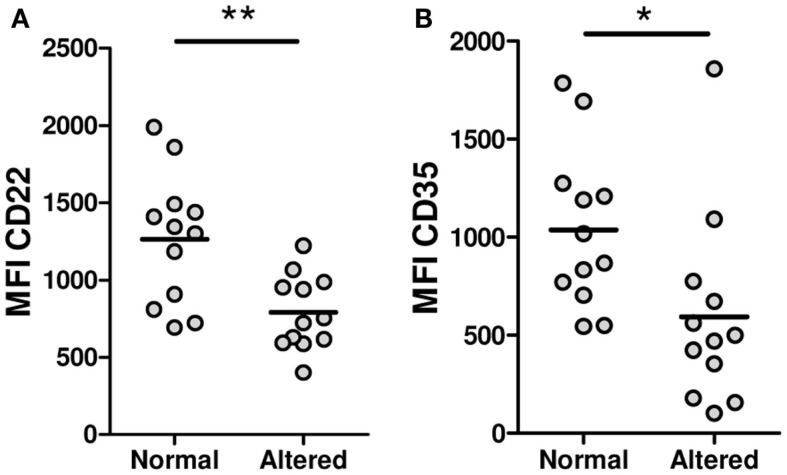
The activation threshold of B cells is tightly regulated by an array of inhibitory and activator receptors in such a way that disturbances in their expression can lead to the appearance of autoimmunity. The aim of this study was to evaluate the expression of activating and inhibitory molecules involved in the modulation of B cell functions in transitional, naive, and memory B-cell subpopulations from systemic sclerosis patients. To achieve this, blood samples were drawn from 31 systemic sclerosis patients and 53 healthy individuals. Surface expression of CD86, MHC II, CD19, CD21, CD40, CD22, Siglec 10, CD35, and FcγRIIB was determined by flow cytometry. IL-10 production was evaluated by intracellular flow cytometry from isolated B cells. Soluble IL-6 and IL-10 levels were measured by ELISA from supernatants of stimulated B cells. Systemic sclerosis patients exhibit an increased frequency of transitional and naive B cells related to memory B cells compared with healthy controls. Transitional and naive B cells from patients express higher levels of CD86 and FcγRIIB than healthy donors. Also, B cells from patients show high expression of CD19 and CD40, whereas memory cells from systemic sclerosis patients show reduced expression of CD35. CD19 and CD35 expression levels associate with different autoantibody profiles. IL-10(+) B cells and secreted levels of IL-10 were markedly reduced in patients. In conclusion, systemic sclerosis patients show alterations in the expression of molecules involved in B-cell regulation. These abnormalities may be determinant in the B-cell hyperactivation observed in systemic sclerosis.

Keywords: FcγRIIb; IL-10; Siglec; regulatory B cells; systemic sclerosis.


Figures

Figure 1
Figure 1
Frequencies of B-cell subpopulations in systemic sclerosis patients. (A) Flow cytometry gating strategy to identify transitional B cells (CD19+CD24highCD38high), naive B cells (CD19+CD24intCD38int), and memory B cells (CD19+CD24highCD38). (B) Percentage of CD19+ B cells within peripheral blood mononuclear cells (PBMC) in healthy controls (HC) (n = 24) and systemic sclerosis (SSc) patients (n = 24). (C) Percentage of transitional, naive, or memory B-cell subpopulations within total CD19+ B cells in HC (white circles) (n = 31) and SSc patients (gray circles) (n = 30). *P < 0.05, ***P < 0.001, Mann–Whitney U test.
Figure 2
Figure 2
Surface expression of CD86 and major histocompatibility class II (MHC II) molecules on B cells from systemic sclerosis patients. (A) Representative histograms of the expression of CD86 and MHC II on transitional (dotted line), naive (dashed line), or memory B cells (solid line). The shaded curve represents the fluorescence minus one (FMO) control staining. (B,C) Expression of CD86 (B) and MHC II (C) on total CD19+ B cells, transitional B cells (Trans), naive B cells and memory B cells in healthy controls (HC, white circles) (n = 19) and systemic sclerosis patients (SSc, gray circles) (n = 19). *P < 0.05, Wilcoxon signed-rank test. MFI, mean fluorescence intensity.
Figure 3
Figure 3
Reduced IL-10-expressing B-cell frequencies in systemic sclerosis patients. (A–D) Isolated B cells from healthy controls (HC) or systemic sclerosis patients (SSc) were stimulated for 5 h with PMA and ionomycin. IL-6 levels (A) and IL-10 levels (B) secreted by B cells from HC (n = 22) or SSc (n = 22) were determined by ELISA and compared with the Mann–Whitney U test. (C) Representative plots of the percentage of CD19+IL-10+ B cells within transitional (left), naive (middle), and memory (right) populations. The small inserts on each plot represent the background percentages, as determined by the fluorescence minus one (FMO) control staining. (D) Graph summarizing the percentages of CD19+IL-10+ cells among total, transitional (Trans), naive, and memory B cells in HC (white circles) (n = 24) and SSc (gray circles) (n = 15) groups. Statistic comparisons were made using the unpaired Student’s t-test. (E) Peripheral blood mononuclear cells from HC (n = 8) and SSc patients (n = 7) were stained and analyzed for the presence of CD25highCD27highCD86highCD1dhigh B cells and compared with the Mann–Whitney U test. The upper panel represents the gating strategy to identify the subpopulation. Numbers outside and inside the gates indicate the percentages of gated cells from the total or previously gated B cells, respectively. *P < 0.05, **P < 0.01, ***P < 0.001.
Figure 4
Figure 4
Expression of the activation molecules CD19 (A,B), CD21 (C), and CD40 (D) in B cells from systemic sclerosis patients (n= 29, 24, and 19, respectively) and healthy subjects (n= 28, 24, and 19, respectively). (A,C,D) Left: representative histograms of the expression of each molecule on transitional (dotted line), naive (dashed line), or memory B cells (solid line). The shaded curve represents the fluorescence minus one (FMO) control staining. Right: graphs summarizing the expression of each molecule on total CD19+ B cells, transitional B cells (Trans), naive B cells, and memory B cells in healthy controls (HC, white circles) and systemic sclerosis patients (SSc, gray circles). (B) Expression of CD19 in total B cells from HC and SSc patients classified according to the presence of anti-Scl-70 antibodies. *P < 0.05, **P < 0.01, ***P < 0.01. Mann–Whitney U test for graphs in (A,C), Wilcoxon signed-rank test for graphs in (D), and unpaired Student’s t-test for graph in (B). MFI, mean fluorescence intensity.
Figure 5
Figure 5
Expression of the inhibition receptors CD22 (A), Siglec 10 (B), CD35 (C,D), and FcγRIIB (E) in B cells from systemic sclerosis patients (n= 24, 24, 24, and 30, respectively) and healthy subjects (n= 24, 24, 24, and 25, respectively). (A–C,E) Left: representative histograms of the expression of each molecule on transitional (dotted line), naive (dashed line), or memory B cells (solid line). The shaded curve represents the fluorescence minus one (FMO) control staining. Right: graphs summarizing the expression of each molecule on total CD19+ B cells, transitional B cells (Trans), naive B cells, and memory B cells in healthy controls (HC, white circles) and systemic sclerosis patients (SSc, gray circles). (D) Expression of CD35 in SSc patients according to the presence of anticentromere antibodies (ACA). *P < 0.05, ***P < 0.001. Paired Student’s t-test for graphs in (A,C), Wilcoxon signed-rank test for graphs in (B), and unpaired Student’s t-test for graphs in (D,E). MFI, mean fluorescence intensity.
Figure 6
Figure 6
Expression levels of CD22 (A) and CD35 (B) on total B cells from systemic sclerosis patients with a peripheral vascular Modified Medsger scale value = 0 (normal) or 1 (altered). *P < 0.05, **P < 0.01, unpaired Student’s t-test. MFI, mean fluorescence intensity.

References

    1. Gabrielli A, Avvedimento EV, Krieg T. Scleroderma. N Engl J Med (2009) 360:1989–2003.10.1056/NEJMra0806188 - DOI - PubMed
    1. Varga J, Abraham D. Systemic sclerosis: a prototypic multisystem fibrotic disorder. J Clin Invest (2007) 117:557–67.10.1172/JCI31139 - DOI - PMC - PubMed
    1. Whitfield ML, Finlay DR, Murray JI, Troyanskaya OG, Chi JT, Pergamenschikov A, et al. Systemic and cell type-specific gene expression patterns in scleroderma skin. Proc Natl Acad Sci U S A (2003) 100:12319–24.10.1073/pnas.1635114100 - DOI - PMC - PubMed
    1. Muller J, Nitschke L. The role of CD22 and Siglec-G in B-cell tolerance and autoimmune disease. Nat Rev Rheumatol (2014) 10:422–8.10.1038/nrrheum.2014.54 - DOI - PubMed
    1. Smith KG, Clatworthy MR. FcgammaRIIB in autoimmunity and infection: evolutionary and therapeutic implications. Nat Rev Immunol (2010) 10:328–43.10.1038/nri2762 - DOI - PMC - PubMed