

Small molecule inhibition of FOXM1: How to bring a novel compound into genomic context
- PMID: 26484143
- PMCID: PMC4535965
- DOI: 10.1016/j.gdata.2014.10.012
Small molecule inhibition of FOXM1: How to bring a novel compound into genomic context
Abstract
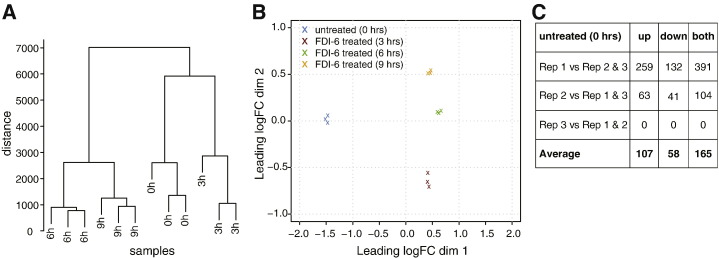
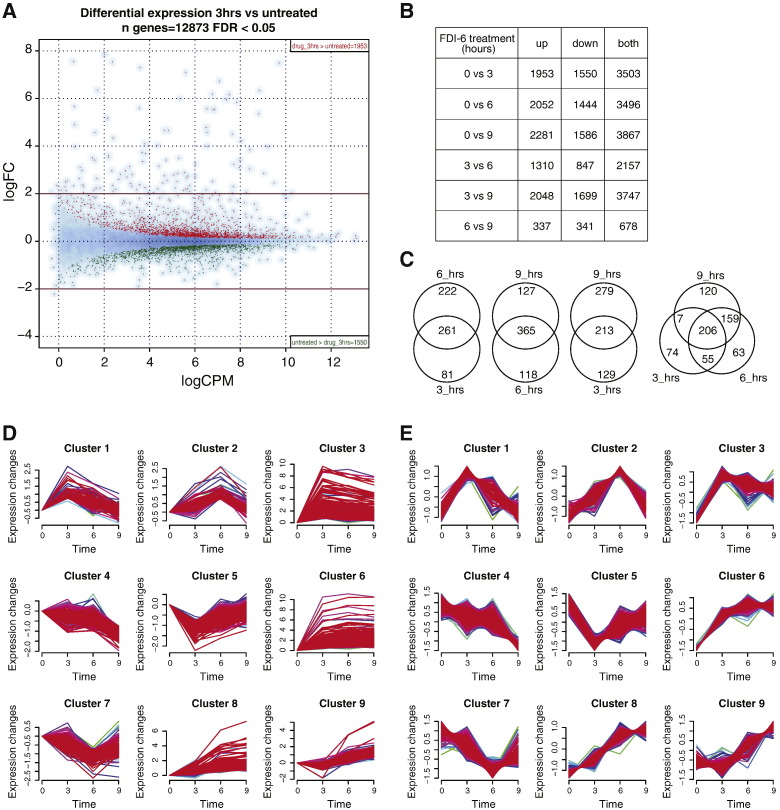
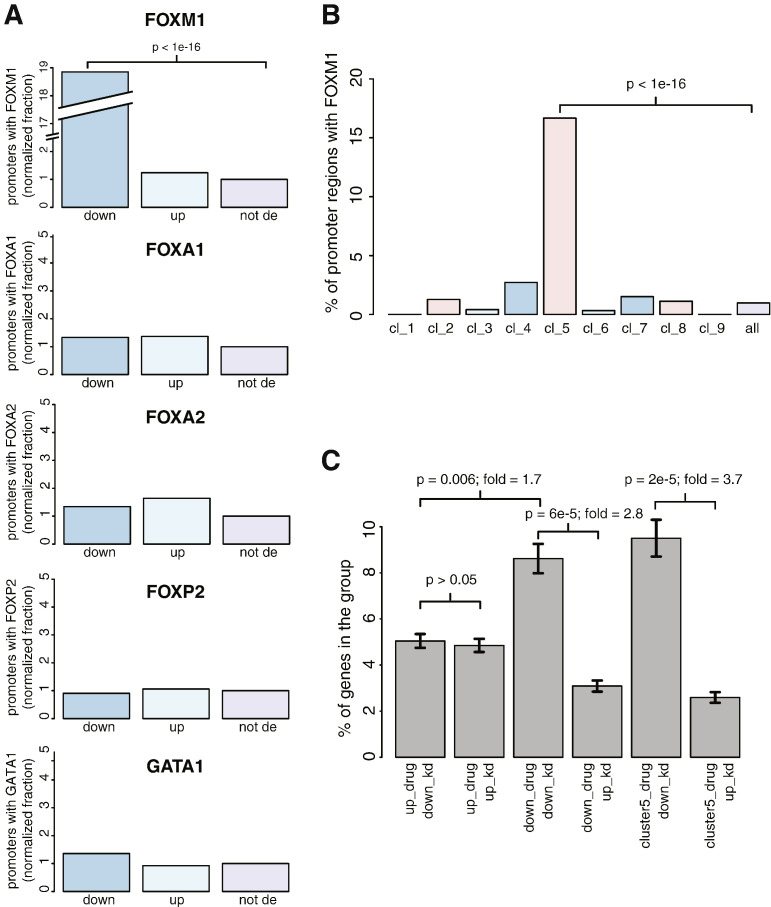
Deregulation of transcription factor (TF) networks is emerging as a major pathogenic event in many human cancers (Darnell, 2002 [1]; Libermann and Zerbini, 2006 [2]; Laoukili et al., 2007 [3]). Small molecule intervention is an attractive avenue to understand TF regulatory mechanisms in healthy and disease state, as well as for exploiting these targets therapeutically (Koehler et al., 2003 [4]; Berg, 2008 [5]; Koehler, 2010 [6]). However, because of their physico-chemical properties, TF targeting has been proven to be difficult (Verdine and Walensky, 2007 [7]). The TF FOXM1 is an important mitotic player (Wonsey and Follettie, 2005 [8]; Laoukili et al., 2005 [9]; McDonald, 2005 [10]) also implicated in cancer progression (Laoukili et al., 2007 [3]; Teh, 2011 [11]; Koo, 2012 [12]) and drug resistance development (Kwok et al., 2010 [13]; Carr et al., [14]). Therefore, its inhibition is an attractive goal for cancer therapy. Here, we describe a computational biology approach, by giving detailed insights into methodologies and technical results, which was used to analyze the transcriptional RNA-Seq data presented in our previous work (Gormally et al., 2014 [20]). Our Bioinformatics analysis shed light on the cellular effect of a novel FOXM1 inhibitor (FDI-6) newly identified through a biophysical screen. The data for this report is available at the public GEO repository (accession number http://www.ncbi.nlm.nih.gov/geo/query/acc.cgi?acc=GSE58626).
Keywords: FOXM1; Genomics; RNA-Seq; Small molecule inhibition; Transcription.
Figures
References
-
- Darnell J.E. Transcription factors as targets for cancer therapy. Nat. Rev. Cancer. 2002;2:740–749. - PubMed
-
- Libermann T.A., Zerbini L.F. Targeting transcription factors for cancer gene therapy. Curr. Gene Ther. 2006;6:17–33. - PubMed
-
- Laoukili J., Stahl M., Medema R.H. FoxM1: at the crossroads of ageing and cancer. Biochim. Biophys. Acta (BBA) - Mol. Basis Dis. 2007;1775:92–102. - PubMed
-
- Koehler A.N., Shamji A.F., Schreiber S.L. Discovery of an inhibitor of a transcription factor using small molecule microarrays and diversity-oriented synthesis. J. Am. Chem. Soc. 2003;125:8420–8421. - PubMed
-
- Berg T. Inhibition of transcription factors with small organic molecules. Curr. Opin. Chem. Biol. 2008;12:464–471. - PubMed
LinkOut - more resources
Full Text Sources
Other Literature Sources
Molecular Biology Databases
Miscellaneous
