. 2015 Mar 20:4:60-4.
doi: 10.1016/j.gdata.2015.03.004. eCollection 2015 Jun.

DNA microarray global gene expression analysis of influenza virus-infected chicken and duck cells

Affiliations

DNA microarray global gene expression analysis of influenza virus-infected chicken and duck cells

Suresh V Kuchipudi et al. Genom Data. .

Abstract

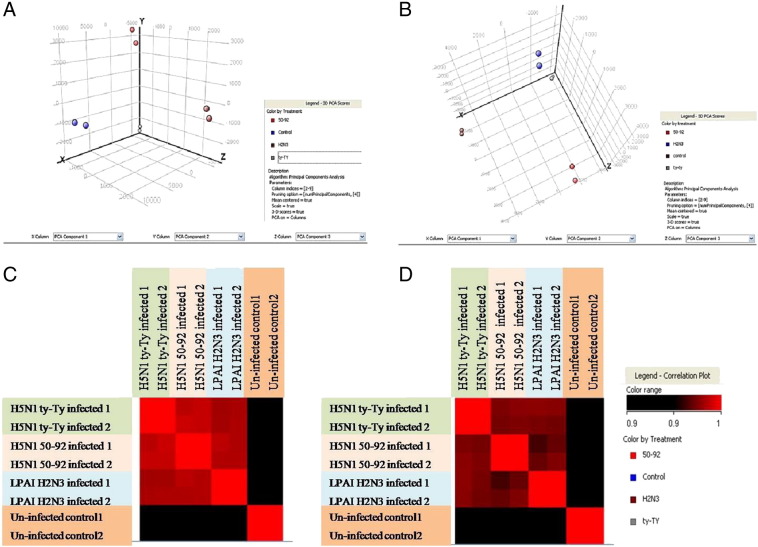
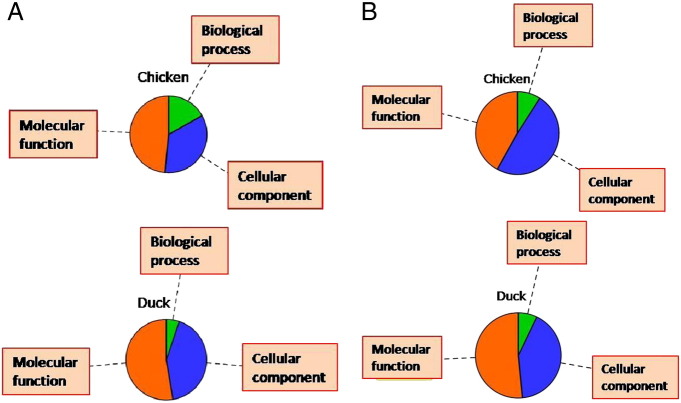
The data described in this article pertain to the article by Kuchipudi et al. (2014) titled "Highly Pathogenic Avian Influenza Virus Infection in Chickens But Not Ducks Is Associated with Elevated Host Immune and Pro-inflammatory Responses" [1]. While infection of chickens with highly pathogenic avian influenza (HPAI) H5N1 virus subtypes often leads to 100% mortality within 1 to 2 days, infection of ducks in contrast causes mild or no clinical signs. The rapid onset of fatal disease in chickens, but with no evidence of severe clinical symptoms in ducks, suggests underlying differences in their innate immune mechanisms. We used Chicken Genechip microarrays (Affymetrix) to analyse the gene expression profiles of primary chicken and duck lung cells infected with a low pathogenic avian influenza (LPAI) H2N3 virus and two HPAI H5N1 virus subtypes to understand the molecular basis of host susceptibility and resistance in chickens and ducks. Here, we described the experimental design, quality control and analysis that were performed on the data set. The data are publicly available through the Gene Expression Omnibus (GEO)database with accession number GSE33389, and the analysis and interpretation of these data are included in Kuchipudi et al. (2014) [1].

Keywords: Chicken; Cross-species hybridization of arrays; DNA microarray; Duck; Gene expression analysis; Influenza virus.


Figures

Fig. 1
Fig. 1
Quality control of arrays. Principal component analysis (PCA) plots showing arrays hybridized with chicken (A) and duck (B) virus- and mock-infected samples. Each point representing one array with replicate samples in each group represented by the same colour clustered together. Correlation analysis of chicken (C) and duck (D) samples showing high degree of correlation between each pair of arrays in infected and control groups (Pearson correlation coefficient values ranging from 0.98 to 1.0).
Fig. 2
Fig. 2
Genomic DNA (gDNA) based probe selection to improve the sensitivity of chicken Genechip for duck transcriptome analysis. (A) Anas platyrhynchos genomic DNA (gDNA) hybridization intensity thresholds used to generate the probe mask files is shown. Data were obtained by hybridizing duck gDNA on chicken Genechip. Number of Gallus gallus probe pairs and probe sets from the chicken GeneChip® array retained across a range of gDNA intensity threshold is shown. Probe pairs retained (data in blue) is scaled to the left hand y-axis, while number of probe sets retained (data in red) are scaled to the to the right-hand y-axis). Intensity threshold of 200 gave highest number of genes differentially regulated following 24 h of infection with influenza viruses (H2N3, 50–92 and ty-Ty) compared to mock-infected controls. (B) All the genes significantly differentially regulated (p < 0.05). (C) Genes regulated ± 2-fold following infection. (D) Genes significantly regulated ± 2-fold (p < 0.05).
Fig. 3
Fig. 3
Comparison of gene expression profiles of virus-infected and mock-infected samples showing differentially regulated genes after influenza virus infection in chicken (A) and duck (B) cells with a p value cut off of 0.05. In chicken cells, 48.74% transcripts were differentially regulated, whereas in duck cells, 23.36% of the transcripts were differentially regulated compared to control. Red circles represent all the entities (transcripts) on the array, and blue circles represent significantly (p < 0.05) differentially regulated genes derived by analysis of variance (ANOVA).
Fig. 4
Fig. 4
Gene ontology analysis of gene expression profiles of chicken and duck cells at 24 h post-infection with H5N1 50–92 virus (A) or H5N1 ty-Ty virus (B). Significantly differentially expressed genes (p < 0.05) with a fold change difference of ± 1.3 between virus- and mock-infected samples were categorized into three major gene ontology terms. Each coloured fraction of the Venn diagram represents the percentage of all the differentially regulated genes that fits into the particular ontology term.

References

    1. Kuchipudi S.V. Highly pathogenic avian influenza virus infection in chickens but not ducks is associated with elevated host immune and pro-inflammatory responses. Vet. Res. 2014;45:118. - PMC - PubMed
    1. Gibbs A.J., Armstrong J.S., Downie J.C. From where did the 2009 'swine-origin' influenza A virus (H1N1) emerge? Virol. J. 2009;6:207. - PMC - PubMed
    1. Thitithanyanont A. Antiviral immune responses in H5N1-infected human lung tissue and possible mechanisms underlying the hyperproduction of interferon-inducible protein IP-10. Biochem. Biophys. Res. Commun. 2010;398(4):752–758. - PMC - PubMed
    1. Katz J.M. The public health impact of avian influenza viruses. Poult. Sci. 2009;88(4):872–879. - PubMed
    1. Sharp G.B. Coinfection of wild ducks by influenza A viruses: distribution patterns and biological significance. J. Virol. 1997;71(8):6128–6135. - PMC - PubMed