. 2015 Oct 20;9(10):e0004139.
doi: 10.1371/journal.pntd.0004139. eCollection 2015.

Loss of Glycosaminoglycan Receptor Binding after Mosquito Cell Passage Reduces Chikungunya Virus Infectivity

Affiliations

Loss of Glycosaminoglycan Receptor Binding after Mosquito Cell Passage Reduces Chikungunya Virus Infectivity

Dhiraj Acharya et al. PLoS Negl Trop Dis. .

Abstract

Chikungunya virus (CHIKV) is a mosquito-transmitted alphavirus that can cause fever and chronic arthritis in humans. CHIKV that is generated in mosquito or mammalian cells differs in glycosylation patterns of viral proteins, which may affect its replication and virulence. Herein, we compare replication, pathogenicity, and receptor binding of CHIKV generated in Vero cells (mammal) or C6/36 cells (mosquito) through a single passage. We demonstrate that mosquito cell-derived CHIKV (CHIKV mos) has slower replication than mammalian cell-derived CHIKV (CHIKV vero), when tested in both human and murine cell lines. Consistent with this, CHIKV mos infection in both cell lines produce less cytopathic effects and reduced antiviral responses. In addition, infection in mice show that CHIKV mos produces a lower level of viremia and less severe footpad swelling when compared with CHIKV vero. Interestingly, CHIKV mos has impaired ability to bind to glycosaminoglycan (GAG) receptors on mammalian cells. However, sequencing analysis shows that this impairment is not due to a mutation in the CHIKV E2 gene, which encodes for the viral receptor binding protein. Moreover, CHIKV mos progenies can regain GAG receptor binding capability and can replicate similarly to CHIKV vero after a single passage in mammalian cells. Furthermore, CHIKV vero and CHIKV mos no longer differ in replication when N-glycosylation of viral proteins was inhibited by growing these viruses in the presence of tunicamycin. Collectively, these results suggest that N-glycosylation of viral proteins within mosquito cells can result in loss of GAG receptor binding capability of CHIKV and reduction of its infectivity in mammalian cells.


Conflict of interest statement

The authors have declared that no competing interests exist.

Figures
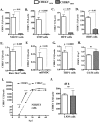
Fig 1
Fig 1. CHIKVmos has reduced infectivity than CHIKVvero.
(A-H) Indicated cells were infected with CHIKVvero or CHIKVmos (Ross strain, MOI = 1) for 24 h to measure gene expression of CHIKV E1 and cellular β-actin by RT-qPCR. (I) NIH3T3 cells were infected with CHIKVvero and CHIKVmos (Ross strain, MOI = 1) for 60 h and CHIKV E1 expression was measured at indicated time points by RT-qPCR. (J) L929 cells were infected with CHIKVvero or CHIKVmos (Ross strain, MOI = 1) for 48 h to measure gene expression of CHIKV E1 by RT-qPCR. Results were shown as the ratio (mean ± SEM) copy number of CHIKV E1 to cellular β-actin. Ribosomal protein 7 (rp7) was used as a housekeeping gene control for C6/36 cells. All data represent at least two independent experiments performed in triplicates with similar results. Replication between CHIKVvero and CHIKVmos were compared using student’s t test (**** denotes p < 0.0001, and ns denotes p ≥ 0.05).
Fig 2
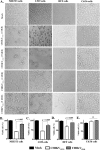
Fig 2. CHIKVmos induces minimal cytopathic effects than CHIKVvero.
NIH3T3, L929, HFF, and C6/36 cells were infected with CHIKVmos or CHIKVvero (Ross strain, MOI as indicated) for 48 h and fixed with 4% PFA after removing culture medium. (A) Phase contrast images (100X) were acquired using a Zeiss LSM510 META microscope. The cell viability data of NIH3T3 (B), L929 (C), HFF (D) and C6/36 (E) cells infected with CHIKVmos or CHIKVvero (Ross strain, MOI = 1) for 48 h are presented as the percentage of viable cell as determined by toluidine blue staining. The controls represent cells without viral infection (Mock). Error bars indicate mean ± SEM. Cell viability data represent two independent experiments performed in triplicates with similar results.
Fig 3
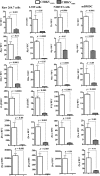
Fig 3. CHIKVmos induces lower antiviral responses than CHIKVvero.
Raw 264.7 cells, L929 cells, NIH3T3 cells, and mouse bone marrow derived dendritic cells (mBMDC) were infected with CHIKVvero or CHIKVmos (Ross strain, MOI = 1) for 24 h. Gene expressions of Tlr3, Rig-I, Mda-5, Il-1β, and type I IFNs (Ifn-α and Ifn-β) were analyzed by RT-qPCR. The gene copy numbers were normalized to cellular β-actin and the data are presented as relative fold changes in expression of respective gene compared to the mock-infected control designated as 1 (not indicated in figures). All data sets represents two independent experiments performed in triplicates with similar results.
Fig 4
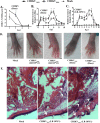
Fig 4. CHIKVmos produces lower levels of viremia and footpad swelling in mice.
Wild-type C57BL/6J mice were subcutaneously infected with 1 × 10⁵ PFUs of CHIKVvero, CHIKVmos or mock infected with PBS and monitored daily for 10 days. (A) Viral load in blood at day 1, 2, 4 and 6-post infection (d.p.i) with CHIKV (Ross strain) is presented as ratio of CHIKV E1 copy number per 1000 copy of cellular β-actin. Swelling of hind footpad (perimetatarsal area) of mice (n = 5/group) infected with CHIKV Ross (B) and LR-OPY1 (C) are presented as relative increase in swelling that were calculated by measuring height (thickness) and breadth (width) of inoculated footpad. (D) Representative image showing footpad swelling after infection with CHIKVmos or CHIKVvero at 6 d.p.i. (E) H&E stained histological images (100X) of foot tissue at 6 d.p.i displays subcutaneous necrosis (arrow) and infiltrated leukocytes (arrowhead). CHIKVvero and CHIKVmos data were compared using student’s t test (** denotes p < 0.005, * denotes p < 0.05, and ns denotes p ≥ 0.05).
Fig 5
Fig 5. CHIKVmos has reduced attachment to host cells than CHIKVvero.
(A), Equal PFUs of CHIKVvero or CHIKVmos (Ross strain) were added to Vero cells (left), NIH3T3 cells (middle) and L929 cells (right) for plaque development. (B), Plaque counts of CHIKVvero and CHIKVmos in the indicated cells were quantified. (C) L929, NIH3T3 and HFF cells were inoculated with CHIKVvero or CHIKVmos (Ross strain, MOI = 1) at 4°C for 1 h and attached viruses were quantified by RT-qPCR and presented as the ratio of CHIKV E1 copy number per 1000 copy of cellular β-actin. (D) L929, NIH3T3 and HFF cells were inoculated with CHIKVvero or CHIKVmos (LR OPY1, MOI = 1) at 4°C for 1 h and viruses attached to cells were quantified by RT-qPCR. (E) NIH3T3 cells were infected with CHIKVvero or CHIKVmos (Ross strain, MOI = 2.5) at 4°C for 45 min and the virus-bound cells were quantified by flow cytometry. (F) CHIKVvero or CHIKVmos (100 PFUs) were added to monolayer of L929 cells at 4°C for 1 h and both attached and unattached viruses were quantified by plaque assay to calculate percentage attachment. (G) CHIKVvero or CHIKVmos (Ross strain, 100 PFUs) were added to the L929 cell monolayer at 4°C for 1 h. After removing unattached virus, cells were replaced with fresh medium (control), or treated with acidic medium (pH 5.5) for 2 minutes before adding fresh medium, or replaced with NH4Cl (20 mM) containing media. Viruses that entered into cells were analyzed by allowing plaque development for 48 h and normalized to controls. (H) Viral RNA copies in L929 cells infected with CHIKVvero or CHIKVmos (Ross strain, MOI = 1) with or without NH4Cl (20 mM) were measured by RT-qPCR at 24 h.p.i. Data represent at least two independent experiments performed in triplicates with the similar results. ND denotes not detected, and ns denotes not significant (p ≥ 0.05).
Fig 6
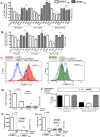
Fig 6. CHIKVvero, but not CHIKVmos, binds to cell surface glycosaminoglycan receptors.
(A) Equal PFUs of CHIKVvero or CHIKVmos (Ross strain) were pre-incubated with the indicated soluble GAGs at 37°C for 1 h. The virus-GAG complexes were added to NIH3T3 cell monolayer (MOI = 1) and incubated at 4°C for 1 h and the GAGs neutralization of viral attachment was measured by RT-qPCR. Data were normalized to controls without GAG treatment. (B) Equal PFUs of CHIKVvero or CHIKVmos (Ross strain) were pre-incubated at 37°C for 1 h with indicated GAGs and added to NIH3T3 cells (MOI = 2.5) at 4°C for 45 min. The virus-bound cells were quantified by flow cytometry and the representative histograms are shown in (C). (D) Heparin (500U/ml) neutralization of CHIKVvero and CHIKVmos (LR-OPY1 strain) attachment was performed in NIH3T3 cells and measured by RT-qPCR. (E) CHIKVvero, CHIKVmos or their parental stock (105 PFU, Ross strain) were mixed with heparin-conjugated sepharose beads or unconjugated sepharose beads (control) at 4°C for 45 min and unbound viruses recovered from beads were quantified by plaque assay in Vero cells (shown in bottom). Input viruses without beads (control) were also quantified by a plaque assay and viruses recovered from the beads were expressed as percentage of the input. Viruses bound to the respective heparin-conjugated and control beads were lysed and also analyzed by immunoblotting assays (shown in top). The effect of heparin pre-treatment (1000 U/ml) on CHIKVvero and CHIKVmos (Ross strain) replication was measured in NIH3T3 (F) and HFF (G) cells at 24 h by RT-qPCR. GAG treated samples were normalized to their respective controls and analyzed using a one-way ANOVA (**** denotes p < 0.0001, *** denotes p < 0.0005, ** denotes p < 0.005, * denotes p < 0.05, and ns denotes p ≥ 0.05). DS, dermatan sulfate; CSA, chondroitin sulfate A.
Fig 7
Fig 7. CHIKVmos infectivity can be enhanced after replication in mammalian cells.
The viral stocks of CHIKVvero-NIH3T3 and CHIKVmos-NIH3T3 were prepared after CHIKVvero or CHIKVmos (Ross strain, MOI = 1) replicated in NIH3T3 for 48 h. (A) NIH3T3 and HFF cells (B) were infected with CHIKVvero, CHIKVmos, CHIKVvero-NIH3T3 and CHIKVmos-NIH3T3 (MOI = 1), and viral RNA copy numbers were measured at 24 h by RT-qPCR. Data represents ratio of copy number of CHIKV E1 to β-actin. (C) NIH3T3 cells were infected with CHIKVvero-L929 and CHIKVmos-L929 (MOI = 1), and viral RNA copy numbers were measured by RT-qPCR at 24 h. (D) NIH3T3 cells were infected with CHIKVvero-VERO and CHIKVmos-VERO (MOI = 1), and viral RNA copy numbers were measured at 24 h by RT-qPCR. (E) Attachment of CHIKVvero-NIH and CHIKVmos-NIH (MOI = 1) were performed in NIH3T3 cells at 4°C for 1 h and attached viruses were measured by RT-qPCR. (F) GAGs neutralization of CHIKVvero-NIH3T3 and CHIKVmos-NIH3T3 attachment was performed with heparin (1000 U/mL), chondroitin sulfate A (CSA, 1000 μg/mL) and dermatan sulfate (DS, 1000 μg/mL) in NIH3T3 cells, and the attached viruses were quantified by RT-qPCR and normalized to the respective untreated controls. All data sets represent two independent experiments performed in triplicates. GAG-treated samples were compared to the respective controls (without GAGs) and analyzed using a one-way ANOVA (**** denotes p < 0.0001, *** denotes p < 0.0005, ** denotes p < 0.005, and ns denotes p ≥ 0.05).
Fig 8
Fig 8. Mosquito cell-specific glycosylation reduces CHIKV infectivity.
(A) SDS-PAGE image for CHIKVvero and CHIKVmos proteins that were treated with PNGase F to remove N-glycans from viral glycoproteins. (B-E) Vero cells or C6/36 cells were infected for 20 h with parental stocks of CHIKV (Ross) in the presence of tunicamycin (TM, 0.1 μg/ml), or with dimethyl sulfoxide (DMSO) as vehicle controls to measure infectious virus particles released in culture media by plaque-forming assay (B and C) and the viral genome copies in the culture media by RT-qPCR (D and E). NIH3T3 cells were infected with 0.1 MOI of CHIKVvero-DMSO and CHIKVmos-DMSO (F), or CHIKVvero-TM and CHIKVmos-TM (G), and viral replication was measured at 24 h by RT-qPCR. (H) GAGs neutralization of CHIKVvero-TM and CHIKVmos-TM binding was performed with chondroitin sulfate A (CSA, 500 μg/mL) and dermatan sulfate (DS, 500 μg/mL) in NIH3T3 cells, and the attached viruses were quantified by RT-qPCR. A two-tailed student’s t-test was used for statistical analysis. Error bars indicate mean ± SEM. ns denotes not significant (p ≥ 0.05).

Similar articles

Cited by

References

    1. Lee VJ, Chow A, Zheng X, Carrasco LR, Cook AR, et al. (2012) Simple clinical and laboratory predictors of Chikungunya versus dengue infections in adults. PLoS Negl Trop Dis 6: e1786 10.1371/journal.pntd.0001786 - DOI - PMC - PubMed
    1. Schilte C, Staikowsky F, Couderc T, Madec Y, Carpentier F, et al. (2013) Chikungunya virus-associated long-term arthralgia: a 36-month prospective longitudinal study. PLoS Negl Trop Dis 7: e2137 10.1371/journal.pntd.0002137 - DOI - PMC - PubMed
    1. Gauri LA, Ranwa BL, Nagar K, Vyas A, Fatima Q (2012) Post chikungunya brain stem encephalitis. J Assoc Physicians India 60: 68–70. - PubMed
    1. Tandale BV, Sathe PS, Arankalle VA, Wadia RS, Kulkarni R, et al. (2009) Systemic involvements and fatalities during Chikungunya epidemic in India, 2006. J Clin Virol 46: 145–149. 10.1016/j.jcv.2009.06.027 - DOI - PubMed
    1. Pellot AS, Alessandri JL, Robin S, Samperiz S, Attali T, et al. (2012) [Severe forms of chikungunya virus infection in a pediatric intensive care unit on Reunion Island]. Med Trop (Mars) 72 Spec No: 88–93. - PubMed

Publication types