. 2015 Oct 20;11(10):e1005224.
doi: 10.1371/journal.ppat.1005224. eCollection 2015 Oct.

PD-L1 Expression on Retrovirus-Infected Cells Mediates Immune Escape from CD8+ T Cell Killing

Affiliations

PD-L1 Expression on Retrovirus-Infected Cells Mediates Immune Escape from CD8+ T Cell Killing

Ilseyar Akhmetzyanova et al. PLoS Pathog. .

Erratum in

Abstract

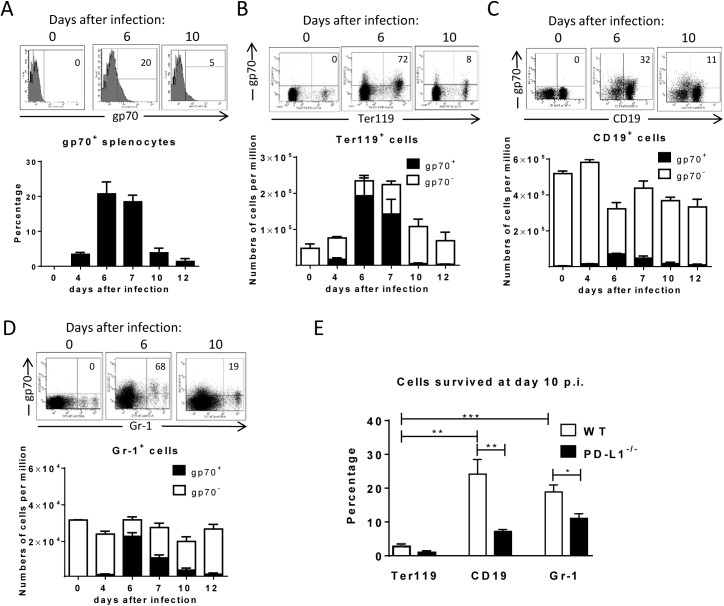
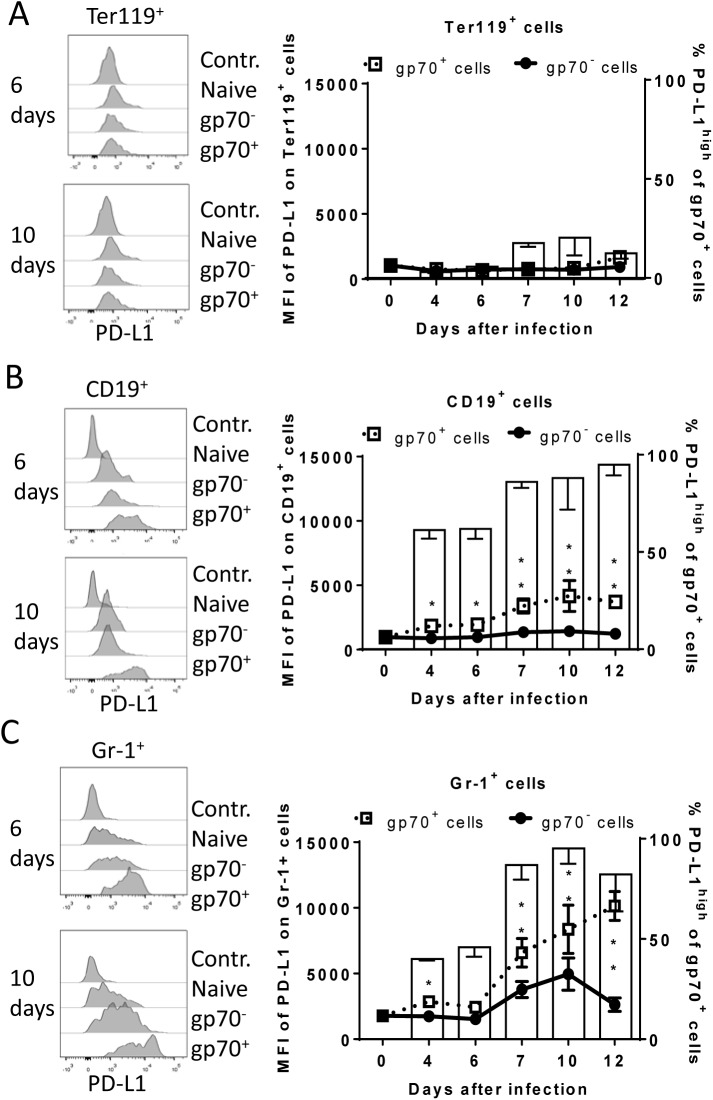
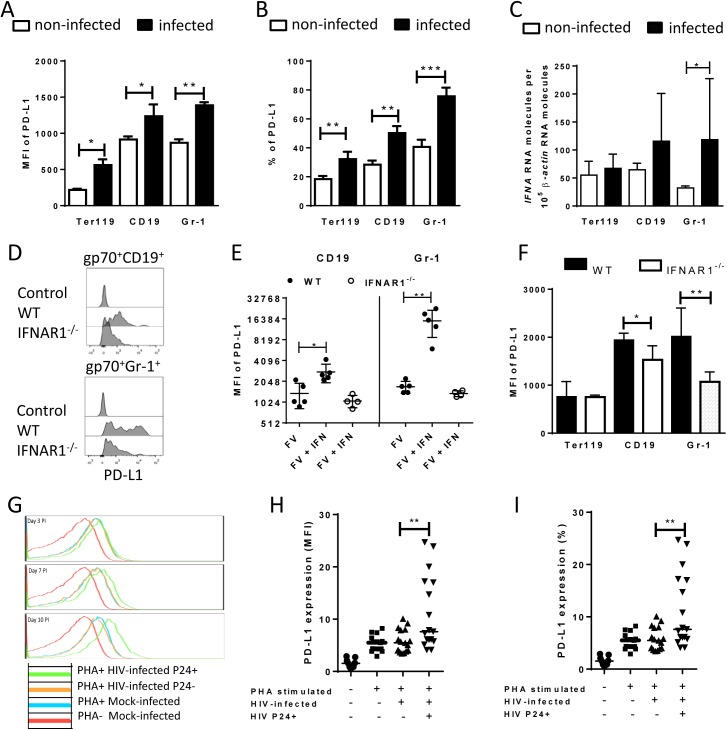
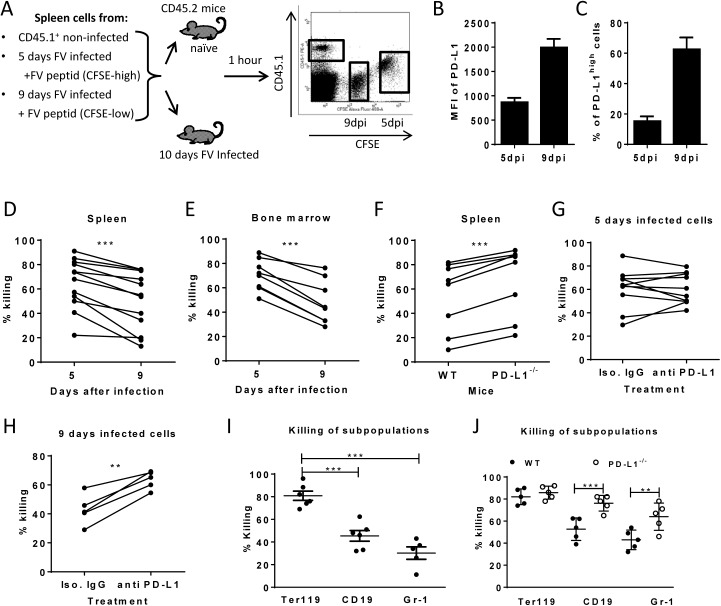
Cytotoxic CD8+ T Lymphocytes (CTL) efficiently control acute virus infections but can become exhausted when a chronic infection develops. Signaling of the inhibitory receptor PD-1 is an important mechanism for the development of virus-specific CD8+ T cell dysfunction. However, it has recently been shown that during the initial phase of infection virus-specific CD8+ T cells express high levels of PD-1, but are fully competent in producing cytokines and killing virus-infected target cells. To better understand the role of the PD-1 signaling pathway in CD8+ T cell cytotoxicity during acute viral infections we analyzed the expression of the ligand on retrovirus-infected cells targeted by CTLs. We observed increased levels of PD-L1 expression after infection of cells with the murine Friend retrovirus (FV) or with HIV. In FV infected mice, virus-specific CTLs efficiently eliminated infected target cells that expressed low levels of PD-L1 or that were deficient for PD-L1 but the population of PD-L1high cells escaped elimination and formed a reservoir for chronic FV replication. Infected cells with high PD-L1 expression mediated a negative feedback on CD8+ T cells and inhibited their expansion and cytotoxic functions. These findings provide evidence for a novel immune escape mechanism during acute retroviral infection based on PD-L1 expression levels on virus infected target cells.


Conflict of interest statement

The authors have declared that no competing interests exist.

Figures

Fig 1
Fig 1. Target cell populations of FV infection.
C57BL/6 mice were infected with FV and splenocytes were isolated at different time points after infection. Multi-parameter flow cytometry analysis was used to compare the expression of FV gp70 antigen on the cell surface of different subpopulations of spleen cells. A. representative histograms of all nucleated cells positive for gp70 from naïve, 6 day and 10 day infected mice. The bars represent percentages of all nucleated spleen cells positive for gp70 for a group of 6–10 mice. B. The representative dot plots of Ter119+ cells positive for gp70 from naïve, 6 day and 10 day infected mice. Numbers in the upper right quadrat represent the percentage of gp70+ of Ter119+ cells. The bars represent the number of non-infected Ter119+ erythroblasts (gp70 negative) per one million nucleated cells (white columns) and the number of infected Ter119+gp70+ cells (black columns). C. The representative dot plot of CD19+ cells positives for gp70 from naive, 6 day and 10 day infected mice. Numbers in the upper right quadrat represent the percentage of gp70+ of CD19+ cells. The bars represents the number of non-infected CD19+ B cells (gp70 negative) per one million nucleated cells (white columns) and the number of infected CD19+gp70+ cells (black columns). D. The representative dot plot of Gr-1+ cells positives for gp70 from naive, 6 day and 10 day infected mice. Numbers in the upper right quadrat represent the percentage of gp70+ of Gr-1+ cells. The bars represents the number of non-infected myeloid Gr-1+ cells (white column) and the number of infected Gr-1+ gp70+ cells (black columns). E. The frequency of gp70+ cells at day 10 post infection in relation to the infected cells at day 6 from C57BL/6 (wt) (white bars) and PD-L1-/- (black bars) mice. Mean numbers plus SD from experiments with 5–8 mice are shown. Data was pooled from three independent experiments with similar results. Differences between frequencies of infected (gp70+) cells from different populations were analyzed by an unpaired t-test and are indicated in the figure (**p˂0.005, ***p˂0.0005).
Fig 2
Fig 2. Expression of PD-L1 on the surface of FV infected cells.
C57BL/6 mice were infected with FV and the splenocytes were isolated at different time points after infection. Multi-parameter flow cytometry was used to compare the expression (MFI) of PD-L1 on the cell surface of infected (gp70+) and non-infected (gp70-) Ter119+ erythroid precursor cells (A), CD19+ B cells (B), and Gr-1+ myeloid derived cells (C) and the percentage of PD-L1high (white bars) of gp70+ cells. Data were pooled from three independent experiments with similar results. Representative histograms of PD-L1 expression on infected (gp70+) and non-infected (gp70-) cells gated on every analyzed cell population on day 6 and day10 in infected mice are shown. Mean numbers plus SD from experiments with 5–8 mice are shown. Data was pooled from three independent experiments with similar results. Differences between infected (gp70+) and non-infected (gp70-) cells were analyzed by an unpaired t-test and are indicated in the figure (*p˂0.05, **p˂0.005, ***p˂0.0005).
Fig 3
Fig 3. PD-L1 expression on cells infected in vitro with FV or HIV.
Spleen cells were isolated from naive B6 mice and cultivated with F-MuLV infected Mus Dunni cells to infect mouse cells in vitro. Multi-parameter flow cytometry was used to determine PD-L1 expression (MFI) (A) and the percentage of PD-L1high cells (B) in different target cell populations of FV. C. Ter119+, CD19+, and Gr-1+ cells were isolated from naïve wild type mice and were infected with F-MuLV in vitro. mRNA from infected and non-infected cells was isolated for real time PCR quantification of the IFNα mRNA expression. The numbers of IFNα mRNA copies in relation to 105 copies of mRNA for β-actin is shown. Data was pooled from at least two independent experiments with similar results. Spleen cells were isolated from naїve wild type mice or from naïve IFNAR1-/- mice and cultivated with F-MuLV infected Mus Dunni cells to infect mouse cells in vitro. Multi-parameter flow cytometry was used to determine PD-L1 expression (MFI) on infected CD19+ and Gr-1+ cells (D) and in the presence of IFNα (E) Data was pooled from at least two independent experiments with similar results. F. Multi-parameter flow cytometry was used to determine the expression of PD-L1 on the sur-face of gp70+Ter119+, gp70+CD19+, and gp70+Gr-1+ cells isolated from spleens of 6 day FV infected WT and IFNAR1-/- mice. Data was pooled from two independent experiments with similar results. Multi-parameter flow cytometry was used to determine the expression of PD-L1 on the surface of human CD4+ T cells after HIV-1 infection. Representative histograms of PD-L1 expression on human CD4+ T cells non-stimulated and non-infected, stimulated in vitro with PHA and infected with HIV-1 or cells only stimulated with PHA are shown. The data is shown for day three, seven and ten after infection (G). Expression of PD-L1 on human CD4+ T cells (H) and the percentage of PD-L1high CD4+ T cells (I) in populations of non-stimulated and non-infected, stimulated in vitro with PHA and infected with HIV-1 or cells only stimulated with PHA are shown at day ten after infection. Mean numbers plus SD from three independent experiments with similar results was shown. Differences between FV infected (gp70+) and FV non-infected (gp70-) mice cells were analyzed by an unpaired t-test. Differences between HIV infected (p24+) and HIV non-infected (p24-) CD4+ cells were analyzed by Mann-Whitney t test. Statistically significant differences between the groups are indicated in the figure (*p˂0.05, **p˂0.005).
Fig 4
Fig 4. Cytotoxic activity of CTL against target cells expressing different levels of PD-L1.
A. Splenocytes from FV infected mice were isolated at day 5 (PD-L1low) and day 9 (PD-L1high) post infection and used as target cells for an in vivo CTL assay. Therefore the cells were loaded with peptide and stained with different concentrations of CFSE. Spleen cells from naïve CD45-1 mice were used as control. Multi-parameter flow cytometry was used to compare the elimination of 5 day FV infected cells with cells from 9 day infected mice. MFI of PD-L1 expression (B) and percentage of cells expressing high level of PD-L1 (C) on surface of spleen cells isolated from 5 day and from 9 day FV infected mice. In vivo killing of target cells from 5 day and from 9 day infected mice in the spleens (D) and in the bone marrow (E) of 10 day FV infected mice. The data points received from the same recipient mouse were connected. F. In vivo killing of target cells from 9 day infected WT B6 and PD-L1 KO mice in the spleens of 10 day FV infected mice. The data points received from the same recipient mouse were connected. In vivo killing of target cells from 5 day (G) or cells from 9 day (H) FV infected B6 mice that were treated or non-treated in vitro with anti PD-L1 antibody before adoptive transfer into 10 day FV infected mice. The data points received from the same recipient mouse were connected. I. Elimination of Ter119+, CD19+ cells, and Gr-1+ cells transferred from 7 day infected mice in 10 day FV infected mice. (J). The elimination of target cells transferred from 9 day infected wild type and PD-L1-/- mice in in FV infected recipients. Data was pooled from two to three independent experiments with similar results. Differences the elimination of target cell populations (D-H) was analyzed by paired t test. Differences elimination of subpopulations of target cells from 7 day infected mice (I, J) were analyzed by one-way ANOVA was used with a Tukey post-test. Statistically significant differences between the groups are indicated in the figure. (*p˂0.05, **p˂0.005, ***p˂0.0005).
Fig 5
Fig 5. Expression of PD-L1 on FV infected cells from CD8+ T cells depleted mice.
C57BL/6 mice were infected with FV and treated with anti-mouse CD8 antibody. The spleen cells were isolated at day 10 after infection. Multi-parameter flow cytometry was used to compare the expression of PD-L1 on the cell surface of CD19+ cells (A) and Gr-1+ cells (C) and the percentage of infected (gp70+) CD19+ (B) and Gr-1+ (D) cells expressing high levels of PD-L1. Data was pooled from three independent experiments with similar results. Differences in PD-L1 expression on CD19+ cells or Gr-1+ cells from naïve mice and gp70+ CD19+ cells or gp70+ Gr-1+ cells from mice FV infected and FV infected and CD8+ T cells depleted mice were analyzed by one-way ANOVA was used with a Tukey post-test. Statistically significant differences between the groups are indicated in the figure (*p˂0.05, **p˂0.005, ***p˂0.0005).
Fig 6
Fig 6. Suppression of CD8+ T cell function by PD-L1 expressing target cells.
C57BL/6 and PD-L1-/- mice were infected with FV. Multi-parameter flow cytometry was used to compare the populations of FV gag tetramer positive CD8+ T cells at 8 days after infection. A. Representative dot plots gated on CD3+CD8+ T cells. Tetramer+ cells were stained for granzyme B expression. B. The percentage of CD8+Tetramer+Granzyme B+ cells per one million nucleated spleen cells is shown. C. The numbers of infectious cells in the spleens of 10 day infected wild type and PD-L1-/- mice. D. C57BL/6 mice were infected with FV and treated with anti PD-L1 antibody or with mice IgG as a control group. Spleen cells were isolated at day ten after infection. The number of CD8+CD43+GzmB+ cells per one million nucleated cells was determined by flow cytometry. E. Naïve CD8+ T cells from FV-specific TCR transgenic mice were stimulated with FV peptide loaded DCs and incubated with different numbers of B cells from naive, 5 day infected or 9 day infected mice. The production of granzyme B in CD8+ T cells was analyzed after 48h of co-incubation. Data was pooled from three independent experiments with similar results. Differences were analyzed by paired t-test. Statistically significant differences between the groups are indicated in the figure (**p˂0.005, ***p˂0.0005).

Similar articles

Cited by

References

    1. Kantzanou M, Lucas M, Barnes E, Komatsu H, Dusheiko G, Ward S, et al. Viral escape and T cell exhaustion in hepatitis C virus infection analysed using Class I peptide tetramers. Immunol Lett. 2003;85(2):165–71. Epub 2003/01/16. doi: S0165247802002249 [pii]. . - PubMed
    1. Pantaleo G, Soudeyns H, Demarest JF, Vaccarezza M, Graziosi C, Paolucci S, et al. Evidence for rapid disappearance of initially expanded HIV-specific CD8+ T cell clones during primary HIV infection. Proc Natl Acad Sci U S A. 1997;94(18):9848–53. Epub 1997/09/02. - PMC - PubMed
    1. Barber DL, Wherry EJ, Masopust D, Zhu B, Allison JP, Sharpe AH, et al. Restoring function in exhausted CD8 T cells during chronic viral infection. Nature. 2006;439(7077):682–7. Epub 2005/12/31. doi: nature04444 [pii] 10.1038/nature04444 . - DOI - PubMed
    1. Golden-Mason L, Palmer B, Klarquist J, Mengshol JA, Castelblanco N, Rosen HR. Upregulation of PD-1 expression on circulating and intrahepatic hepatitis C virus-specific CD8+ T cells associated with reversible immune dysfunction. J Virol. 2007;81(17):9249–58. Epub 2007/06/15. doi: JVI.00409-07 [pii] 10.1128/JVI.00409-07 - DOI - PMC - PubMed
    1. Radziewicz H, Ibegbu CC, Fernandez ML, Workowski KA, Obideen K, Wehbi M, et al. Liver-infiltrating lymphocytes in chronic human hepatitis C virus infection display an exhausted phenotype with high levels of PD-1 and low levels of CD127 expression. Journal of Virology. 2007;81(6):2545–53. 10.1128/Jvi.02021-06 . - DOI - PMC - PubMed

Publication types

MeSH terms

Substances