Review
. 2017 Mar;30(3):e3426.
doi: 10.1002/nbm.3426. Epub 2015 Oct 20.

Diffusion MRI in the heart

Affiliations
Review

Diffusion MRI in the heart

Choukri Mekkaoui et al. NMR Biomed. 2017 Mar.

Abstract

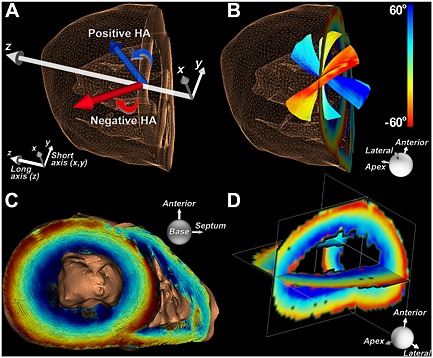
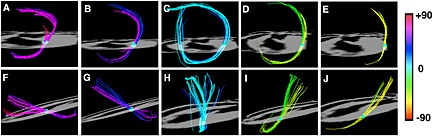
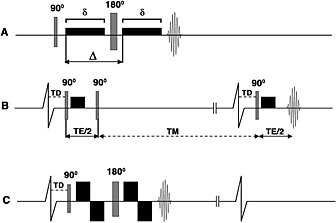
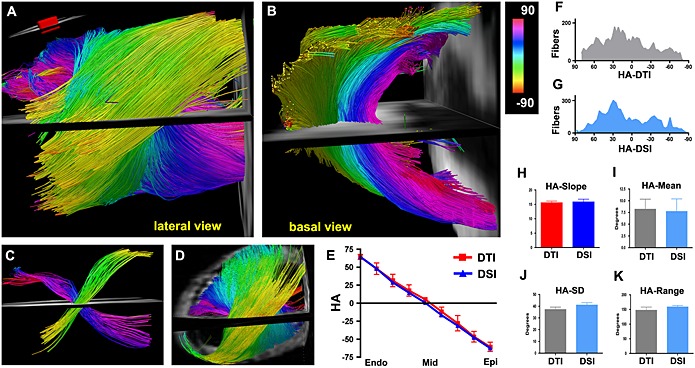
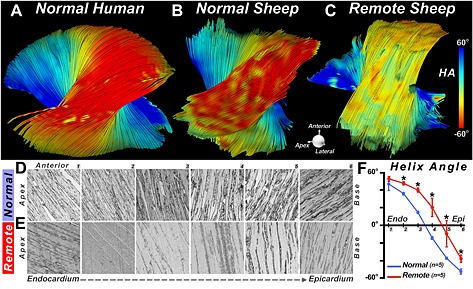
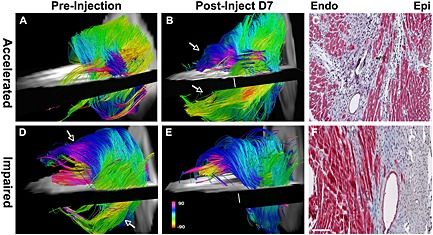
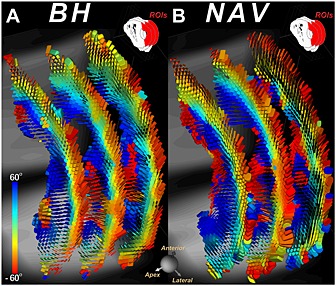
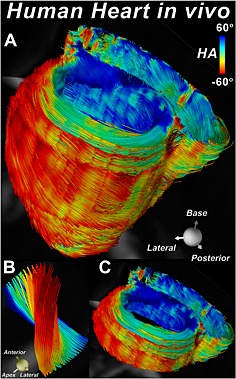
Diffusion MRI provides unique information on the structure, organization, and integrity of the myocardium without the need for exogenous contrast agents. Diffusion MRI in the heart, however, has proven technically challenging because of the intrinsic non-rigid deformation during the cardiac cycle, displacement of the myocardium due to respiratory motion, signal inhomogeneity within the thorax, and short transverse relaxation times. Recently developed accelerated diffusion-weighted MR acquisition sequences combined with advanced post-processing techniques have improved the accuracy and efficiency of diffusion MRI in the myocardium. In this review, we describe the solutions and approaches that have been developed to enable diffusion MRI of the heart in vivo, including a dual-gated stimulated echo approach, a velocity- (M1 ) or an acceleration- (M2 ) compensated pulsed gradient spin echo approach, and the use of principal component analysis filtering. The structure of the myocardium and the application of these techniques in ischemic heart disease are also briefly reviewed. The advent of clinical MR systems with stronger gradients will likely facilitate the translation of cardiac diffusion MRI into clinical use. The addition of diffusion MRI to the well-established set of cardiovascular imaging techniques should lead to new and complementary approaches for the diagnosis and evaluation of patients with heart disease. © 2015 The Authors. NMR in Biomedicine published by John Wiley & Sons Ltd.

Keywords: MRI; diffusion; heart; ischemia; myocardium; myofiber architecture; tensor; tractography.


Figures

Figure 1
Figure 1
Representation of fibers in the heart based on their HA, which reflects the inclination of the fiber out of the local radial or short‐axis plane. (A) In the lateral wall of the left ventricle, fibers with a positive HA course from postero‐base to antero‐apex, while those with a negative HA course from antero‐base to postero‐apex. (B) Fibers in the subendocardium have a positive HA, those in the subepicardium have a negative HA, and fibers in the midmyocardium are circumferential. (C) 3D view (base to apex) of a normal human heart with the myofiber tracts color coded by HA. (D) Orthogonal multi‐planar view of HA in the left ventricle. The use of HA to classify myofibers in the heart is more informative than use of the standard Cartesian coordinate system. Reproduced with permission 21.
Figure 2
Figure 2
Myofibers in the heart form an array of crossing helices. Fiber tracts in a rat heart, created by sweeping a small spherical region of interest (ROI) across the myocardium, are shown. The heart is viewed (A–E) from the apex and (F–J) from its lateral aspect. The papillary muscles and endocardial trabeculations can contain highly longitudinal myofibers with an absolute HA > 60°. The fibers from the subendocardium to the subepicardium span a range of approximately 120° in most mammals. Reproduced with permission 22.
Figure 3
Figure 3
Pulse sequences used for diffusion imaging of the myocardium. (A) PGSE or Stejskal–Tanner sequence; (B) dual‐gated STE sequence; (C) velocity‐compensated PGSE sequence. The diffusion‐encoding gradients are represented by the black rectangles (rise time is ignored), δ is the duration of the diffusion‐encoding gradient and represents the time between diffusion gradients. Single‐shot EPI readouts are used in all cases. (A) PGSE sequence with diffusion‐encoding gradients on either side of the 180° refocusing pulse. The sequence is highly sensitive to motion and has a relatively long T E. (B) Diffusion‐encoded STE sequence. The diffusion time is equal to T E/2 plus the mixing time (T M) and is equal to the RR interval. (The vertical lines breaking the baseline of the ECG indicate that the timeline is not drawn to scale.) (C) Velocity‐compensated PGSE sequence with bipolar diffusion‐encoding gradients on either side of the 180° refocusing pulse. Implementation of this sequence in vivo is feasible with ultra‐high gradient strengths, which allow δ and T E to be kept acceptably short. Reproduced with permission 13.
Figure 4
Figure 4
(A, B) DTI‐tractography of a normal mouse heart in vivo, using the velocity‐compensated PGSE approach and a 1500 mT/m gradient system. Fibers passing through an ROI (inset) in the left ventricle (LV) wall are shown (A) from a lateral perspective and (B) from the base. (A–C) The characteristic crossing of the subendocardial (pink to dark blue) and subepicardial (green–yellow) fibers is well resolved with in vivo DTI‐tractography. (D) DSI‐tractography of a mouse heart ex vivo showing the same crossing helical pattern. (E) Plots of HA versus transmural depth in normal mice imaged with in vivo DTI and ex vivo DSI. (F, G) Histograms of myofiber HA in the lateral wall obtained with DTI‐tractography in vivo (F, gray) and DSI‐tractography ex vivo (G, blue). (H–K) No significant differences are present in the transmural slope, mean, standard deviation (SD), or range of myofiber HA between the DSI‐ and in vivo DTI‐tractography datasets. This confirms the accuracy and promise of the velocity‐compensated PGSE sequence. Reproduced with permission 9.
Figure 5
Figure 5
High‐resolution DTI‐tractography of the human heart in vivo. The images are of a healthy human volunteer imaged with the velocity‐compensated PGSE sequence. (A, B) Coherent tracts with the correct orientation can be resolved in all regions of the myocardium. (Dispersion of HA over the papillary muscles and trabeculations of the LV is a normal finding.) (C) Magnified view of fibers crossing an ROI in the midlateral wall of the LV reveals the characteristic crossing pattern of myofibers in the subendocardium and subepicardium. S, septum; A, apex. The higher SNR of the PGSE sequence enabled a resolution of 2 × 2 × 4 mm3 to be achieved, three times better than the resolution obtained with the STE approach. Reproduced with permission 9.
Figure 6
Figure 6
Alternative diffusion MRI‐based approaches that compensate for the motion of the heart. (A) Application of the DW‐DE bSSFP sequence on a normal human heart 33. The T 2‐weighted (b = 0 s/mm2) image contains no diffusion contrast. Thereafter, images are acquired with diffusion encoding in three directions, which allows the apparent diffusion coefficient (ADC) to be calculated. (B) Application of the DW‐DE TSE approach on a pig with an 8‐week‐old transmural myocardial infarction 12. The increase in the ADC corresponds to the area of late gadolinium enhancement (LGE). Both A and B are derived from a DW‐DE approach compensated for both the first (M 1) and second (M 2) moments of motion. (C) The measurement of diffusion in the heart with the IVIM approach 34. This allows the percentage of the vascular compartment (f) in the heart to be measured and diffusion in the extravascular space to be separated from diffusion in the intravascular space. The IVIM images shown were acquired with the PCATMIP technique, where a PCA filtering approach is used to remove the effects of motion. Reproduced with permission 12, 33, 34.
Figure 7
Figure 7
Impact of strain on the STE sequence. DTI was performed at end‐systole (TD 305 ms) corresponding to the period of “standstill” on the cine images. This does not correspond to the sweet spot (point of no net strain effect) of the cycle for diffusion‐weighted STE (TD 160 ms). Tagged cine images were used to derive myocardial strain and correct the end‐systolic diffusion tensor for the effects of strain. The diffusion tensor field was rendered as superquadric glyphs, color coded by HA, and scaled by the eigenvalues. (A, B) Superquadric glyph field of the LV without and with strain correction, respectively. (C) Superquadric glyphs derived from the diffusion tensor with and without strain correction are superimposed. (A–C) Significant differences in the shape and orientation of the glyphs can be observed between the strain‐corrected and uncorrected images. Reproduced with permission 38.
Figure 8
Figure 8
Conservation of fiber architecture in the mammalian heart. Fiber tracts in the lateral wall of the LV are depicted using three classification schemes: in the first each segment in the tract is classified discretely by the HA of that segment; in the second the entire tract is classified by its median HA, and in the third by its mean HA. The tracts are being viewed from their epicardial surface (red fibers). Fiber architectures in the three species shown are remarkably similar. Reproduced with permission 21.
Figure 9
Figure 9
Development of myofiber architecture in the human fetal heart. (A–D) Tracts intersecting an ROI in the lateral wall are shown at various stages of gestation and development. Day 6 PN, post‐natal day 6. (E) Tracts in the entire heart at 19 weeks of gestation. Myocardial anisotropy and the characteristic architecture of the human heart develop fairly late in the second trimester. Reproduced with permission 68.
Figure 10
Figure 10
Quantification of tract coherence in the myocardium. The TCI is based on the maximum, median, and minimum HA classifications of myofibers within an ROI. The maximum, median, and minimum HA curves are derived by averaging each HA classification successively in the base–apex and anterior–posterior directions of the ROI at each voxel. This creates the three transmural HA curves. In the midmyocardium and subepicardium, tract coherence is high and the curves lie close to each other. In the subendocardium, however, tract coherence is reduced due to the effect of the papillary muscles and endocardial trabeculations. Reproduced with permission 21.
Figure 11
Figure 11
In vivo DTI and tractography in mice with IR. (A) MD map in a healthy mouse. (B, C) Serial MD maps of the LV in a mouse (B) 24 h and (C) 3 weeks after IR. (D, E) Acute injury is characterized by an increase in MD and a decrease in FA at 24 h. Within 3 weeks of IR, MD and FA have returned towards their normal values (C, control; * p < 0.05). (F) Tractography of the LV 3 weeks after IR. Moderate disruption of fiber architecture is seen. (G, H) Serial in vivo tractography of a mouse (G) 24 h and (H) 3 weeks after IR. At 24 h few tracts can be resolved in the apical half of the LV. At 3 weeks substantially more tracts, particularly in the subendocardium and midmyocardium, can be resolved, but fiber architecture remains significantly perturbed. Reproduced with permission 9.
Figure 12
Figure 12
DSI‐tractography of a normal and an infarcted rat heart. Imaging was performed ex vivo with 514 diffusion‐encoding directions. In the normal heart, fiber architecture is highly coherent. In the infarcted heart, a network of residual myofibers propagates into the infarct from the border zone. Color coding indicates HA. Reproduced with permission 22.
Figure 13
Figure 13
DTI‐tractography ex vivo showing a rightward rotation of fibers in the remote zone of a myocardial infarct. (A, B) Fiber tracts in the lateral wall of (A) a normal human heart and (B) a normal sheep heart. (C) Fiber tracts in the lateral wall (remote zone) of a sheep with a large septal infarct. The fibers in the remote zone have undergone a rightward (more positive) shift in HA. This can be clearly seen in the epicardium, where the fibers have shifted from red to yellow. (D–F) Histological confirmation of the DTI‐tractography findings. (D, E) Sections were obtained at six transmural depths in the lateral wall (1–6, from endocardium to epicardium) of normal sheep (D) and the remote zone (E) of infarcted sheep. (F) The transmural slope of HA, calculated from the histological sections, shows that HA in the remote zone becomes more positive (normal versus remote: * p < 0.05). Reproduced with permission 21.
Figure 14
Figure 14
Use of serial in vivo DTI‐tractography to characterize the regenerative response of the myocardium after the injection of BMMCs. In the majority of animals studied, the impact of cell injection was neutral. In one case, however, an accelerated recovery of myofiber architecture was seen (A–C). Post‐injection, new coherent tracts (arrows) were seen in both the subepicardium and subendocardium, and were confirmed histologically. In two animals, however, the injection of BMMCs impaired healing and had a deleterious effect on fiber architecture in the healing infarct (D–F). (D) Prior to BMMC injection, coherent tracts were seen in the subendocardium and subepicardium (arrows). (E, F) Following BMMC injection, fewer tracts were present in the anterolateral subendocardium, and the tracts in the subepicardium of the inferolateral wall were completely lost (scale bar, 100 µm). Color coding indicates HA. Reproduced with permission 9.
Figure 15
Figure 15
DTI of a healthy volunteer with the STE approach using (A) multiple breath‐holds (BH) and (B) a diaphragmatic navigator (NAV) during free breathing. In both cases, the identical three short‐axis slices were imaged and the tensor field was represented with superquadric glyphs color coded by HA. The qualities of the BH and NAV approaches appear fairly similar. Reproduced with permission 37.
Figure 16
Figure 16
Tractography of the whole heart of a normal volunteer without slice gaps 79. The fibers are color coded by their HA. Twelve contiguous short‐axis slices, each 8 mm thick, were imaged with the STE approach. (A) The entire heart viewed from the postero‐lateral perspective. (B) Tracts intersecting a small ROI placed in the lateral wall at the mid‐ventricular level. The evolution of HA from positive in the subendocardium to negative in the subepicardium is clearly seen. (C) Tractography within a basal short‐axis slab depicting the transmural arrangement of myofibers in both the left and right ventricles. Original images provided by the authors.

References

    1. Edelman RR, Gaa J, Wedeen VJ, Loh E, Hare JM, Prasad P, Li W. In vivo measurement of water diffusion in the human heart. Magn. Reson. Med. 1994; 32(3): 423–428. - PubMed
    1. Reese TG, Wedeen VJ, Weisskoff RM. Measuring diffusion in the presence of material strain. J. Magn. Reson. B 1996; 112(3): 253–258. - PubMed
    1. Reese TG, Weisskoff RM, Smith RN, Rosen BR, Dinsmore RE, Wedeen VJ. Imaging myocardial fiber architecture in vivo with magnetic resonance. Magn. Reson. Med. 1995; 34(6): 786–791. - PubMed
    1. van Heeswijk RB, Feliciano H, Bongard C, Bonanno G, Coppo S, Lauriers N, Locca D, Schwitter J, Stuber M. Free‐breathing 3 T magnetic resonance T2‐mapping of the heart. JACC Cardiovasc. Imaging 2012; 5(12): 1231–1239. - PubMed
    1. van Heeswijk RB, Piccini D, Feliciano H, Hullin R, Schwitter J, Stuber M. Self‐navigated isotropic three‐dimensional cardiac T2 mapping. Magn. Reson. Med. 2015; 73(4): 1549–1554. - PubMed

MeSH terms

LinkOut - more resources