. 2015 Oct 20;11(10):e1004515.
doi: 10.1371/journal.pcbi.1004515. eCollection 2015 Oct.

At the Edge of Chaos: How Cerebellar Granular Layer Network Dynamics Can Provide the Basis for Temporal Filters

Affiliations

At the Edge of Chaos: How Cerebellar Granular Layer Network Dynamics Can Provide the Basis for Temporal Filters

Christian Rössert et al. PLoS Comput Biol. .

Abstract

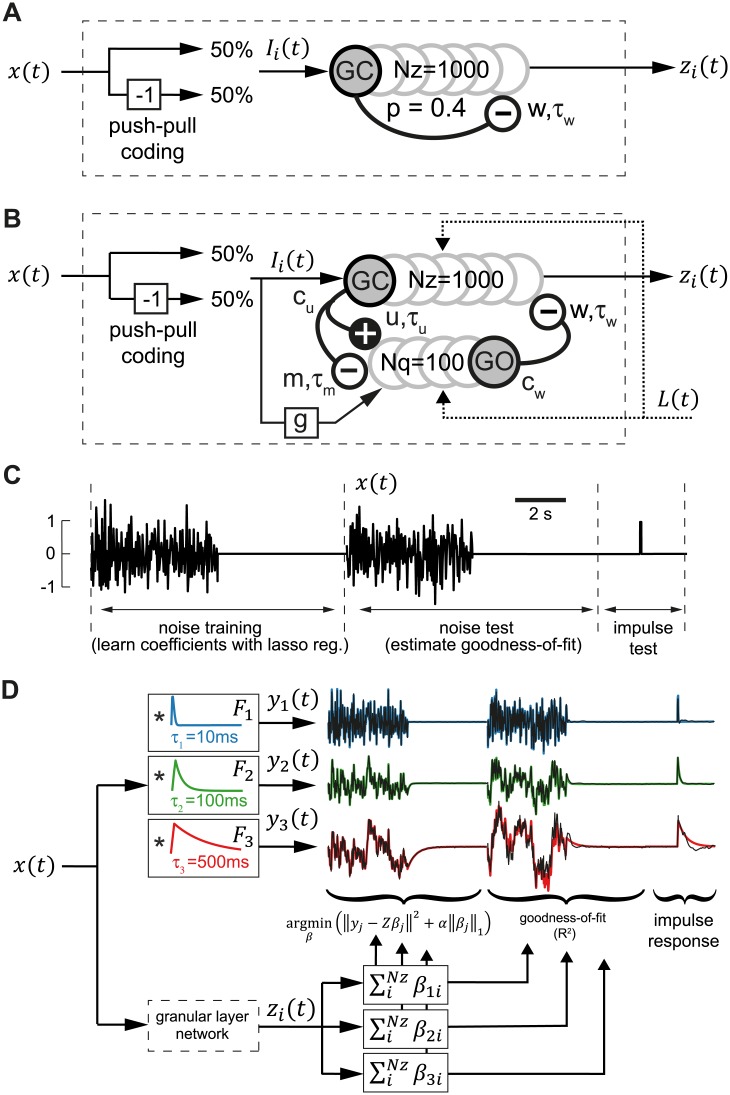
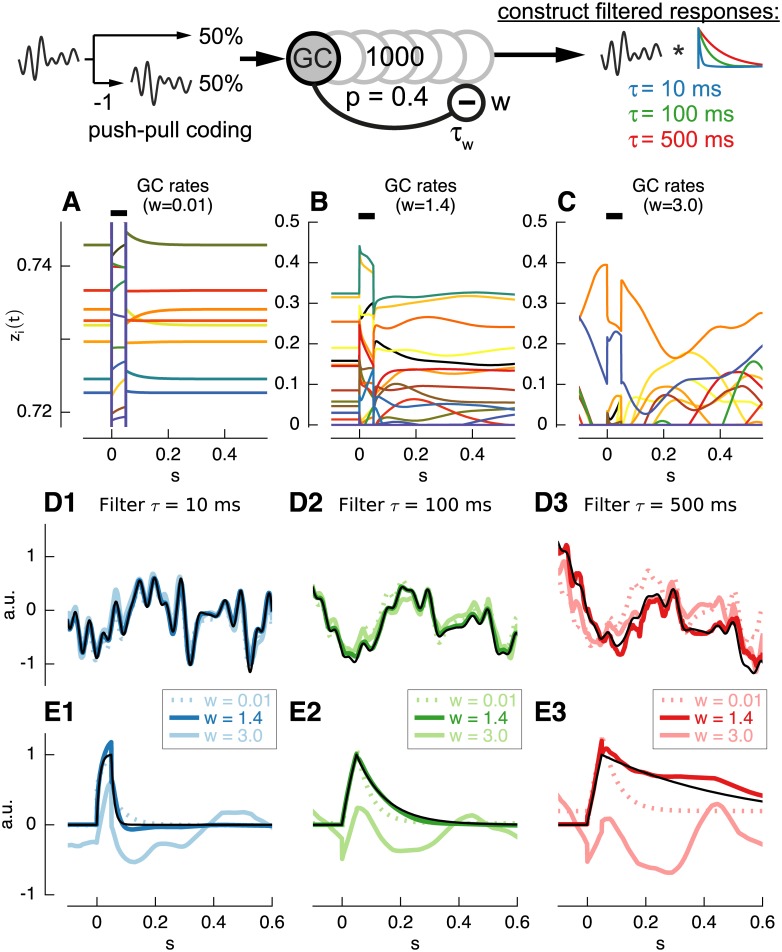
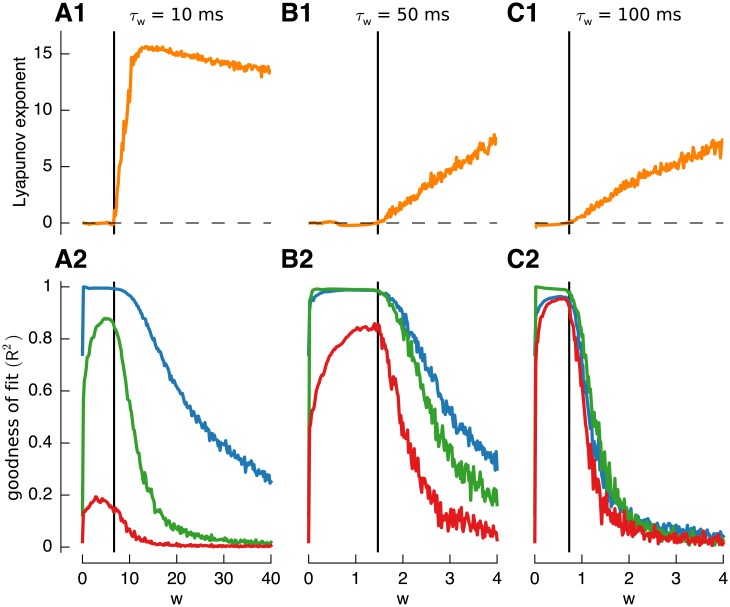
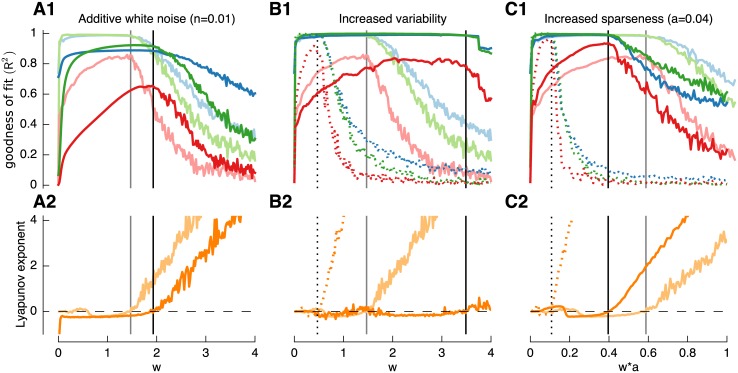
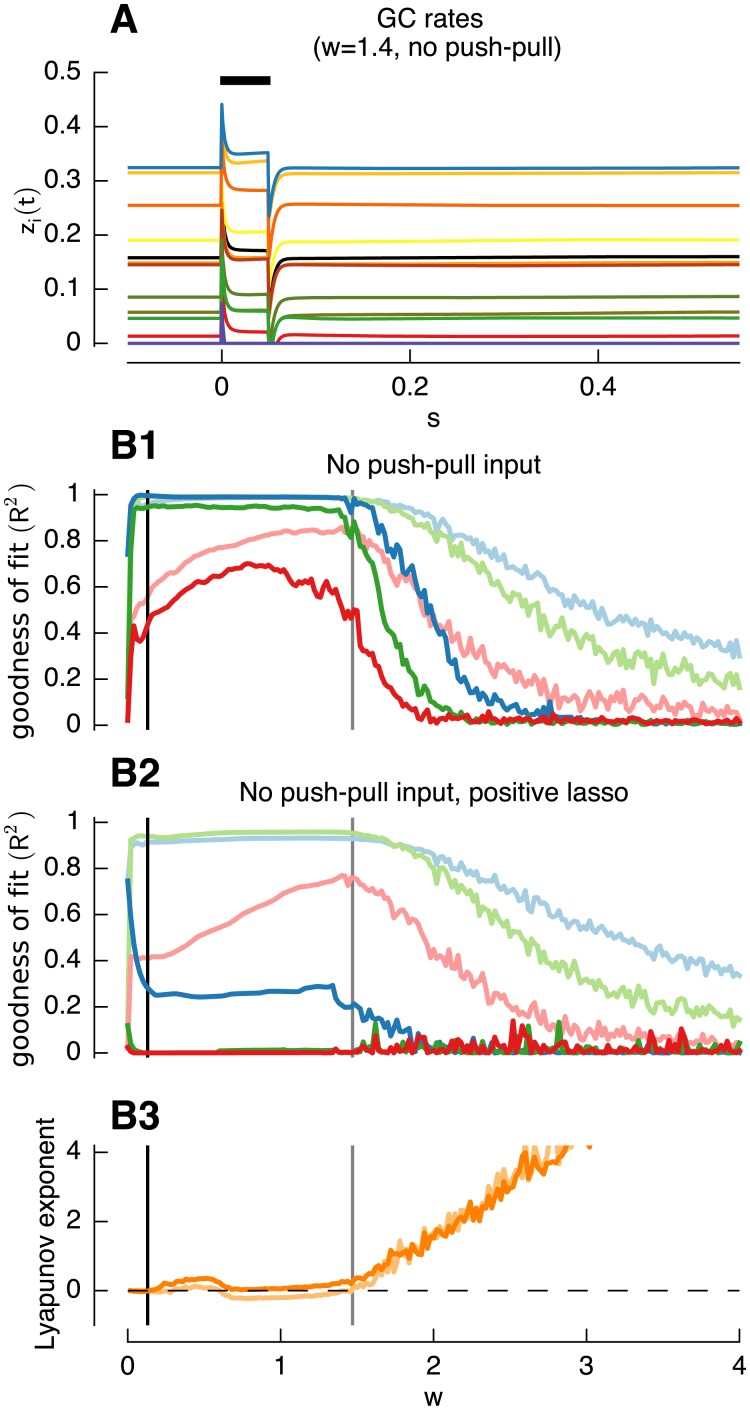
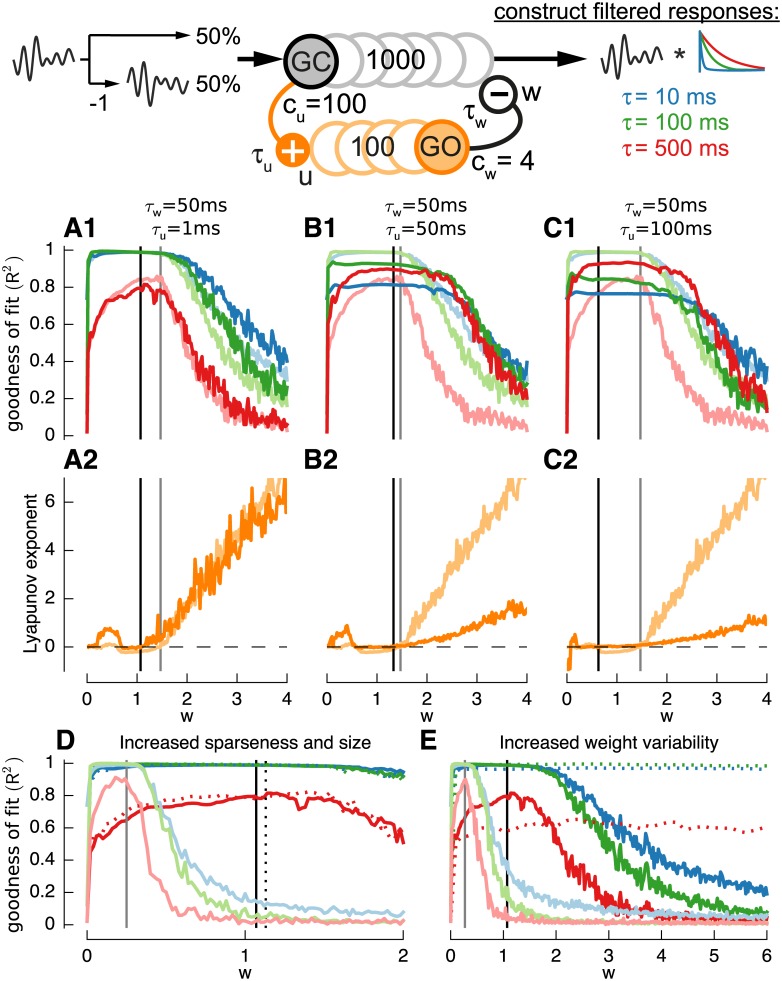
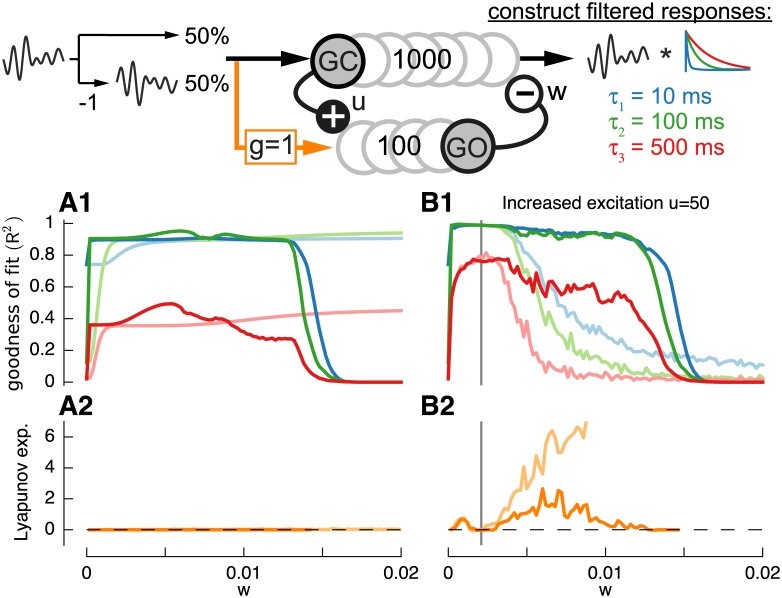
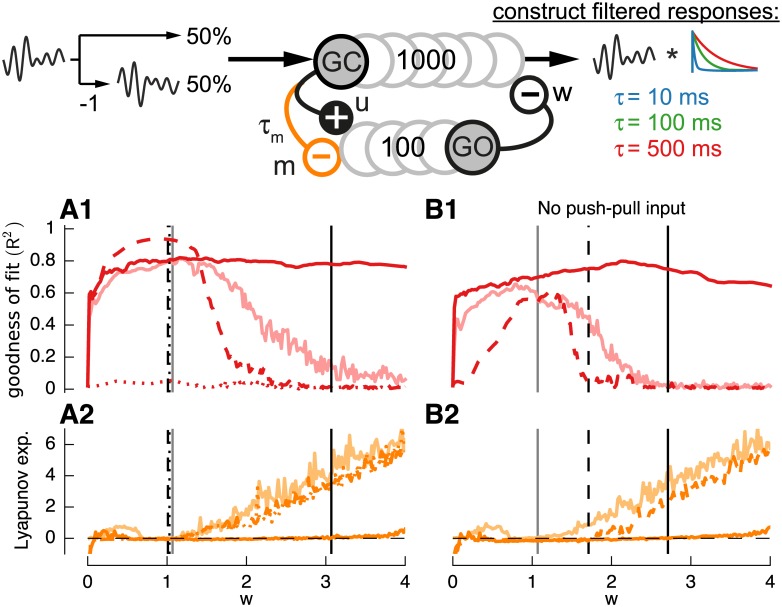
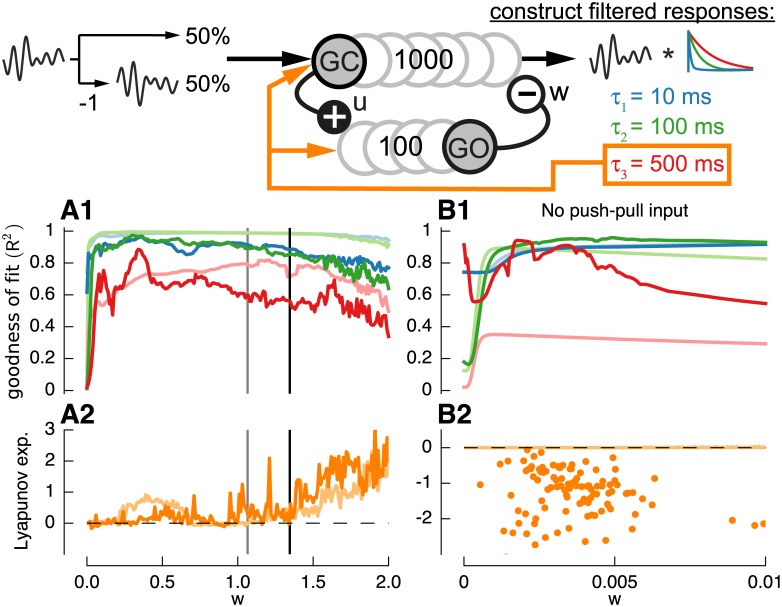
Models of the cerebellar microcircuit often assume that input signals from the mossy-fibers are expanded and recoded to provide a foundation from which the Purkinje cells can synthesize output filters to implement specific input-signal transformations. Details of this process are however unclear. While previous work has shown that recurrent granule cell inhibition could in principle generate a wide variety of random outputs suitable for coding signal onsets, the more general application for temporally varying signals has yet to be demonstrated. Here we show for the first time that using a mechanism very similar to reservoir computing enables random neuronal networks in the granule cell layer to provide the necessary signal separation and extension from which Purkinje cells could construct basis filters of various time-constants. The main requirement for this is that the network operates in a state of criticality close to the edge of random chaotic behavior. We further show that the lack of recurrent excitation in the granular layer as commonly required in traditional reservoir networks can be circumvented by considering other inherent granular layer features such as inverted input signals or mGluR2 inhibition of Golgi cells. Other properties that facilitate filter construction are direct mossy fiber excitation of Golgi cells, variability of synaptic weights or input signals and output-feedback via the nucleocortical pathway. Our findings are well supported by previous experimental and theoretical work and will help to bridge the gap between system-level models and detailed models of the granular layer network.


Conflict of interest statement

The authors have declared that no competing interests exist.

Figures

Fig 1
Fig 1. Granular layer models and filter construction procedure.
A: Diagram of one-population granular layer model based on Yamazaki and Tanaka [15] consisting of mutually inhibiting granule cells and input signals coded by push-pull input. B: Diagram of two-population granular layer model consisting of granule cells (GC) and Golgi cells (GO). GC innervate GO using glutamatergic excitation (u) and inhibition by mGluR2 activated GIRK channels (m). GO inhibit GC by GABAergic inhibition (w). All synaptic connection simulated using single exponential processes (see Methods). C: Input signal x(t) consisting of colored noise input for training, test and impulse response input. D: Diagram of filter construction test procedure. The output signals z i(t) of all granule cells during the training sequence were used to construct exponential (leaky integrator) filters of increasing time constants τ j = 10ms (blue line), 100ms (green line) and 500ms (red line) using LASSO regression (see Methods). The goodness-of-fit (R 2) of this filter construction was evaluated during the noise test sequence.
Fig 2
Fig 2. Responses of constructed filters and individual granule cell rates.
A,B,C: Individual responses of randomly selected granule cells with weights w = 0.01 (A), w = 1.4 (B), w = 3 (C). Black bars indicate duration of pulse input. D,E: Responses of filters (τ 1 = 10ms (D1,E1), τ 2 = 100ms (D2,E2) and τ 3 = 500ms (D3,E3)) constructed from network with inhibitory time constant τ w = 50ms and inhibitory weight w = 1.4 (blue, green and red lines), w = 3 (light blue, light green and light red lines) or w = 0.01 (dotted light blue, light green and light red lines) to colored noise input (D) or pulse input (E). Responses of corresponding ideal filters shown as black lines. To construct the shown filters of 10/100/500ms the percentage of weights equal 0 and mean absolute weights > 0 was 90/53/34% and 20.6/60.4/86.1 for w = 0.01, 76/70/65% and 4.2/13.6/26.5 for w = 3 and 91/86/75% and 5.5/11.7/52.6 for w = 1.4, respectively.
Fig 3
Fig 3. Construction of basis filters using a randomly connected network with feed-forward inhibition using LASSO regression.
A1,B1,C1: Lyapunov exponent of randomly connected networks with increasing weight w. Networks with three different feed-forward inhibition time-constants are considered: τ w = 10ms (A1), τ w = 50ms (A2) and τ w = 100ms (A3). Vertical black lines visualize the “edge-of-chaos” as defined in Methods. A2,B2,C2: Goodness of fit (R 2) of three exponential filters (τ 1 = 10ms (blue), τ 2 = 100ms (green) and τ 3 = 500ms (red)) constructed from responses of corresponding networks above.
Fig 4
Fig 4. Filter construction is sensitive to various parameters.
As previously, filters used are τ 1 = 10ms (blue), τ 2 = 100ms (green) and τ 3 = 500ms (red). Default inhibitory time constant: τ w = 50ms. Goodness of fit (R 2) (A1,B1,C1) and Lyapunov exponent (A2,B2,C2) are compared to a control shown as light solid lines in all subplots. A: Effect of additive white noise (n = 0.01) in the network (dark lines). B: Effect of increased input variability (vin = 2) (dark solid lines) and increased variability of the inhibitory weight (vw = 2) (dotted lines). C: Effect of increased sparseness by reducing probability of connectivity to a = 0.04 for network size N = 1k (dotted lines) and N = 10k (dark solid lines). For a better comparison x-axis was normalized with the probability of connectivity a.
Fig 5
Fig 5. Push-pull coding is beneficial for filter construction.
A: Individual responses of randomly chosen granule cells with w = 1.4 but without push-pull input coding. Black bars indicate duration of pulse input. B: As previously, filters used are τ 1 = 10ms (blue), τ 2 = 100ms (green) and τ 3 = 500ms (red). Default network: τ w = 50ms and push-pull input coding. B1: Default goodness of fit (R 2) (light lines) is compared to network without push-pull input coding (dark lines). B2: Goodness of fit for default network (light lines) is compared to network without push-pull input (dark lines) using regression with positive coefficients only. B3: Corresponding Lyapunov exponent for network with (dark orange line) and without push-pull coding (light orange lines).
Fig 6
Fig 6. Construction of basis filters using a randomly connected network with feed-forward inhibition via a second population mimicking Golgi cells.
As previously, filters used are τ 1 = 10ms (blue), τ 2 = 100ms (green) and τ 3 = 500ms (red). A,B,C: Goodness of fit (R 2) (A1,B1,C1) and Lyapunov exponents (A2,B2,C2) for three networks with τ w = 50ms, τ u = 1ms (A), τ w = 50ms, τ u = 50ms (B) and τ w = 50ms, τ u = 100ms (C). Results for previous one-population network with τ w = 50ms shown as light lines. D: Effect of increased sparseness in a two-population network with τ w = 50ms, τ u = 1ms: 1. Increase of granule cell population size from Nz = 1k (dark solid lines) to N = 10k (dotted lines). 2. Decrease of convergence to c u = 10 while keeping network size at Nz = 1k (light solid lines). E: Effect of increased weight variability in a two-population network with τ w = 50ms, τ u = 1ms. Compared to control network without weight variability (dark solid lines). 1. Increase of variability for weight of inhibition w (v w = 4) (dotted lines). 2. Increase of variability for weight of excitation u (v u = 4) (light lines)
Fig 7
Fig 7. Effects of Golgi cell afferent excitation on filter construction performance.
As previously, target filters used are τ 1 = 10ms (blue), τ 2 = 100ms (green) and τ 3 = 500ms (red). Default synaptic time constants: τ w = 50ms, τ u = 1ms. A,B: Goodness of fit (R 2) (A1,B1) and Lyapunov exponents (A2,B2) for default network (light lines) and network with external excitation of Golgi cells (dark lines) with either default excitation of u = 0.1 (A) or increased excitation u = 50 (B).
Fig 8
Fig 8. Effect of mGluR2 receptor activated GIRK channel inhibition of Golgi cells on filter construction performance.
For clarity only most affected target filter τ 3 = 500ms (red) is shown. Default synaptic time constants: τ w = 50ms, τ u = 1ms. A,B: Goodness of fit (R 2) (A1) and Lyapunov exponents (A2) for default network (light red lines) and network with mGluR2 receptor activated GIRK channel inhibition of Golgi cells (m = 0.003) either without (v m = 0) (dotted red lines) or small (v m = 0.1) (dashed red lines) weight variability. Additionally results with mGluR2 dynamics in only 50% of the Golgi cells (solid red lines) (Pr(m = 0) = 0.5, v m = 0.1). B shows results for networks without push-pull input coding.
Fig 9
Fig 9. Effect of output-feedback on filter construction performance.
As previously, target filters used are τ 1 = 10ms (blue), τ 2 = 100ms (green) and τ 3 = 500ms (red). Default synaptic time constants: τ w = 50ms, τ u = 1ms. A,B: Goodness of fit (R 2) (A1,B1) and Lyapunov exponents (A2,B2) for default network (light lines) and network having output-feedback of the slowest filter response (τ 3 = 500ms) to granule and Golgi cells (dark lines) with either push-pull input (A) or without (B).

Similar articles

Cited by

References

    1. Marr D. A theory of cerebellar cortex. J Physiol. 1969;202: 437–470. - PMC - PubMed
    1. Albus JS. A theory of cerebellar function. Math Biosci. 1971;10: 25–61.
    1. Fujita M. Adaptive filter model of the cerebellum. Biol Cybern. 1982;45: 195–206. - PubMed
    1. Dean P, Porrill J, Ekerot C-F, Jörntell H. The cerebellar microcircuit as an adaptive filter: experimental and computational evidence. Nat Rev Neurosci. 2010;11: 30–43. 10.1038/nrn2756 - DOI - PubMed
    1. Dean DP, Jörntell DH, Porrill DJ. Adaptive Filter Models In: Manto M, Schmahmann JD, Rossi F, Gruol DL, Koibuchi N, editors. Handbook of the Cerebellum and Cerebellar Disorders. Springer; Netherlands; 2013. pp. 1315–1335. Available: http://link.springer.com/referenceworkentry/10.1007/978-94-007-1333-8_58 - DOI

Publication types

LinkOut - more resources