. 2015 Oct 20;11(10):e1005612.
doi: 10.1371/journal.pgen.1005612. eCollection 2015 Oct.

Protein Homeostasis Imposes a Barrier on Functional Integration of Horizontally Transferred Genes in Bacteria

Affiliations

Protein Homeostasis Imposes a Barrier on Functional Integration of Horizontally Transferred Genes in Bacteria

Shimon Bershtein et al. PLoS Genet. .

Abstract

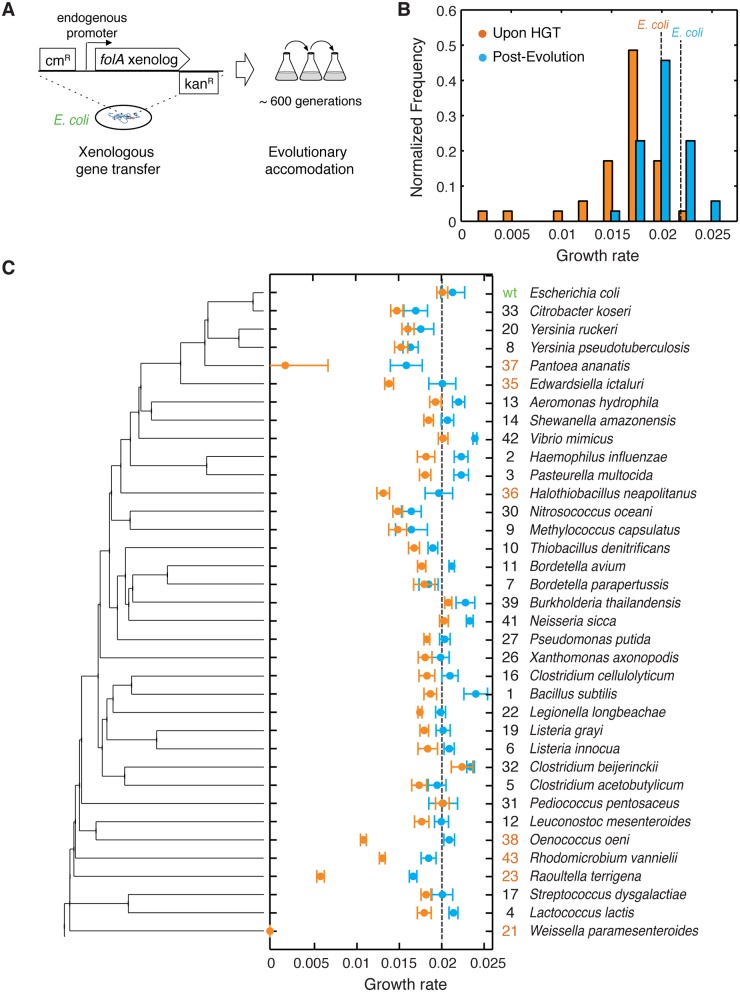
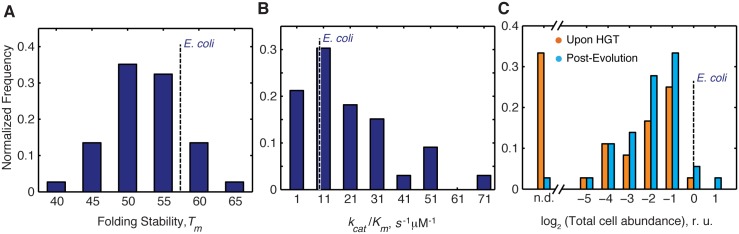
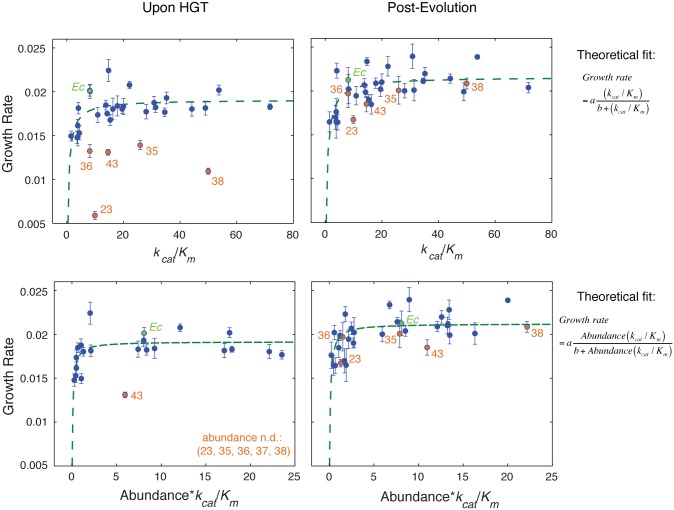
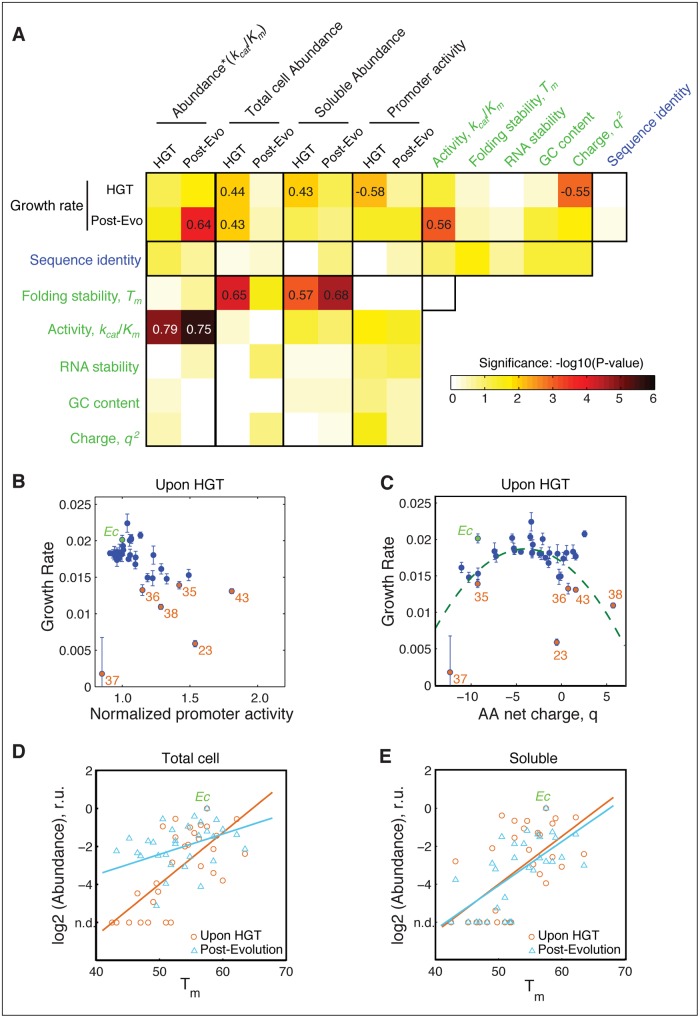
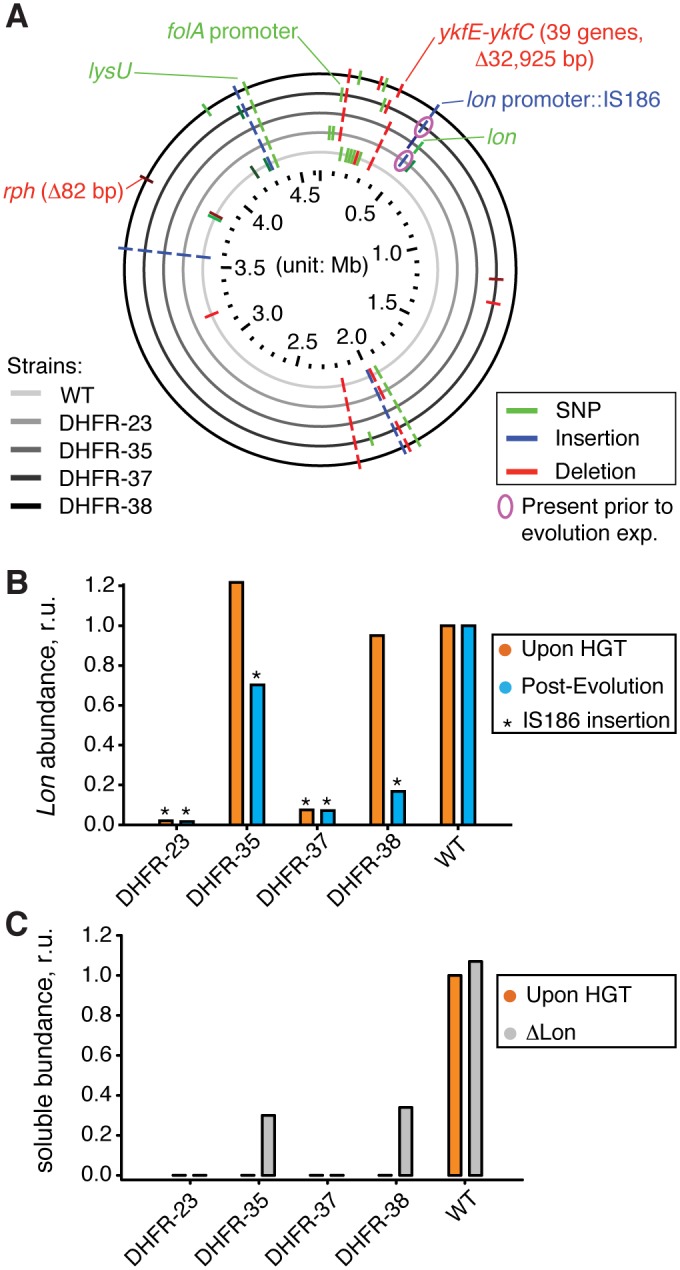
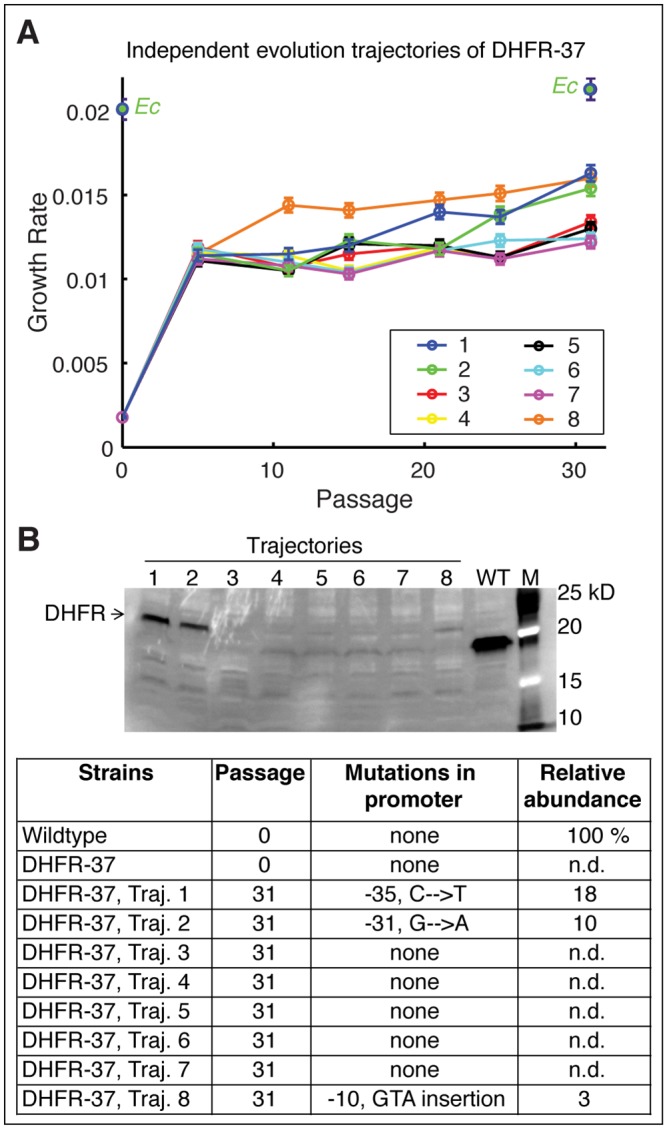
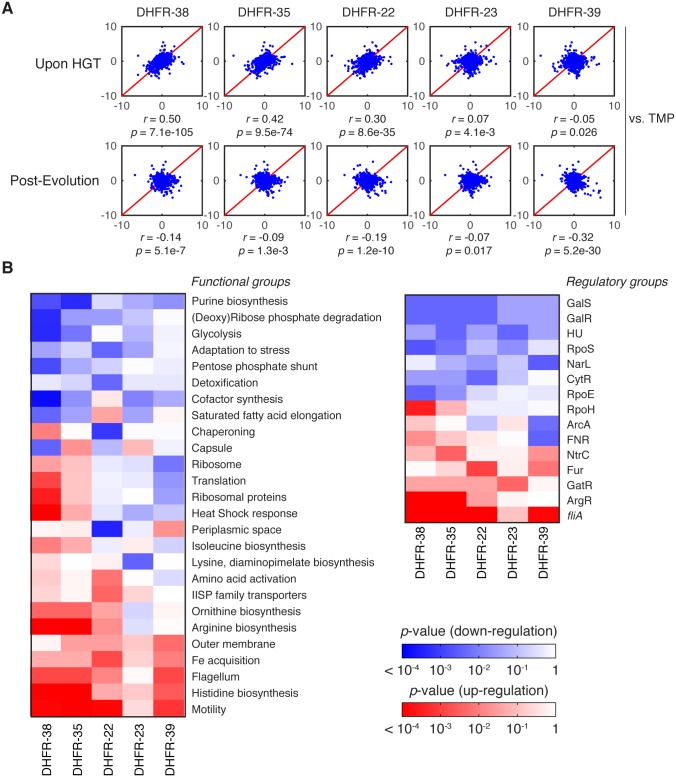
Horizontal gene transfer (HGT) plays a central role in bacterial evolution, yet the molecular and cellular constraints on functional integration of the foreign genes are poorly understood. Here we performed inter-species replacement of the chromosomal folA gene, encoding an essential metabolic enzyme dihydrofolate reductase (DHFR), with orthologs from 35 other mesophilic bacteria. The orthologous inter-species replacements caused a marked drop (in the range 10-90%) in bacterial growth rate despite the fact that most orthologous DHFRs are as stable as E.coli DHFR at 37°C and are more catalytically active than E. coli DHFR. Although phylogenetic distance between E. coli and orthologous DHFRs as well as their individual molecular properties correlate poorly with growth rates, the product of the intracellular DHFR abundance and catalytic activity (kcat/KM), correlates strongly with growth rates, indicating that the drop in DHFR abundance constitutes the major fitness barrier to HGT. Serial propagation of the orthologous strains for ~600 generations dramatically improved growth rates by largely alleviating the fitness barriers. Whole genome sequencing and global proteome quantification revealed that the evolved strains with the largest fitness improvements have accumulated mutations that inactivated the ATP-dependent Lon protease, causing an increase in the intracellular DHFR abundance. In one case DHFR abundance increased further due to mutations accumulated in folA promoter, but only after the lon inactivating mutations were fixed in the population. Thus, by apparently distinguishing between self and non-self proteins, protein homeostasis imposes an immediate and global barrier to the functional integration of foreign genes by decreasing the intracellular abundance of their products. Once this barrier is alleviated, more fine-tuned evolution occurs to adjust the function/expression of the transferred proteins to the constraints imposed by the intracellular environment of the host organism.


Conflict of interest statement

The authors have declared that no competing interests exist.

Figures

Fig 1
Fig 1. The barrier to horizontal transfer of orthologous DHFR proteins is alleviated by experimental evolution.
A) ORF of folA gene encoding DHFR in the E. coli chromosome is replaced with orthologs from 35 other mesophiles, while preserving the endogenous promoter. The strains carrying the orthologous DHFR replacements are evolved for 31 serial passages (~600 generations) under standard conditions. B) Distribution of the growth rates before (immediately upon HGT) and after evolution experiment. Growth rate of the WT strain with E. coli DHFR is marked with a dashed line (see also S3 Table). Kolmogorov-Smirnov (KS) test indicates that pre- and post-evolution populations are significantly different with respect to their growth rates (p-value <10−10). While 31 out of the 35 naive strains (88%) have lower growth rates than WT, 30% of the post-evolution strains have higher growth rates than WT. C) Growth rates before and after evolution for each strain as a function of its DHFR’s position in the phylogeny. Color scheme is similar to panel (B). Strains are ordered according to the phylogenetic tree on the left. On the right we show an ID number for each strain (used throughout the text) and the original species carrying that DHFR ortholog. We highlight in orange the ID numbers of strains that experience severe fitness drop (30% and lower) upon DHFR replacement. Error bars represent standard deviation of 4 independent measurements.
Fig 2
Fig 2. Distribution of molecular and cellular properties of orthologous DHFRs.
A) Distribution of Tm values of the purified DHFR proteins assessed by thermal unfolding in a Differential Scanning Calorimeter (see Materials and Methods). The proteins span wide range of stability between 42–63°C, as expected for mesophilic proteins, with ~80% of proteins having higher stability than E.coli DHFR. (see also S1 Table). B) Distribution of catalytic activity (k cat/KM) of the purified DHFRs (see Materials and Methods, and S1 Table). ~70% purified DHFR proteins were found to have activities that are comparable to or better than E. coli DHFR. C) Intracellular abundance (measured in total cell lysate) of DHFR before and after evolution experiment assessed by Western Blot with polyclonal anti-His antibodies (see Materials and Methods). Abundance is expressed relative to that of E. coli DHFR. Strains for which abundances were too low to be detected are denoted as n.d. After the evolution experiment, a large number of strains have detectable abundance (~97% compared to ~70% before evolution) (S1 Table and S5 Fig) Overall, there is a significant shift in the abundance distribution for all proteins after evolution experiment (KS p-value = 0.049).
Fig 3
Fig 3. Fitness landscape of HGT strains is largely explained by flux dynamics theory.
A) Relationship between activity (k cat/K m) of the purified orthologous DHFR proteins and growth rate of the naive HGT strains (prior to evolution experiment). Strains that exhibit the most dramatic drop in fitness (DHFR-23, 35, 36, 38, and 43) are highlighted in orange (see Fig 1C). Wild type E. coli is labeled Ec. No correlation between fitness and activity exists (R = 0.34, p-value = 10−1) when all points are included (see Fig 4A). However, after excluding the outliers (DHFR-23, 35, 36, 38, and 43), the relationship between activity and growth follows flux dynamics theory that predicts that growth rate is proportional to total folate turnover (see the equation on the right; constants a and b depend on the number of enzymes and topology of the metabolic network) (green line, p-value = 10−4). B) Growth rate and activity after the evolution experiment. Similar to (A), fit also excludes DHFR-23, 35, 36, 38, and 43, but they nonetheless migrate to the prediction of the flux dynamics theory (n.d.–non-detectable). C-D) Relationship between growth rate and the product of relative intracellular abundance (from total lysates) and activity (k cat/K m). Theoretical fit also excludes DHFR-23, 35, 36, 38, and 43. (p-values are <10−4 for all theoretical fits in panels (A-D)).
Fig 4
Fig 4. The role of molecular and cellular properties in the fitness effects of HGT.
A) Correlation between growth rates, sequence and biophysical properties, and cellular responses (S1, S2 and S3 Tables) Blocks are colored according to −log10 (p-values) of Spearman correlation. Correlation coefficients with p-values<10−2 are indicated within the blocks. Promoter activity of the DHFR genes (endogenous folA promoter) is measured as a ratio between GFP signal from pUA66 plasmid and optical density of the growing cultures (see Materials and Methods). RNA stability is calculated over a 42 nt window starting near the translation site (-4) (see Materials and Methods and). Both RNA folding stability and GC content are calculated using the adapted DNA sequences (S2 Table). Neither GC content nor RNA folding stability correlates with fitness. Besides having a good correlation with kcat/KM and abundance*kcat/KM (Fig 3), fitness before evolution experiment shows significant correlation with promoter activity and net charge of DHFR. B) Activation of folA promoter is inversely correlated with growth rate before evolution, a signature of deficiency in intracellular DHFR abundance. This correlation disappears after the evolution experiment (S4A Fig), indicating an increase in DHFR abundance. C) Growth rates before evolution experiment exhibit an apparent quadratic dependence on the net charge q of the DHFR amino acid sequence. Dashed curve is the regression through the points defined by (q+3.5)2 (p-value <10−4). The dependency becomes much less pronounced after the experimental evolution (S4B Fig). D,E) Intracellular DHFR abundance measured in total cell lysate (D) and soluble fraction (E) immediately before evolution correlates with folding stability T m (orange circles) (r = 0.65; p-value <104 for total cell, and r = 0.57; <103 for soluble). After the evolution, a strong increase in DHFR abundance as measured in total cell lysates weakens the correlation with Tm (blue triangles; r = 0.41, p-value = 0.025) (D), but the strong correlation with Tm is preserved for soluble abundances (blue triangles; r = 0.68, p-value<104) (E).
Fig 5
Fig 5. Sequencing of the orthologous strains.
A) Mutations detected by whole genome sequencing (WGS) in the evolved populations of WT and orthologous DHFR-23, 35, 37, and 38 strains are indicated with respect to their location in E. coli chromosome. Only mutations that exceed 20% frequency in a population are shown (see S4 Table for detailed sequencing results). Mutations validated by PCR followed by Sanger sequencing (S5 Table), or known from literature are annotated. IS186 insertion in clpX-lon intergenic area was also found in naive DHFR-23 and 27 strains (i.e., prior to evolutionary experiment) (pink circle). B) Intracellular Lon abundance decreases upon intergenic clpX-lon IS186 insertion. Intracellular Lon abundance in total cell lysates was detected using anti-Lon antibodies immediately upon HGT (orange) and after the evolutionary experiment (blue) (see Materials and Methods). Strains with IS186 insertion are marked with asterisk. C) Purifying lon knock-out (⊗lon) was performed on naive DHFR-23, 35, 37, and 38 strains (described previously in), and the resulted change in intracellular DHFR abundance in soluble fraction of cell lysates was measured with Western Blot using anti-His antibodies (see Materials and Methods). Abundance of DHFR-35 and 38 changed from an undetected levels to approximately 30% of the WT E. coli DHFR level.
Fig 6
Fig 6. Fine-tuning evolution of orthologous DHFR expression.
A) Eight independent evolutionary trajectories of DHFR-37 (from P. ananatis) show an increase in fitness after evolution. Growth rates of each individual trajectories were measured every 5 passages. Three trajectories (1, 2, and 8) become markedly fitter than the rest after 31 passages. Error bars represent standard deviation of 4 independent measurements. B) Soluble abundance of DHFR-37 protein was measured in soluble cell fractions of all eight trajectories after evolution (In the gel, M: Marker). Note the pronounced abundance levels in trajectories 1, 2, and 8. N.d. not detected. Sequencing of folA gene revealed characteristic mutations in the promoter region that explain the increased abundance and improved fitness.
Fig 7
Fig 7. Global proteomic response to HGT.
A) z-scores correlation plots between proteomes of indicated DHFR orthologous strains (upon HGT and after evolution) and WT strain treated with 1 μg/ml trimethoprim (TMP) (see Materials and Methods and S6 Table). The strains are representative of the fitness effects upon HGT: DHFR-23, 35 and 38 are severely deleterious; DHFR-22 is mildly deleterious; and DHFR-39 is beneficial (Fig 1C). Global proteome quantification was obtained using LC-MS/MS analysis of TMT-labeled proteomes [34]. Each quantified protein (+2,000 proteins per proteome) is assigned a z-score that measures the enrichment of its abundance relative to the whole proteome (see Materials and Methods). The proteome profile upon HGT of DHFR-38, 35 and 22 is similar to the adverse cellular state during the antibiotic treatment, but is relaxed after experimental evolution. The strains are ordered left to right according to decreasing similarity with TMP treated WT cells (top panel). B) Change in global variation in protein abundances induced by experimental evolution of the indicated orthologous strains calculated for functional and regulatory classes of genes. Color code indicates logarithm of p-values of two-sample KS tests performed on pre- and post-evolution proteomes along with the direction of change (blue—drop in abundance, red—increase in abundance) (see Materials and Methods). We plotted only the gene groups whose change upon evolution experiment is significant (KS p value less than 0.01). The proteomic responses DHFR-35 and 38 upon HGT and post-evolution are similar despite their evolutionary distance (see Fig 1C).

References

    1. Koonin EV, Makarova KS, Aravind L (2001) Horizontal gene transfer in prokaryotes: quantification and classification. Annu Rev Microbiol 55: 709–742. - PMC - PubMed
    1. Lawrence JG, Ochman H (1998) Molecular archaeology of the Escherichia coli genome. Proc Natl Acad Sci U S A 95: 9413–9417. - PMC - PubMed
    1. Marri PR, Hao W, Golding GB (2007) The role of laterally transferred genes in adaptive evolution. BMC Evol Biol 7 Suppl 1: S8 - PMC - PubMed
    1. Gogarten JP, Townsend JP (2005) Horizontal gene transfer, genome innovation and evolution. Nat Rev Microbiol 3: 679–687. - PubMed
    1. Popa O, Dagan T (2011) Trends and barriers to lateral gene transfer in prokaryotes. Curr Opin Microbiol 14: 615–623. 10.1016/j.mib.2011.07.027 - DOI - PubMed

Publication types

Substances

LinkOut - more resources