. 2015 Oct 20;10(10):e0140613.
doi: 10.1371/journal.pone.0140613. eCollection 2015.

Ibuprofen and Diclofenac Restrict Migration and Proliferation of Human Glioma Cells by Distinct Molecular Mechanisms

Affiliations

Ibuprofen and Diclofenac Restrict Migration and Proliferation of Human Glioma Cells by Distinct Molecular Mechanisms

Verena Leidgens et al. PLoS One. .

Abstract

Background: Non-steroidal anti-inflammatory drugs (NSAIDs) have been associated with anti-tumorigenic effects in different tumor entities. For glioma, research has generally focused on diclofenac; however data on other NSAIDs, such as ibuprofen, is limited. Therefore, we performed a comprehensive investigation of the cellular, molecular, and metabolic effects of ibuprofen and diclofenac on human glioblastoma cells.

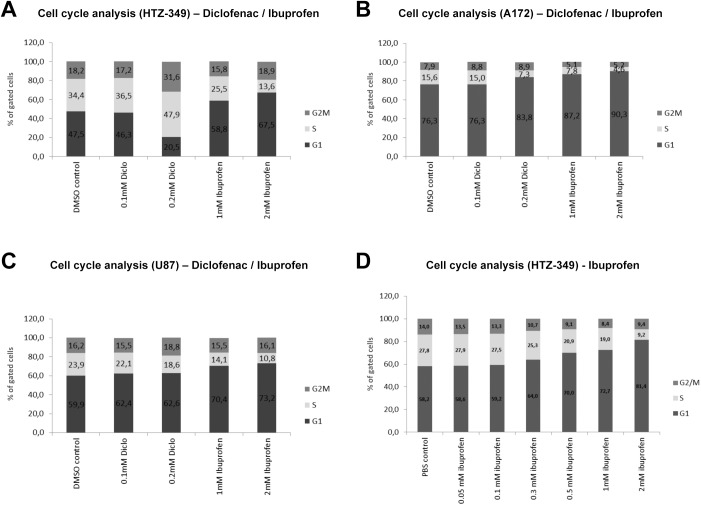
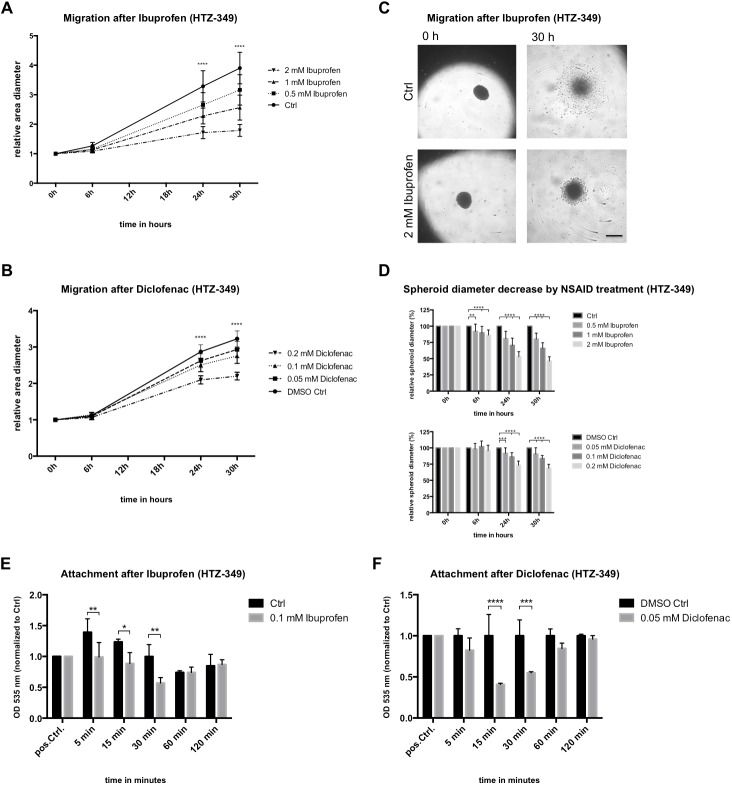
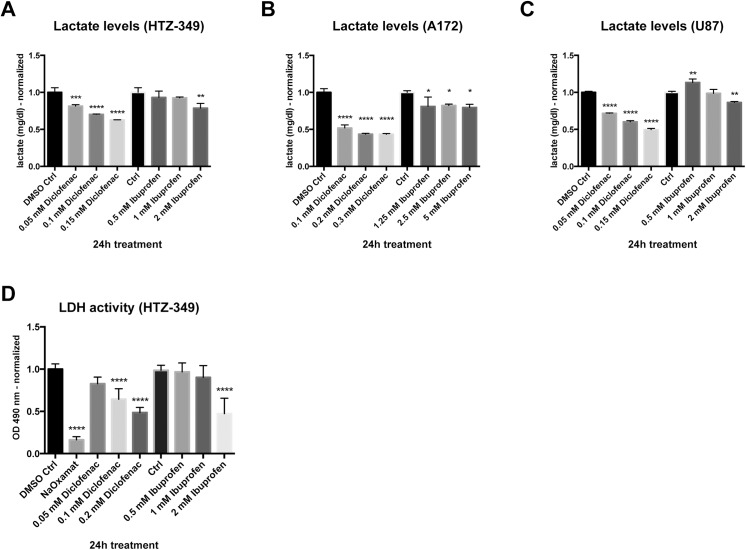
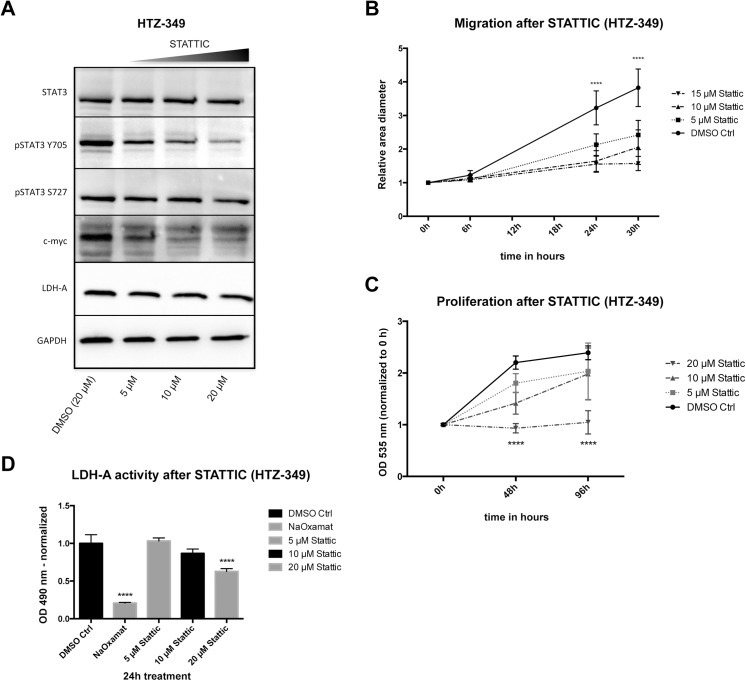
Methods: Glioma cell lines were treated with ibuprofen or diclofenac to investigate functional effects on proliferation and cell motility. Cell cycle, extracellular lactate levels, lactate dehydrogenase-A (LDH-A) expression and activity, as well as inhibition of the Signal Transducer and Activator of Transcription 3 (STAT-3) signaling pathway, were determined. Specific effects of diclofenac and ibuprofen on STAT-3 were investigated by comparing their effects with those of the specific STAT-3 inhibitor STATTIC.

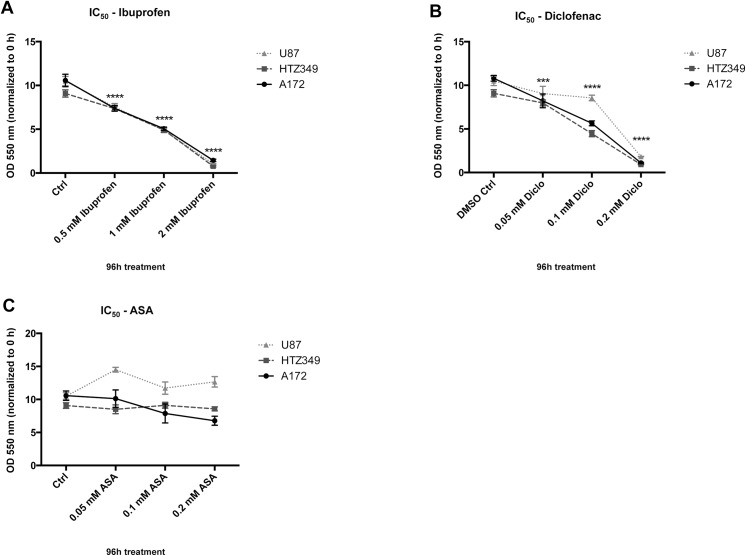
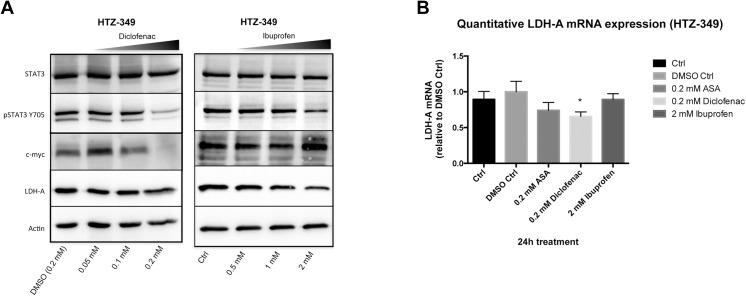
Results: Ibuprofen treatment led to a stronger inhibition of cell growth and migration than treatment with diclofenac. Proliferation was affected by cell cycle arrest at different checkpoints by both agents. In addition, diclofenac, but not ibuprofen, decreased lactate levels in all concentrations used. Both decreased STAT-3 phosphorylation; however, diclofenac led to decreased c-myc expression and subsequent reduction in LDH-A activity, whereas treatment with ibuprofen in higher doses induced c-myc expression and less LDH-A alteration.

Conclusions: This study indicates that both ibuprofen and diclofenac strongly inhibit glioma cells, but the subsequent metabolic responses of both agents are distinct. We postulate that ibuprofen may inhibit tumor cells also by COX- and lactate-independent mechanisms after long-term treatment in physiological dosages, whereas diclofenac mainly acts by inhibition of STAT-3 signaling and downstream modulation of glycolysis.


Conflict of interest statement

Competing Interests: The authors have declared that no competing interests exist.

Figures

Fig 1
Fig 1. IC50 is distinct for diclofenac, ibuprofen, and ASA.
Concentration-dependent cytotoxicity was investigated by treating the glioma cell lines HTZ-349, U87MG, and A172 in absence or presence of increasing concentrations of (A) ibuprofen (0.5–2.0 mM), (B) diclofenac (0.05–0.2 mM), or (C) ASA (0.05–0.2 mM) and DMSO as control in corresponding concentrations. The assays showed a significant linear concentration-dependent decrease of cell viability, which significantly differed between (A) ibuprofen (IC50, 1 mM) and (B) diclofenac (IC50, 0.1 mM). In contrast, (C) ASA had no significant effect on cell proliferation with given concentrations. Statistics: 95% CI, *** = 0.001 < p ≥ 0.0001, **** = p ≤ 0.0001.
Fig 2
Fig 2. Ibuprofen and diclofenac decrease proliferation.
Proliferation was analyzed using crystal violet staining and results were verified via the CyQuant Direct Cell Proliferation assay in HTZ-349. (A) Starting at 72 h, all ibuprofen concentrations (0.5, 1, 2 mM) resulted in significant reduction of HTZ-349 proliferation (compared to non-treated Ctrl, 95% CI, p < 0.05). 2 mM ibuprofen caused significant proliferation inhibition at 24 h (0.01 > p ≤ 0.001) and 48 h (p < 0.0001). (B) Proliferation decrease was verified in CyQuant measurements. Additionally, physiological ibuprofen concentrations (0.05–0.3 mM) were analyzed. Most demonstrated significant proliferation decrease after long-term treatment (144 h) compared to the non-treated controls (0.3–2 mM = p < 0.0001, 0.1 mM = 0.01 > p ≤ 0.001; 95% CI). (C) Similar proliferation reducing effects were obtained with diclofenac at respective concentrations (0.05, 0.1, 0.2 mM) (compared to DMSO control, 95% CI, p < 0.05). The highest concentration of 0.2 mM reached significant proliferation inhibition at 24 and 48 h compared to control (p < 0.0001). (D) CyQuant assay measurements of HTZ-349 treated with diclofenac were broadly in compliance with previously obtained results by crystal violet staining. (E) In contrast, ASA exhibited neither concentration- nor time-dependent effects, and only unspecific effects were observed at 96 h (0.05 mM: 0.05 > p ≤ 0.01) and 120 h (0.2 mM: p < 0.0001). (F) Corresponding CyQuant assay measurements of HTZ-349 treated with ASA verified the results. Treatment of A172 and U87MG cells showed similar results (see S1 Fig).
Fig 3
Fig 3. Ibuprofen and diclofenac led to cell cycle arrest at different checkpoints.
Human glioma cell lines HTZ-349 (A), A172 (B), and U87MG (C) were cultured in the presence of increasing concentrations of diclofenac (0.1, 0.2 mM) or ibuprofen (1, 2 mM) and respective DMSO controls. Cells were harvested for cell cycle analysis after 48 h of incubation. Proliferation was significantly reduced as measured by a reduced number of cells in S-phase in all conditions except 0.1 mM diclofenac in A172 as well as 0.1 and 0.2 mM diclofenac in HTZ-349. With diclofenac treatment, HTZ-349 and U87MG cells showed an accumulation of cells in the G2/M (U87MG) and S-phase (HTZ-349), whereas A172 arrested in the G1 phase. Ibuprofen generated accumulation of cells in the G1 phase in all cell lines. Additional treatment with 0.05–2 mM ibuprofen (D) confirmed dose-dependent accumulation of HTZ-349 in G1 accompanied by a decrease of cells in S- and G2/M-phase. Bar graphs show mean values of three independent experiments. Histograms are depicted in the supplements (S2 Fig) and show representative plots of each treatment condition.
Fig 4
Fig 4. Ibuprofen and diclofenac decrease migration.
Spheroids of human glioma cell line HTZ-349 (5 x 10³ cells/well) were cultured in presence of increasing (A) ibuprofen (0.5–2 mM) or (B) diclofenac concentrations (0.05–0.2mM) and monitored for 30 h. During this time, pictures of cells migrating from the spheroids were taken periodically to monitor migratory capacity at treatment conditions (C) (scale bar = 500 μm). Migration was significantly inhibited by ibuprofen (A) in a time- and concentration-dependent manner. After 24 h, all concentrations demonstrated significantly greater migration over controls (95% CI, **** = p < 0.0001). (D) A high concentration of ibuprofen, 2 mM, resulted in significant migration inhibition noticeable by 6 h (S3A Fig). Diclofenac resulted in similar (B), although less pronounced (D), effects. Measurement of attachment capacities after 0.1 mM ibuprofen (E) or 0.05 mM diclofenac (F) revealed adhesion deficits of HTZ-349 cells compared to controls within the first 30 minutes (95% CI, * = 0.05 > p ≤ 0.01, ** = 0.01 > p ≤ 0.001, *** = 0.001 > p ≤ 0.0001, **** = p < 0.0001.).
Fig 5
Fig 5. Ibuprofen and diclofenac decrease lactate levels and LDH activity.
Human glioma cell lines HTZ-349, A172, and U87MG (105 cells/well) were cultured for 24 h with increasing concentrations of ibuprofen or diclofenac as indicated, then supernatants were harvested for lactate level measurement (A–C). Measurements were normalized to cell number. Diclofenac treatment resulted in a significant decrease of lactate at all concentrations and in all cell lines. In contrast, ibuprofen cause a reduction of lactate accumulation only at concentrations of 2 mM in HTZ-349 and U87MG. These observations are reflected by LDH activity measurements (D) which exhibited decreased activity with increasing concentrations of diclofenac. LDH activity reduction with ibuprofen treatment occurred only at a concentration of 2 mM. Statistics: 95% CI, * = 0.05 > p ≤ 0.01, ** = 0.01 > p ≤ 0.001, *** = 0.001 > p ≤ 0.0001, **** = p < 0.0001.
Fig 6
Fig 6. Ibuprofen and diclofenac affect STAT-3 signalling differentially.
Transcription factors within the STAT-3 signalling pathway were investigated by Western blot (40 μg of protein) after incubation with increasing ibuprofen (0.5, 1, 2 mM) or diclofenac concentrations (0.05, 0.1, 0.2 mM) for 24 h. (A) Ibuprofen and diclofenac reduced STAT-3 phosphorylation in HTZ-349 cells without affecting total STAT-3 levels (for detailed quantification see S5 Fig). The STAT-3 downstream target c-myc was significantly upregulated by ibuprofen (S5A Fig), whereas diclofenac blocked pSTAT-3 and c-myc in a concentration-dependent manner (S5B Fig). LDH-A, a direct target of c-myc, showed negative trends, but not to significant extent. Corresponding quantitative RT-PCR revealed significant LDH-A transcript decrease with diclofenac (0.2 mM, compared to control and DMSO control, 95% CI, * = 0.05 > p ≤ 0.01). Ibuprofen (2 mM) had no impact on LDH-A expression (B). Similar observations were made with ASA (0.2 mM). Corresponding results for A172 and U87MG were generated (see S6 and S7 Figs).
Fig 7
Fig 7. Inhibition of STAT-3 phosphorylation modulates signalling along with functional effects.
STAT-3 phosphorylation at Y705 is inhibited by STATTIC. HTZ-349 cells were exposed to increasing STATTIC concentrations (5, 10, 15/20 μM) for 24 h. (A) pSTAT-3, c-myc, and LDH-A expression were investigated by Western blot (40 μg of protein). A decrease in both phosphorylation of pSTAT-3 and expression of its downstream targets, c-myc and LDH-A, was observed. Total STAT-3 and STAT-3 phosphorylated at the S727 residue remained unchanged (for quantification see S8A Fig). Migration (B) and proliferation (C) showed a significant concentration-dependent inhibition (95% CI, **** = p < 0.0001) with increasing doses of STATTIC. Migration was inhibited significantly from 24 h on with all concentrations (B), whereas proliferation was reduced significantly with 20 μM starting at 48 h (C). LDH-A activity was reduced in a concentration-dependent way, with significance when cells were exposed to 20 μM of STATTIC (D) (95% CI, **** = p < 0.0001).

References

    1. Stupp R, Mason WP, van den Bent MJ, Weller M, Fisher B, Taphoorn MJB, et al. Radiotherapy plus Concomitant and Adjuvant Temozolomide for Glioblastoma. N Engl J Med. 2005;352: 987–996. 10.1056/NEJMoa043330 - DOI - PubMed
    1. Cha YI, DuBois RN. NSAIDs and cancer prevention: targets downstream of COX-2. Annu Rev Med. 2007;58: 239–252. 10.1146/annurev.med.57.121304.131253 - DOI - PubMed
    1. Abnet CC, Freedman ND, Kamangar F, Leitzmann MF, Hollenbeck AR, Schatzkin A. Non-steroidal anti-inflammatory drugs and risk of gastric and oesophageal adenocarcinomas: results from a cohort study and a meta-analysis. Br J Cancer. 2009;100: 551–557. 10.1038/sj.bjc.6604880 - DOI - PMC - PubMed
    1. Harris RE, Beebe-Donk J, Alshafie GA. Reduction in the risk of human breast cancer by selective cyclooxygenase-2 (COX-2) inhibitors. BMC Cancer. 2006;6: 27 10.1186/1471-2407-6-27 - DOI - PMC - PubMed
    1. Harris RE, Namboodiri KK, Farrar WB. Nonsteroidal antiinflammatory drugs and breast cancer. Epidemiology. 1996;7: 203–205. - PubMed

Publication types

MeSH terms

LinkOut - more resources