. 2015 Oct 20:6:8447.
doi: 10.1038/ncomms9447.

Activation and lysis of human CD4 cells latently infected with HIV-1

Affiliations

Activation and lysis of human CD4 cells latently infected with HIV-1

Amarendra Pegu et al. Nat Commun. .

Abstract

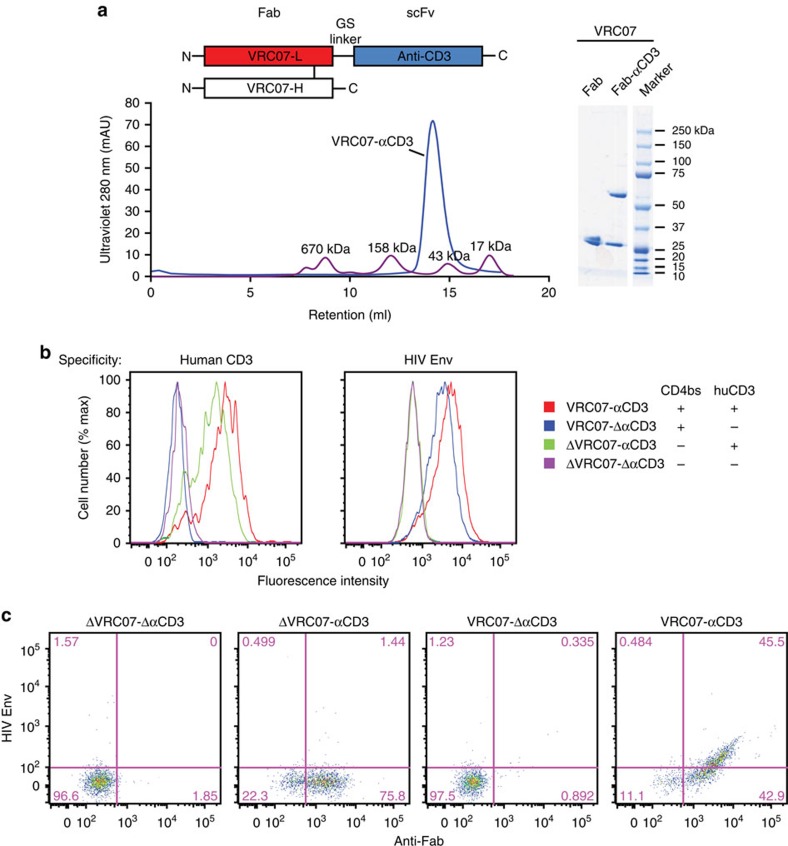
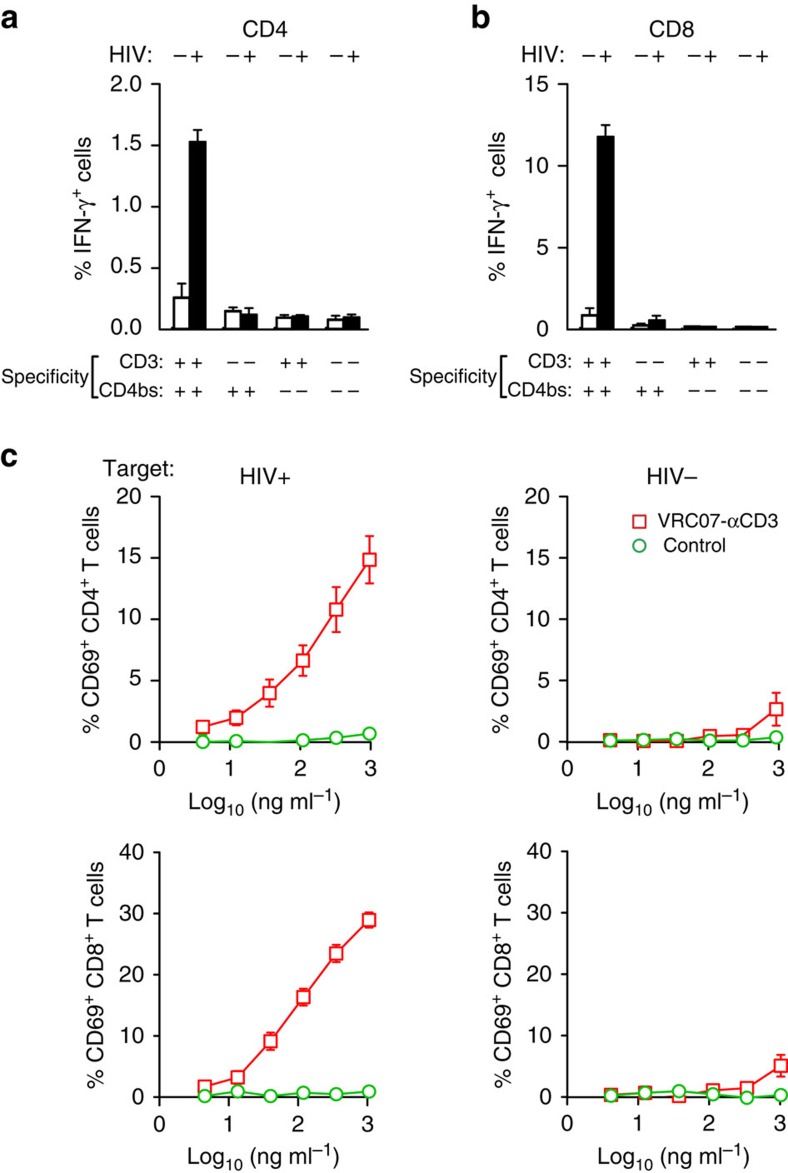
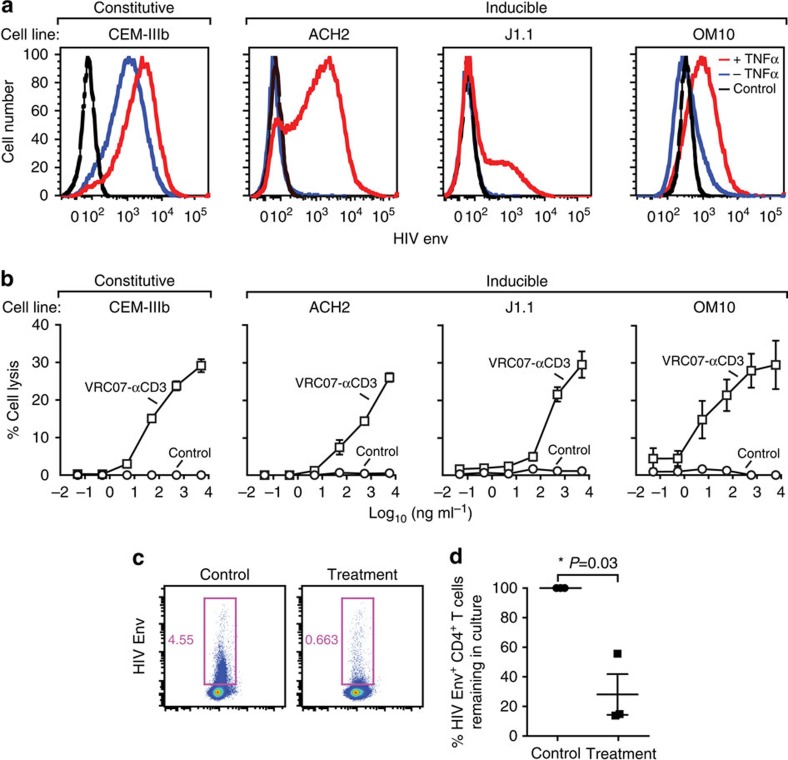
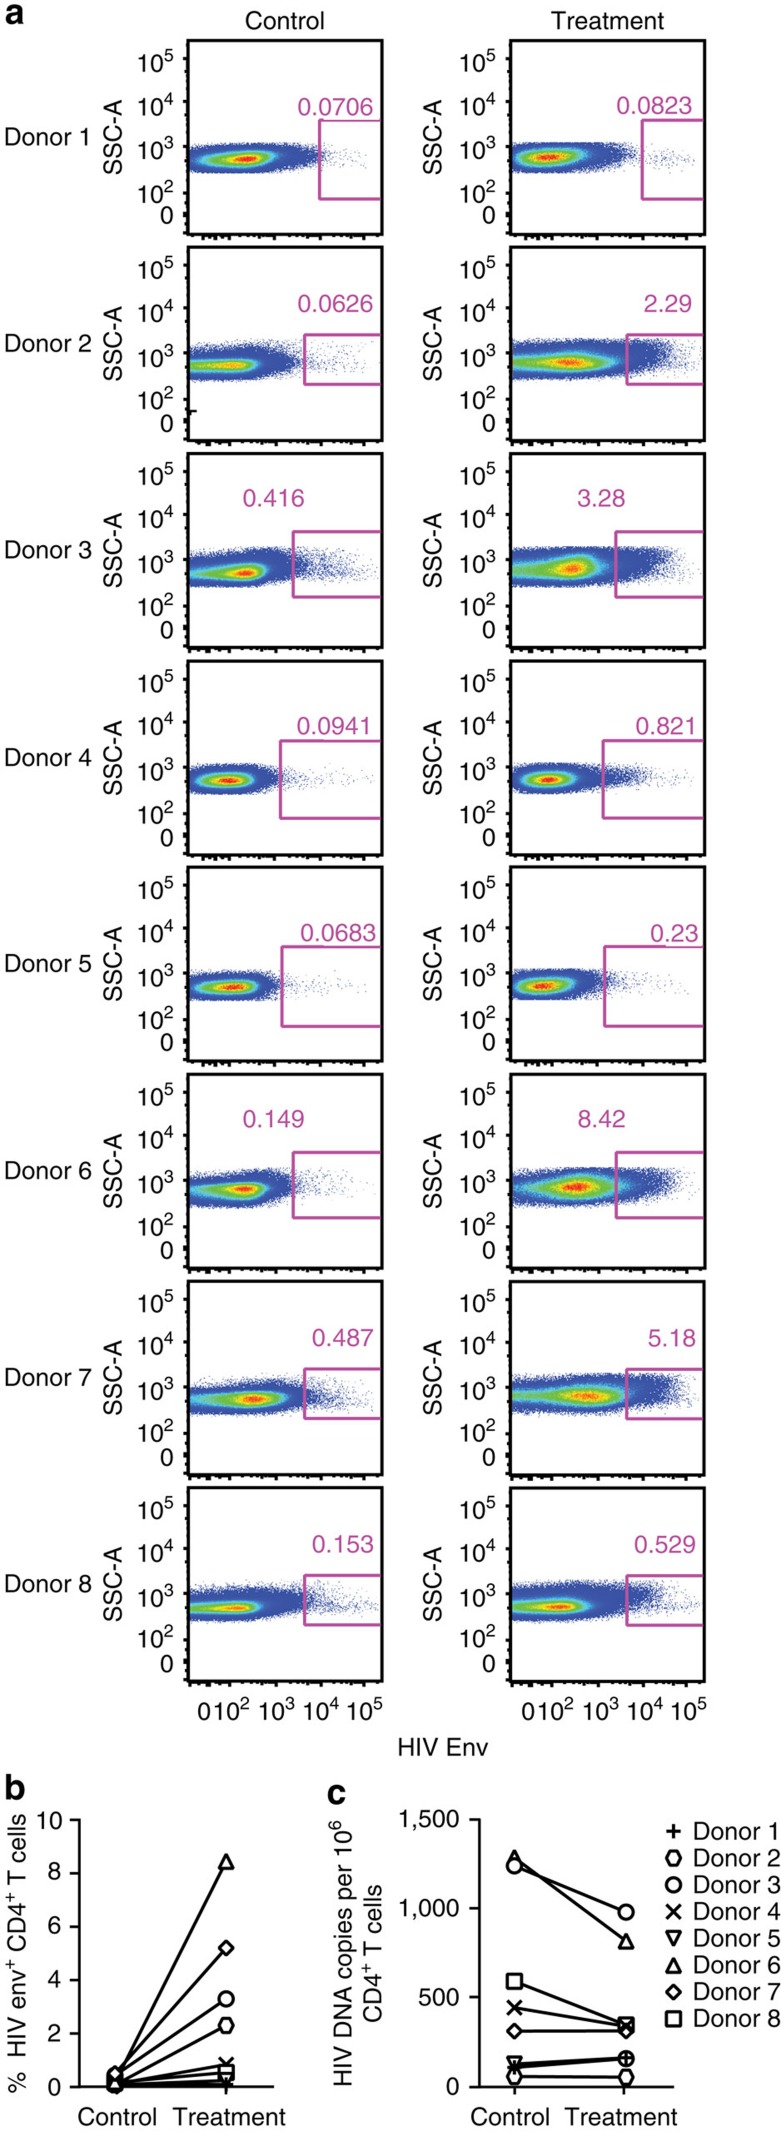
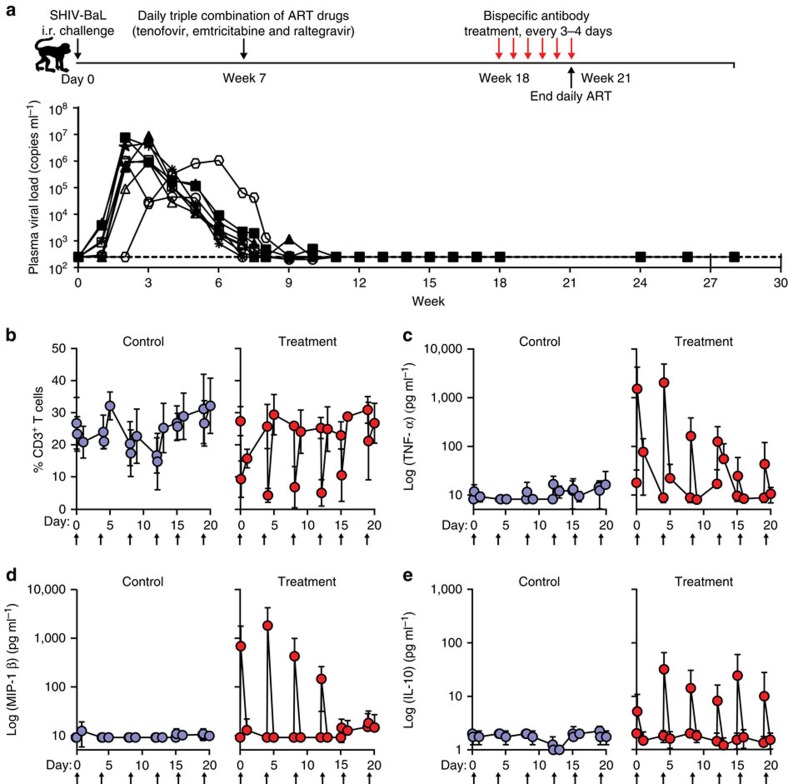
The treatment of AIDS with combination antiretroviral therapy (cART) remains lifelong largely because the virus persists in latent reservoirs. Elimination of latently infected cells could therefore reduce treatment duration and facilitate immune reconstitution. Here we report an approach to reduce the viral reservoir by activating dormant viral gene expression and directing T lymphocytes to lyse previously latent, HIV-1-infected cells. An immunomodulatory protein was created that combines the specificity of a HIV-1 broadly neutralizing antibody with that of an antibody to the CD3 component of the T-cell receptor. CD3 engagement by the protein can stimulate T-cell activation that induces proviral gene expression in latently infected T cells. It further stimulates CD8 T-cell effector function and redirects T cells to lyse these previously latent-infected cells through recognition of newly expressed Env. This immunomodulatory protein could potentially help to eliminate latently infected cells and deplete the viral reservoir in HIV-1-infected individuals.


Figures

Figure 1
Figure 1. Bispecific immunomodulatory protein binds the CD4-binding site (CD4bs) of HIV Env and CD3.
(a) Molecular characterization of the bispecific immunomodulatory protein. The chromatogram of VRC07-αCD3 run through a size exclusion column shows the correct molecular size for the bispecific antibody (left). The heavy and light chain fragments of indicated Fab and bispecific antibodies were analysed by reducing SDS–PAGE gel (right). (b) VRC07-αCD3 binds to CD3 and HIV-1 Env on the cell surface. Human T cells and HIV-1-infected CEM cells were incubated with bispecific antibodies of the indicated specificities, and bound antibodies were detected by a fluorescein isothiocyanate-conjugated anti-Fab probe. (c) The indicated immunodulatory bispecific and control proteins were allowed to bind to naive human T cells and any protein bound to the T cells was detected with flow cytometry after dual staining with fluorescently labelled anti-human Fab and HIV-1 Env (RSC3) probes.
Figure 2
Figure 2. Activation of T cells by an immunomodulatory protein targeting the CD4bs of HIV Env and CD3.
(a) CD4+ and (b) CD8+ T cells are specifically activated by the bispecific protein. Enriched human T cells were co-cultured with either uninfected or HIV-infected CEM cells (indicated by − or + at the top of each column) in the presence of the indicated bispecific proteins (0.5 μg ml−1) and Brefeldin A overnight. The T cells were then stained with an antibody against IFN-γ, and the percentage of T cells expressing IFN-γ was measured using flow cytometry. Representative data from three independent experiments are shown, with each experiment performed with three technical replicates. The error bar represents the s.e. (c) Effector cells comprising PBMCs were co-cultured with or without target cells that were either uninfected or HIV-infected CEM cells (indicated by HIV− or HIV+ at the top of each column) in the presence of increasing concentrations of the indicated bispecific proteins and Brefeldin A overnight. The T cells were then stained with an antibody against CD69, and the percentage of T cells expressing CD69 was measured using flow cytometry. The mean of the values at each concentration from three naive donors are shown, with each experiment performed with three technical replicates. Error bars indicate the s.e. at each concentration.
Figure 3
Figure 3. Activation and targeted lysis of chronic and latent HIV-infected cells by VRC07-αCD3.
(a) Induction of HIV in latent cell lines. Latent cell lines (ACH2, J1.1 and OM10) and a chronic cell line (CEM-IIIb) were cultured in the absence or presence of TNF-α for 14– 16 h and the expression of HIV Env on the cell surface using an allophycocyanin (APC)-conjugated 2G12 was measured using flow cytometry. The increase in the expression of HIV Env indicates the inducible expression in the latent cell lines compared with the constitutive expression in the chronic cell line. (b) Targeted lysis of HIV-infected cell lines by VRC07-αCD3. The indicated chronic and latent HIV-infected cell lines were co-cultured with enriched human T cells in the presence of increasing concentrations of VRC07-αCD3 or the indicated mutant control proteins for 14–16 h and per cent lysis of the infected cell line was measured using flow cytometry after staining with a live/dead cell marker. All three monospecific or double-negative controls gave similar results and therefore only one control (double negative) antibody is shown. Representative data from three independent experiments are shown, with each experiment performed with three technical replicates. Error bars indicate the s.e. at each concentration. (c,d) Reduction in the number of latently infected primary CD4+ T cells. Resting CD4+ T cells were enriched from PBMCs and infected with HIV-1 BaL after culture in the presence of CCL19 for 3 days. These CD4+ T cells were then co-cultured with allogeneic CD8+ T cells in the presence of VRC07-αCD3 or the double-negative control protein for 14–16 h. The expression of HIV Env on the surface of CD4+ T cells was then measured by flow staining with a fluorescently labelled 2G12 antibody. Representative data from one donor are shown in c, and data from three independent donors showing a statistically significant reduction (P=0.03, paired two-tailed t-test) in HIV Env+ CD4 T cells in the presence of the immunomodulatory proteins is plotted in d. The mean value is plotted and the error bars represent the s.e.
Figure 4
Figure 4. Activation and reduction in the number of latently infected CD4+ T cells ex vivo.
PBMCs obtained from eight HIV-1-infected donors on ART were incubated with the VRC07-αCD3 (Treatment) or a control-bispecific protein that has an active anti-CD3 arm but lacks active VRC07 Fab binding (Control) for 2 days. (a) The expression of cell surface HIV Env on live CD4+ T cells was detected on day 2 by flow cytometry using an APC-conjugated PGT121 antibody, and the plots for expression of HIV Env on live CD4+ T cells for all eight donors are shown. (b) The surface expression of HIV Env in control versus treatment groups on day 2 are plotted for each donor. The levels were normalized to the total percentage of CD4+ T lymphocytes in the live CD3+ T lymphocyte population as determined using flow cytometric analysis. (c) The live CD4+ T cells on day 2 were also sorted by FACS and the levels of HIV gag DNA in this population was quantitated by real-time PCR. The levels of HIV gag DNA in control versus treatment groups are plotted for each donor after normalization for cell numbers by detection of a housekeeping gene (albumin) in the real-time PCR assay. Because each assay is standardized separately, comparisons can be made within each group but not between them, for example, they do not reflect the per cent of Env+ cells relative to those containing proviral DNA.
Figure 5
Figure 5. Treatment of SHIV-BaLP4-infected animals with a bispecific immunomodulatory protein.
(a) Top, experimental schema for the bispecific immunomodulatory protein treatment in which naive rhesus macaques were challenged with SHIV-BaL intrarectally on day 0. At week 7, daily ART was initiated, and the bispecific immunomodulatory or control protein (25 μg kg−1), either VRC07-α-rhesusCD3 (treatment, n=5) or a control-bispecific antibody that does not bind to either HIV env or rhesus CD3 (control, n=4), respectively, were administered every 3–4 days starting at week 18 for a total of six doses. (a) Bottom, plasma viraemia in SHIV-BaLP4-infected rhesus macaques that were treated with daily ART beginning on week 7 followed by bispecific immunomodulatory protein treatment on week 18. (b) A rapid reversible decline in CD3+ T cells was detected in the treatment group 1 h after infusion, which returned to normal levels by 24 h. Infusions are indicated by arrows and the decline is less prominent after infusion 5. Increased levels of TNF-α (c), MIP-1β (d) and IL-10 (e) were detected transiently in VRC07-α-rhesusCD3-treated animals (right) 1 h after infusion during the first four doses, which was less remarkable after day 14. Values represent means±s.e.'s.

References

    1. Chun T. W. & Fauci A. S. HIV reservoirs: pathogenesis and obstacles to viral eradication and cure. AIDS 26, 1261–1268 (2012). - PubMed
    1. Siliciano J. D. & Siliciano R. F. HIV-1 eradication strategies: design and assessment. Curr. Opin. HIV AIDS 8, 318–325 (2013). - PMC - PubMed
    1. Deeks S. G. et al. Towards an HIV cure: a global scientific strategy. Nat. Rev. Immunol. 12, 607–614 (2012). - PMC - PubMed
    1. Margolis D. M. & Hazuda D. J. Combined approaches for HIV cure. Curr. Opin. HIV AIDS 8, 230–235 (2013). - PMC - PubMed
    1. van Praag R. M. et al. OKT3 and IL-2 treatment for purging of the latent HIV-1 reservoir in vivo results in selective long-lasting CD4+ T cell depletion. J. Clin. Immunol. 21, 218–226 (2001). - PubMed

Publication types

MeSH terms