

Protection by dietary restriction in the YAC128 mouse model of Huntington's disease: Relation to genes regulating histone acetylation and HTT
- PMID: 26485309
- PMCID: PMC4820332
- DOI: 10.1016/j.nbd.2015.09.012
Protection by dietary restriction in the YAC128 mouse model of Huntington's disease: Relation to genes regulating histone acetylation and HTT
Abstract
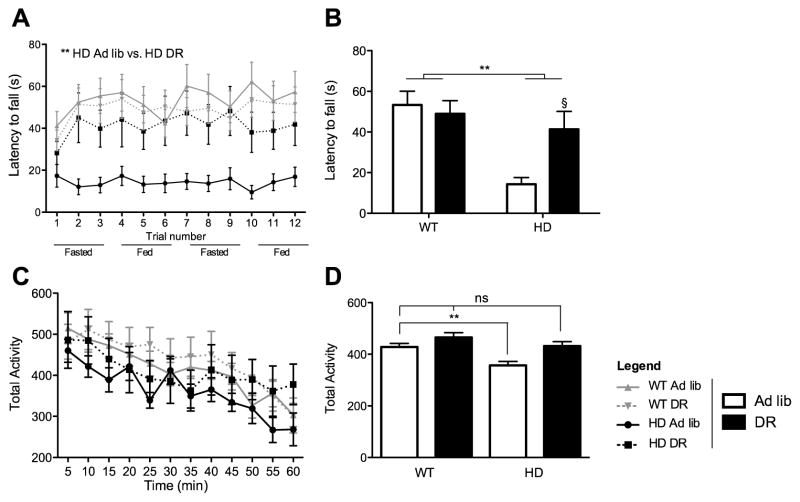
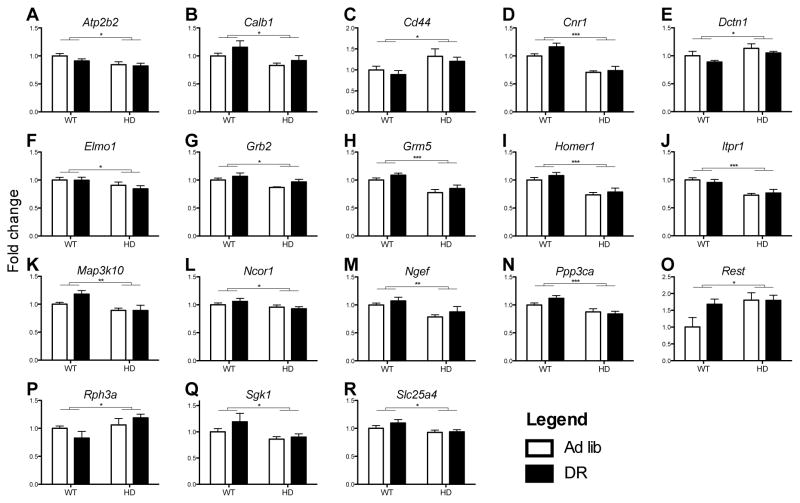
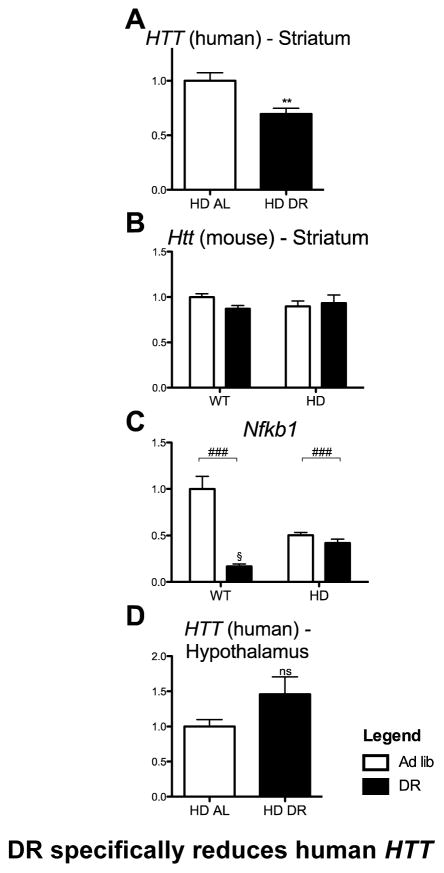
Huntington's disease (HD) is a fatal neurodegenerative disease characterized by metabolic, cognitive, and motor deficits. HD is caused by an expanded CAG repeat in the first exon of the HTT gene, resulting in an expanded polyglutamine section. Dietary restriction (DR) increases lifespan and ameliorates age-related pathologies, including in a model of HD, but the mechanisms mediating these protective effects are unknown. We report metabolic and behavioral effects of DR in the full-length YAC128 HD mouse model, and associated transcriptional changes in hypothalamus and striatum. DR corrected many effects of the transgene including increased body weight, decreased blood glucose, and impaired motor function. These changes were associated with reduced striatal human (but not mouse) HTT expression, as well as alteration in gene expression regulating histone acetylation modifications, particularly Hdac2. Other mRNAs related to Huntington's pathology in striatal tissue showed significant modulation by the transgene, dietary restriction or both. These results establish a protective role of DR in a transgenic model that contains the complete human HTT gene and for the first time suggest a role for DR in lowering HTT level, which correlates with severity of symptoms.
Keywords: Creb-binding protein; Dietary restriction; HDAC; HTT; Huntington's disease; NF-κB; YAC128.
Copyright © 2015 Elsevier Inc. All rights reserved.
Conflict of interest statement
The authors declare that they have no competing interests
Figures


Similar articles
-
Full length mutant huntingtin is required for altered Ca2+ signaling and apoptosis of striatal neurons in the YAC mouse model of Huntington's disease.Neurobiol Dis. 2008 Jul;31(1):80-8. doi: 10.1016/j.nbd.2008.03.010. Epub 2008 Apr 16. Neurobiol Dis. 2008. PMID: 18502655 Free PMC article.
-
Antisense oligonucleotide-mediated correction of transcriptional dysregulation is correlated with behavioral benefits in the YAC128 mouse model of Huntington's disease.J Huntingtons Dis. 2013;2(2):217-28. doi: 10.3233/JHD-130057. J Huntingtons Dis. 2013. PMID: 25063516
-
Mitogen- and stress-activated protein kinase-1 deficiency is involved in expanded-huntingtin-induced transcriptional dysregulation and striatal death.FASEB J. 2008 Apr;22(4):1083-93. doi: 10.1096/fj.07-9814. Epub 2007 Nov 20. FASEB J. 2008. PMID: 18029446
-
Transcriptional dysregulation of coding and non-coding genes in cellular models of Huntington's disease.Biochem Soc Trans. 2009 Dec;37(Pt 6):1270-5. doi: 10.1042/BST0371270. Biochem Soc Trans. 2009. PMID: 19909260 Review.
-
Selective degeneration in YAC mouse models of Huntington disease.Brain Res Bull. 2007 Apr 30;72(2-3):124-31. doi: 10.1016/j.brainresbull.2006.10.018. Epub 2006 Nov 16. Brain Res Bull. 2007. PMID: 17352936 Review.
Cited by
-
Hippocampal Changes Elicited by Metabolic and Inflammatory Stressors following Prenatal Maternal Infection.Genes (Basel). 2022 Dec 26;14(1):77. doi: 10.3390/genes14010077. Genes (Basel). 2022. PMID: 36672818 Free PMC article.
-
Evaluating the beneficial effects of dietary restrictions: A framework for precision nutrigeroscience.Cell Metab. 2021 Nov 2;33(11):2142-2173. doi: 10.1016/j.cmet.2021.08.018. Epub 2021 Sep 22. Cell Metab. 2021. PMID: 34555343 Free PMC article. Review.
-
Glucose-Induced Transcriptional Hysteresis: Role in Obesity, Metabolic Memory, Diabetes, and Aging.Front Endocrinol (Lausanne). 2018 May 28;9:232. doi: 10.3389/fendo.2018.00232. eCollection 2018. Front Endocrinol (Lausanne). 2018. PMID: 29892261 Free PMC article. Review.
-
Polyglutamine-Expanded Huntingtin Exacerbates Age-Related Disruption of Nuclear Integrity and Nucleocytoplasmic Transport.Neuron. 2017 Apr 5;94(1):48-57.e4. doi: 10.1016/j.neuron.2017.03.027. Neuron. 2017. PMID: 28384474 Free PMC article.
-
Huntington's disease genotype suppresses global manganese-responsive processes in pre-manifest and manifest YAC128 mice.Metallomics. 2020 Jul 22;12(7):1118-1130. doi: 10.1039/d0mt00081g. Metallomics. 2020. PMID: 32421118 Free PMC article.
References
-
- Anson RM, Guo Z, de Cabo R, Iyun T, Rios M, Hagepanos A, Ingram DK, Lane MA, Mattson MP. Intermittent fasting dissociates beneficial effects of dietary restriction on glucose metabolism and neuronal resistance to injury from calorie intake. Proc Natl Acad Sci U S A. 2003;100:6216–20. doi: 10.1073/pnas.1035720100. - DOI - PMC - PubMed
-
- Bečanović K, Nørremølle A, Neal SJ, Kay C, Collins JA, Arenillas D, Lilja T, Gaudenzi G, Manoharan S, Doty CN, Beck J, Lahiri N, Portales-Casamar E, Warby SC, Connolly C, De Souza RAG, Tabrizi SJ, Hermanson O, Langbehn DR, Hayden MR, Wasserman WW, Leavitt BR. A SNP in the HTT promoter alters NF-κB binding and is a bidirectional genetic modifier of Huntington disease. Nat Neurosci. 2015;18:807–816. doi: 10.1038/nn.4014. - DOI - PubMed
Publication types
MeSH terms
Substances
Grants and funding
LinkOut - more resources
Full Text Sources
Other Literature Sources
Medical
Molecular Biology Databases
