

Cortical localization of phase and amplitude dynamics predicting access to somatosensory awareness
- PMID: 26485310
- PMCID: PMC6867440
- DOI: 10.1002/hbm.23033
Cortical localization of phase and amplitude dynamics predicting access to somatosensory awareness
Abstract
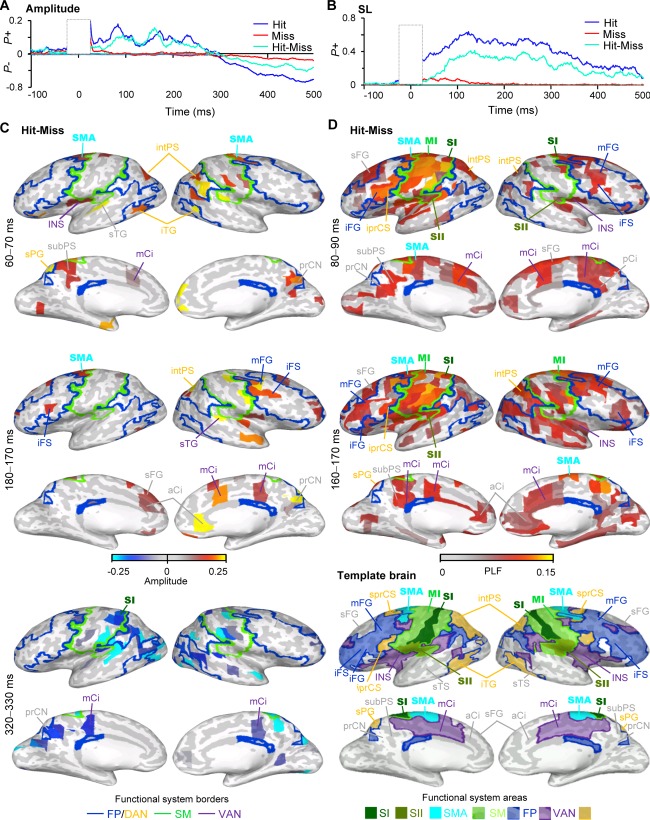
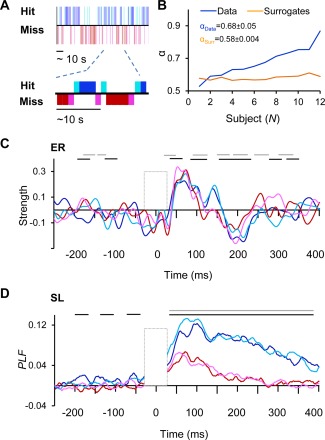
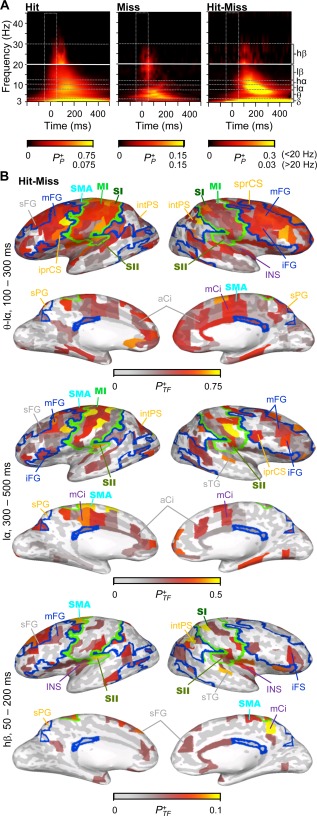
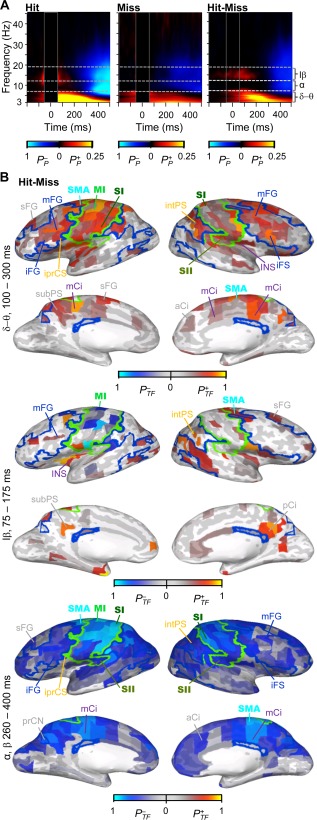
Neural dynamics leading to conscious sensory perception have remained enigmatic in despite of large interest. Human functional magnetic resonance imaging (fMRI) studies have revealed that a co-activation of sensory and frontoparietal areas is crucial for conscious sensory perception in the several second time-scale of BOLD signal fluctuations. Electrophysiological recordings with magneto- and electroencephalography (MEG and EEG) and intracranial EEG (iEEG) have shown that event related responses (ERs), phase-locking of neuronal activity, and oscillation amplitude modulations in sub-second timescales are greater for consciously perceived than for unperceived stimuli. The cortical sources of ER and oscillation dynamics predicting the conscious perception have, however, remained unclear because these prior studies have utilized MEG/EEG sensor-level analyses or iEEG with limited neuroanatomical coverage. We used a somatosensory detection task, magnetoencephalography (MEG), and cortically constrained source reconstruction to identify the cortical areas where ERs, local poststimulus amplitudes and phase-locking of neuronal activity are predictive of the conscious access of somatosensory information. We show here that strengthened ERs, phase-locking to stimulus onset (SL), and induced oscillations amplitude modulations all predicted conscious somatosensory perception, but the most robust and widespread of these was SL that was sustained in low-alpha (6-10 Hz) band. The strength of SL and to a lesser extent that of ER predicted conscious perception in the somatosensory, lateral and medial frontal, posterior parietal, and in the cingulate cortex. These data suggest that a rapid phase-reorganization and concurrent oscillation amplitude modulations in these areas play an instrumental role in the emergence of a conscious percept.
Keywords: MEG; conscious; cortex; oscillation; perception; somatosensory; source.
© 2015 Wiley Periodicals, Inc.
Figures


Similar articles
-
Early neural correlates of conscious somatosensory perception.J Neurosci. 2005 May 25;25(21):5248-58. doi: 10.1523/JNEUROSCI.0141-05.2005. J Neurosci. 2005. PMID: 15917465 Free PMC article.
-
Pre-stimulus alpha oscillation and post-stimulus cortical activity differ in localization between consciously perceived and missed near-threshold somatosensory stimuli.Eur J Neurosci. 2021 Aug;54(4):5518-5530. doi: 10.1111/ejn.15388. Epub 2021 Jul 20. Eur J Neurosci. 2021. PMID: 34251060 Free PMC article.
-
Imperceptible somatosensory stimulation alters sensorimotor background rhythm and connectivity.J Neurosci. 2015 Apr 15;35(15):5917-25. doi: 10.1523/JNEUROSCI.3806-14.2015. J Neurosci. 2015. PMID: 25878264 Free PMC article.
-
Sensorimotor and cognitive involvement of the beta-gamma oscillation in the frontal N30 component of somatosensory evoked potentials.Neuropsychologia. 2015 Dec;79(Pt B):215-22. doi: 10.1016/j.neuropsychologia.2015.04.033. Epub 2015 May 19. Neuropsychologia. 2015. PMID: 26002756 Review.
-
Tracking functions of cortical networks on a millisecond timescale.Neural Netw. 2000 Oct-Nov;13(8-9):883-9. doi: 10.1016/s0893-6080(00)00061-7. Neural Netw. 2000. PMID: 11156199 Review.
Cited by
-
Towards a fourth spatial dimension of brain activity.Cogn Neurodyn. 2016 Jun;10(3):189-99. doi: 10.1007/s11571-016-9379-z. Epub 2016 Feb 3. Cogn Neurodyn. 2016. PMID: 27275375 Free PMC article. Review.
-
Rhythmicity of neuronal oscillations delineates their cortical and spectral architecture.Commun Biol. 2024 Apr 3;7(1):405. doi: 10.1038/s42003-024-06083-y. Commun Biol. 2024. PMID: 38570628 Free PMC article.
-
Linking heartbeats with the cortical network dynamics involved in self-social touch distinction.Commun Biol. 2025 Jan 14;8(1):52. doi: 10.1038/s42003-024-07448-z. Commun Biol. 2025. PMID: 39809818 Free PMC article.
-
Designing Brains for Pain: Human to Mollusc.Front Physiol. 2018 Aug 2;9:1027. doi: 10.3389/fphys.2018.01027. eCollection 2018. Front Physiol. 2018. PMID: 30127750 Free PMC article.
-
Dynamic large-scale network synchronization from perception to action.Netw Neurosci. 2018 Oct 1;2(4):442-463. doi: 10.1162/netn_a_00039. eCollection 2018. Netw Neurosci. 2018. PMID: 30320293 Free PMC article.
References
-
- Baars BJ ( 1988): A Cognitive Theory of Consciousness. Cambridge: Cambridge University Press; pp 448.
-
- Bar M, Tootell RB, Schacter DL, Greve DN, Fischl B, Mendola JD, Rosen BR, Dale AM (2001): Cortical mechanisms specific to explicit visual object recognition. Neuron 29:529–535. - PubMed
-
- Bell AJ, Sejnowski TJ (1995): An information‐maximization approach to blind separation and blind deconvolution. Neural Comput 7:1129–1159. - PubMed
Publication types
MeSH terms
LinkOut - more resources
Full Text Sources
Other Literature Sources
